Download presentation
Presentation is loading. Please wait.

1
Imaging of cirrhosis Valérie Vilgrain Service de Radiologie
Hôpital Beaujon France

2
Cirrhosis Extensive fibrosis and regenerative nodules
Main causes alcohol ingestion chronic hepatitis C chronic hepatitis B hemochromatosis Wilson disease Micronodular nodules < 3 mm Macronodular larger nodules

3
Diagnosis Liver diseases mimicking cirrhosis Prognosis Non invasive diagnosis of fibrosis

4
Diagnosis of cirrhosis
Nodularity of the liver surface Nodular internal architecture Changes of hepatic morphology Vascular changes Portal hypertension

5
Nodularity of the liver surface Nodular internal architecture
Correlate with the gross appearance of cirrhosis Surface . Initially described with high frequency transducer . Seen with US, CT and MR Internal architecture . Best seen with US and MR . Regenerative nodules hypoechoic - hypointense . Septa hyperechoic - hyperintense Dilelio, Radiology 1989

6
Cirrhosis Surface nodularity
Se Sp Accuracy Di Lelio Richard Ferral Ladenheim Colli 54 95 Radiology 1989 J. Radiol 1985 Gastrointest 1992 Radiology 1992 Radiology 2003

8
Hepatic morphologic changes

9
Hepatic morphologic changes Quantitative results (1)
Caudate lobe Caudate-right lobe ratio (> 0.65) Modified caudate-right lobe ratio (> 0.90) Harbin, Radiology 1980 Awaya, Radiology 2002
 Modified caudate-right lobe ratio (> 0.90) Harbin, Radiology Awaya, Radiology")
10
Hepatic morphologic changes Quantitative results (2)
Segment 4 Control group 43 ± 8 mm Cirrhosis ± 9 mm Cutoff: 30 mm Limit: measurement obtained at US Lafortune, Radiology 1998

11
Hepatic morphologic changes Other signs
Expanded gallbladder fossa Specificity and PPV of 98% Associated with atrophy of the segment 4 Enlargment of hilar periportal space Seen in 98% in early cirrhosis Cutoff of 10 mm . Control group: 5.3 mm . Cirrhosis: mm Ito, Radiology 1999 Ito, JMRI 2000

12
Vascular changes Hepatic veins Normally triphasic Cirrhosis
decreased diameter altered waveform in 50% correlated with the severity reduced transit time (contrast US) Bolondi, Radiology 1991 Colli, AJR 1994 Albrecht, Lancet 1999
 Bolondi, Radiology Colli, AJR Albrecht, Lancet")
13
Vascular changes Hepatic artery HA diastolic velocity > PV velocity
Increased HA diameter Increased RI and PI of the hepatic artery Portal vein velocity Liver vascular index = Hepatic artery PI < 12 cm/sec Iwao, Am J Gastroenterol 1997

14
Portal hypertension Increased pressure > 15 mm Hg
Portocaval gradient > 5 mm Hg Portal hemodynamics Collaterals Ascites Splenomegaly

15
Diagnosis of PHT Splanchnic veins
Enlargment of splanchnic veins Lack of caliber variations of SMV Reversed flow SMV 2.1% splenic vein 3.1% Alpern, Radiology 1987 Bolondi, Radiology 1982

16
Diagnosis of PHT Diameter of the portal vein > 13 mm Se 40%
Alterations of portal blood flow abs of end-diastolic arterialized flow bidirectional flow reversed flow 1% Bolondi, Radiology 1982 Vilgrain, Gastrointest Radiol 1990 Lafortune 1990 Gaiani, Gastroenterology 1991

17
Diagnosis of PHT Left gastric vein
Diameter > 6 mm 26% Hepatofugal flow 78% Wachsberg, AJR 1994

18
Diagnosis of PHT Gastroesophageal veins

20
Diagnosis of PHT Paraumbilical vein

21
Diagnosis of PHT Splenorenal veins

23
Diagnosis of PHT Other collaterals
Retroperitoneal veins Omental veins Rectal varices Gallbladder varices

24
Diagnosis of PHT Mean portal velocity Mean portal blood flow
cm/sec ml/min controls cirrhosis controls cirrhosis Gaiani et al 19 625 Moriyasu et al 15.3 289 Zoli et al 16 46 Ohnishi et al 17 258 Gaiani, Hepatology 1989 Moriyasu, AJR 1986 Zoli, J Ultrasound Med 1985 Ohnishi, Gastroenterology 1985

25
Cirrhosis Ultrasound-Score
Accuracy Surface nodularity + mean portal velocity 82% Spleen length 84% + mean portal velocity Spleen length 89% +mean portal velocity +hepatic venous spectrum Gaiani, J Hepatol 1997 Aubé, J Hepatol 1999 Aubé, Eur J Gastroentrol 2004

26
Liver diseases mimicking cirrhosis
Common findings Morphologic changes of the liver May give signs of PHT Generally vascular or biliary diseases But Rarely cause nodularity of the liver surface Rarely have nodular regeneration

27
Primary sclerosing cholangitis
Lobular contour 73% Caudate hypertrophy 98% Lateral segment atrophy 58% Posterior segment atrophy 36% Dilated ducts 67% End stage disease Dodd, Radiology 1999

28
Congenital hepatic fibrosis
Mean age 39 years Liver morphologic abnormalities 89% Splenomegaly 83% Varices 78% Renal abnormalities 56% Ductal plate malformation 50% Zeitoun, Radiology 2004

29
Congenital hepatic fibrosis
Hypertrophy of the left lateral Normal or hypertrophy of the segment 4 Atrophy of the right lobe Zeitoun, Radiology 2004

30
Budd-Chiari disease Hypertrophy of the caudate lobe > 50%
Lobar atrophy/hypertrophy Abnormal hepatic veins Hepatic venous collaterals

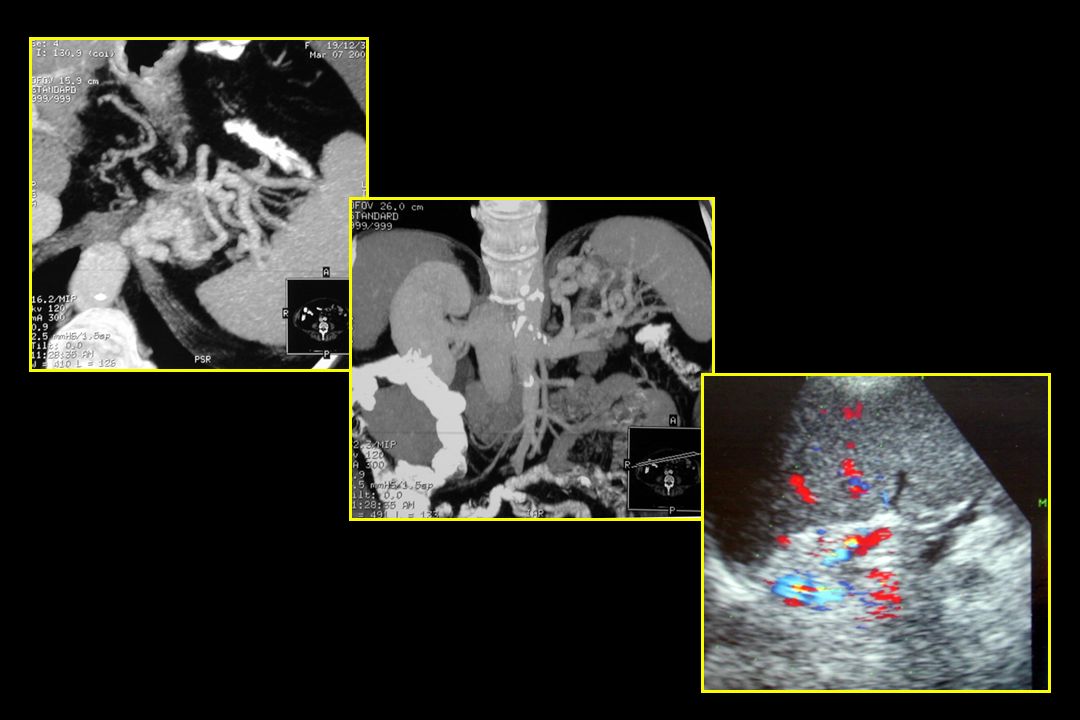
31
Portal cavernoma Central vs peripheral zone Vilgrain, Radiology 2006

32
Imaging in assessing prognosis?
Comparison between compensated and uncompensated cirrhosis Serial imaging Stability and functional reserve . Hypertrophy and increasing of the caudate lobe 1, 2, 3 . High caudate to right lobe ratio 1 . Increasing lateral segment 2 Clinical progression . Progressive atrophy of the right lobe and medial segment 2 . Spleen enlargment 3 . Varices 3 1. Watanabe, Dig Dis Sci 1999 2. Ito, Radiology 1998 3. Ito, AJR 1997

33
Limitations of non invasive imaging
Most signs seen in advanced cirrhosis No specific signs associated with fibrosis => Need to find other criteria other imaging

34
Diagnosis of fibrosis Blood tests: Fibrotest Elastrography
Liver MR diffusion Liver perfusion

35
Fibrotest Alpha 2 macroglobulin Haptoglobin Apolipoprotein 1
Total bilirubin GGT ALT Probability of fibrosis < 10% Liver biopsy recommended Probability of fibrosis > 90% Imbert-Bismuth, Lancet 2001

36
Elastography (Fibroscan)
Ultrasound (5MHz) and low frequency (50 Hz) elastic waves Propagation velocity is related to elasticity
 and low frequency. (50 Hz) elastic waves. Propagation velocity is related to elasticity.")
37
Liver MR diffusion Reduced ADC in cirrhosis Taouli, Radiology 2003

38
Liver perfusion Van Beers, AJR 2001

39
CONCLUSION Today, non invasive imaging is crucial for diagnosing cirrhosis and its complications. Tomorrow, the challenge of imaging will be to detect early stages of fibrosis and cirrhosis and to demonstrate therapeutic response.

Similar presentations


 and the portal vein ( 75% of vascularization).>")


 that progresses to cirrhosis Replacement of liver tissue.>")


