Download presentation
Presentation is loading. Please wait.

1
Our State Budget: Building a Better Future Together Massachusetts Budget and Policy Center 15 Court Square, Suite 700, Boston, MA 02108 617.426.1228 www.massbudget.org

2
Education

3
Transportation

4
Libraries, Parks and Recreation

5
Public Safety

6
Clean Air and Safe Drinking Water

7
Prisons and the Courts

8
Health Care and Public Health

9
Human Services

10
What Percent of our Income Funds these Programs?

11
Taxes as Percent of Personal Income, 2011 State and Local Taxes 10.4%

12
Mass. Taxes are About Average, 2011 US 10.6% MA 10.4%

13
Why We are Called “Taxachusetts” US 11.4% MA 13.8% Fiscal Year 1977

14
MA Taxes Among Largest Declines: 1977- 2011 US 7.3% Decrease MA 25.0% Decrease

21
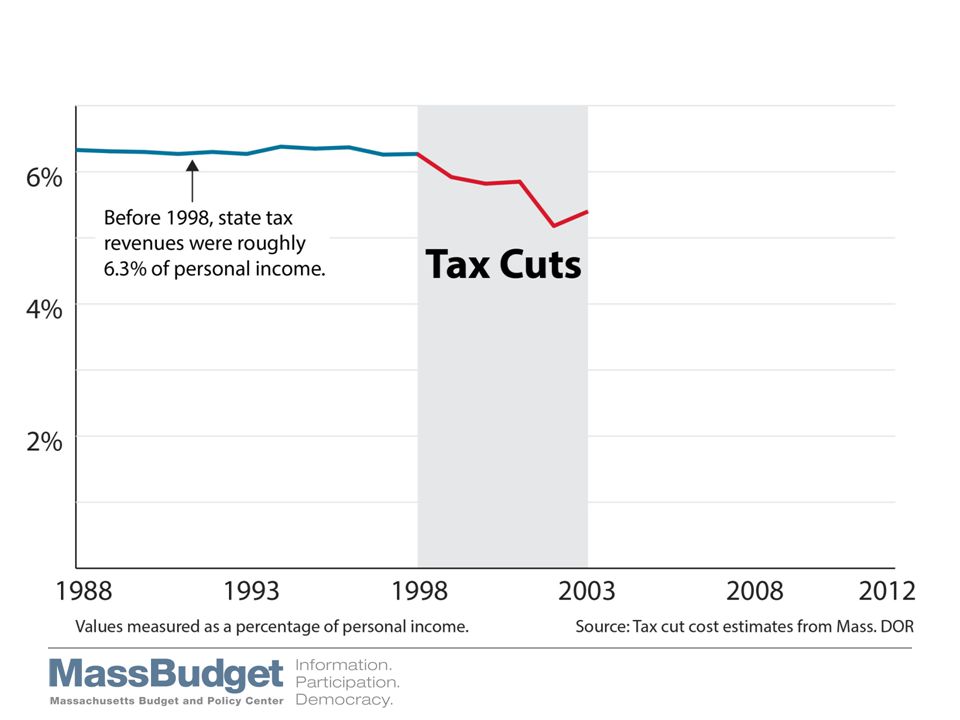
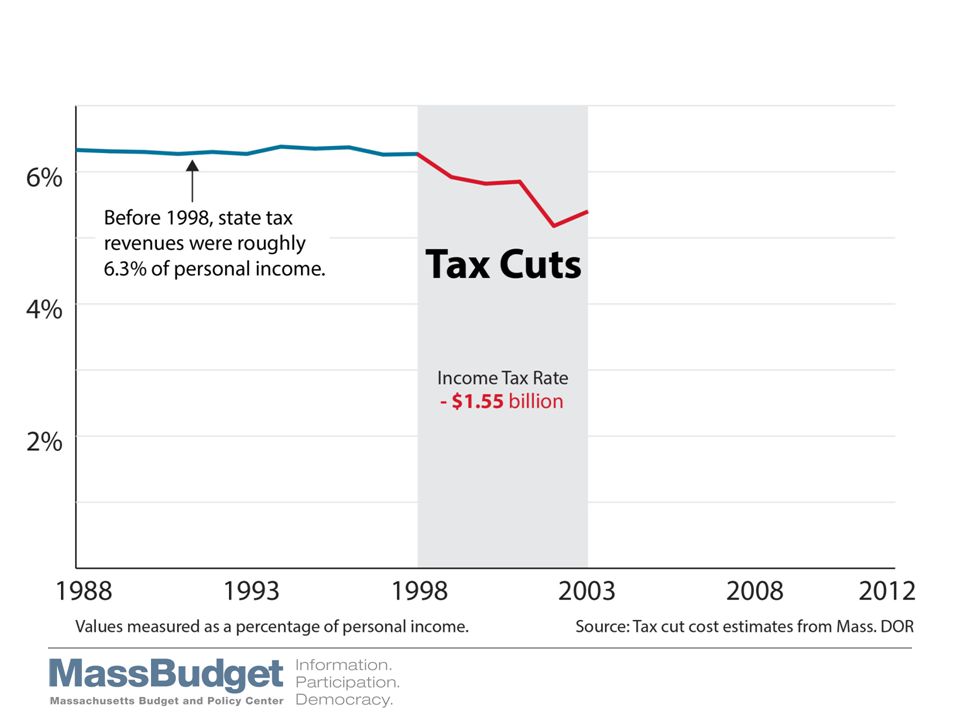
Tax Cuts Have Affected Services

22
Chapter 70 Education Aid Billions, Inflation Adjusted Includes ARRA funding; Adjusted using the inflation factor identified in Chapter 70 4.4% decrease since FY01

23
Local Aid Billions, Inflation Adjusted

24
Early Education and Care Millions, Inflation Adjusted

25
Higher Education Billions, Inflation Adjusted

26
Public Health Millions, Inflation Adjusted

27
Human Services Billions, Inflation Adjusted

28
Mental Health Millions, Inflation Adjusted 12% decrease since FY01 Some costs shifted

29
Environment and Recreation Millions, Inflation Adjusted 35% decrease since FY01

30
A Tax System Should Be... Adequate Stable Simple/Efficient Fair

31
The Sales Tax is Regressive Income Range: Lowest 20% Second 20% Middle 20% Fourth 20% Next 15% Next 4% Top 1% Top 20%

32
Why the Sales Tax is Regressive Source: Bureau of Labor Statistics, Consumer Expenditures Survey, 2008 Lowest 20% Second 20% Middle 20% Fourth 20% Top 20%

33
The Property Tax is Regressive Income Range: Lowest 20% Second 20% Middle 20% Fourth 20% Next 15% Next 4% Top 1% Top 20%

34
The Income Tax is Progressive Income Range: Lowest 20% Second 20% Middle 20% Fourth 20% Next 15% Next 4% Top 1% Top 20%

35
State and Local Taxes are Regressive Income Range: Lowest 20% Second 20% Middle 20% Fourth 20% Next 15% Next 4% Top 1% Top 20%

36
Investing in a strong state economy

37
No Clear Relationship Between Tax Levels & Wages, 2012

38
Strong Relationship Between Education and Wages, 2012

39
Individual Wages Increase with Level of Education

41
Tools to Learn More Massachusetts Budget and Policy Center: www.massbudget.org MassBudget Online Budget Browser: http://browser.massbudget.org Commonwealth of Massachusetts Budget: www.mass.gov/budget www.mass.gov/budget

42
browser.massbudget.org

43
MassBudget’s Children’sBudget children.massbudget.org

Similar presentations


: 8.3% * Illinois (9.2%), Kentucky (9.6%), Michigan (10.5%) and Ohio (8.8%) National.>")
![AE = [W + Ye – PL – r – mpc ∙ T + I + G + X ] + { mpc – mpm }Y](/1/274386/big_thumb.jpg "AE = [W + Ye – PL – r – mpc ∙ T + I + G + X ] + { mpc – mpm }Y>")


>")


