Download presentation
Presentation is loading. Please wait.

1
Effect Sizes in Education Research: What They Are, What They Mean, and Why They’re Important Howard Bloom (MDRC; Howard.Bloom2@mdrc.org) Carolyn Hill (Georgetown; cjh34@georgetown.edu) Alison Rebeck Black (MDRC; alison.black@mdrc.org) Mark Lipsey (Vanderbilt; mark.lipsey@vanderbilt.edu) Institute of Education Sciences 2006 Research Conference Washington DC

2
Today’s Session Goal: introduce key concepts and issues Goal: introduce key concepts and issues Approach: focus on nexus between analytics and interpretation Approach: focus on nexus between analytics and interpretation Agenda Agenda Core concepts Empirical benchmarks Important applications

3
Part 1: The Nature (and Pitfalls) of the Effect Size Howard Bloom MDRC
 of the Effect Size Howard Bloom MDRC")
4
Starting Point Statistical significance vs. substantive importance Statistical significance vs. substantive importance Effect size measures for continuous outcomes (our focus) Effect size measures for continuous outcomes (our focus) Effect size measures for discrete outcomes Effect size measures for discrete outcomes
 Effect size measures for continuous outcomes (our focus) Effect size measures for discrete outcomes Effect size measures for discrete outcomes.")
5
The standardized mean difference

6
Relativity of statistical effect sizes

7
Variance components framework Decomposing the total national variance

8
Ratio of Student-level to school-level standard deviations Students in a grade per school (n) Intra-class correlation ( ) 0.050.100.20 503.812.912.15 1004.103.032.19 2004.273.092.21 4004.373.132.22
 Intra-class correlation ( )")
9
Unadjusted vs. regression-adjusted standard deviations R2R2R2R2 Ratio of unadjusted to adjusted standard deviations 0.11.05 0.31.20 0.51.41 0.71.83 0.93.16

10
Career Academies and Future Earnings f or Young Men Impact on Impact on Earnings Earnings Dollars per month increase $212 Percentage increase 18 % Effect size 0.30

11
Aspirin and heart attacks Rate of Rate of Heart Attacks Heart Attacks With placebo1.71 % With placebo1.71 % With aspirin 0.94 % With aspirin 0.94 % Difference 0.77 % Difference 0.77 % Effect Size0.06 Effect Size0.06 Measures of Effect Size,” in Harris Cooper and Larry V. Hedges, The Handbook of Research Synthesis (New York: Russell Sage Foundation)
.")
12
Five-year impacts of the Tennessee class-size experiment Treatment: 13-17 versus 22-26 students per class Effect sizes: 0.11 to 0.22 for reading and math Findings were summarized from Nye, Barbara, Larry V. Hedges and Spyros Konstantopoulos (1999) “The Long-Term Effects of Small Classes: A Five- Year Follow-up of the Tennessee Class Size Experiment,” Educational Evaluation and Policy Analysis, Vol. 21, No. 2: 127-142.
 The Long-Term Effects of Small Classes: A Five- Year Follow-up of the Tennessee Class Size Experiment, Educational Evaluation and Policy Analysis, Vol. 21, No. 2:")
13
Part 2: What’s a Big Effect Size, and How to Tell? Carolyn Hill, Georgetown University Alison Rebeck Black, MDRC

14
How Big is the Effect? Need to interpret an effect size when: Designing an intervention study Designing an intervention study Interpreting an intervention study Interpreting an intervention study Synthesizing intervention studies Synthesizing intervention studies To assess practical significance of an effect size: Compare to external criterion/standard Compare to external criterion/standard Related to outcome construct Related to outcome construct Related to context Related to context

15
Prevailing Practice for Interpreting Effect Size: “Rules of Thumb” Cohen (speculative) Small = 0.20 Small = 0.20 Medium = 0.50 Medium = 0.50 Large = 0.80 Large = 0.80 Cohen, Jacob (1988) Statistical Power Analysis for the Behavioral Sciences 2 nd edition (Hillsdale, NJ: Lawrence Erlbaum). Lipsey (empirical) Small = 0.15 Medium = 0.45 Large = 0.90 Lipsey, Mark W. (1990) Design Sensitivity: Statistical Power for Experimental Research (Newbury Park, CA: Sage Publications).
 Small = 0.15 Medium = 0.45 Large = 0.90 Lipsey, Mark W. (1990) Design Sensitivity: Statistical Power for Experimental Research (Newbury Park, CA: Sage Publications)..")
16
Preferred Approaches for Assessing Effect Size (K-12) Compare ES from the study with: Compare ES from the study with: ES distributions from similar studies Student attainment of performance criterion without intervention Normative expectations for change Subgroup performance gaps School performance gaps
 Compare ES from the study with: Compare ES from the study with: ES distributions from similar studies Student attainment of performance criterion without intervention Normative expectations for change Subgroup performance gaps School performance gaps")
17
ES Distribution from Similar Studies -0.060.070.160.250.39 Effect Size (σ) 25 th 5 th 50 th 75 th 95 th Percentile Percentile distribution of 145 achievement effect sizes from meta-analysis of comprehensive school reform studies (Borman et al. 2003):
:.")
18
Attainment of Performance Criterion Based on Effect Size

19
Attainment of Performance Criterion (continued)
")
20
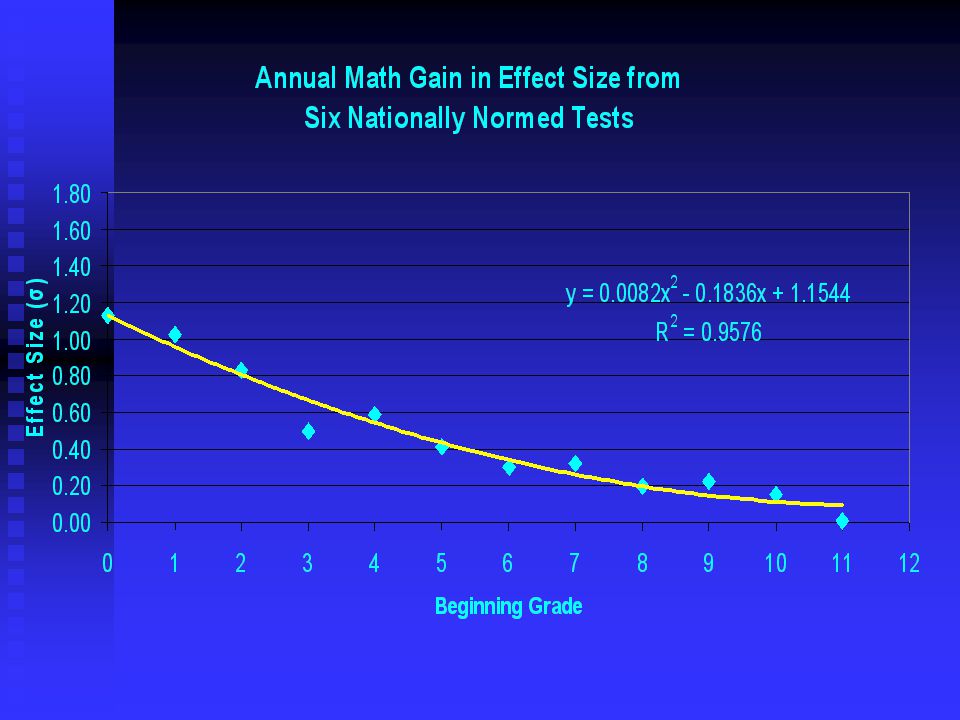
Normative Expectations for Change: Estimating Annual Reading and Math Gains in Effect Size from National Norming Samples for Standardized Tests Seven tests were used for reading and six tests were used for math Seven tests were used for reading and six tests were used for math The mean and standard deviation of scale scores for each grade were obtained from test manuals The mean and standard deviation of scale scores for each grade were obtained from test manuals The standardized mean difference across succeeding grades was computed The standardized mean difference across succeeding grades was computed These results were averaged across tests and weighted according to Hedges (1982) These results were averaged across tests and weighted according to Hedges (1982)
 These results were averaged across tests and weighted according to Hedges (1982)")
21
Annual Reading and Math Growth Reading Math Grade Growth Growth Transition Effect Size Effect Size --------------------------------------------------------------- K - 1 1.59 1.13 K - 1 1.59 1.13 1 - 2 0.94 1.02 1 - 2 0.94 1.02 2 - 3 0.57 0.83 2 - 3 0.57 0.83 3 - 4 0.37 0.50 3 - 4 0.37 0.50 4 - 5 0.40 0.59 4 - 5 0.40 0.59 5 - 6 0.35 0.41 5 - 6 0.35 0.41 6 - 7 0.21 0.30 6 - 7 0.21 0.30 7 - 8 0.25 0.32 7 - 8 0.25 0.32 8 - 9 0.26 0.19 8 - 9 0.26 0.19 9 - 10 0.20 0.22 9 - 10 0.20 0.22 10 - 11 0.21 0.15 10 - 11 0.21 0.15 11 - 12 0.03 0.00 11 - 12 0.03 0.00---------------------------------------------------------------------------------------- Based on work in progress using documentation on the national norming samples for the CAT5, SAT9, Terra Nova CTBS, Gates MacGinitie, MAT8, Terra Nova CAT, and SAT10.

24
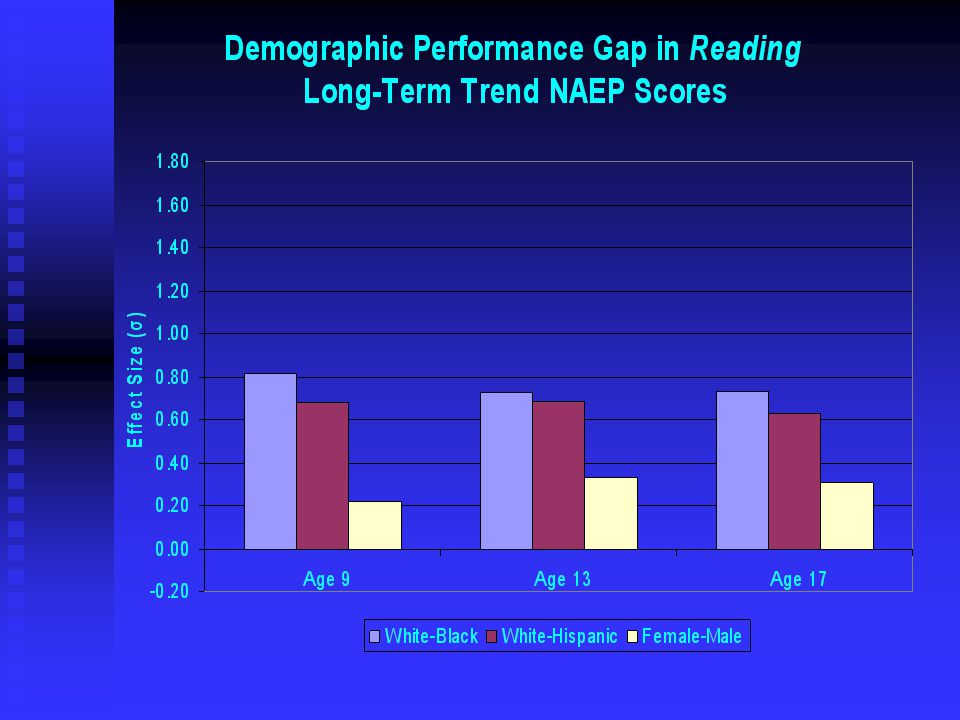
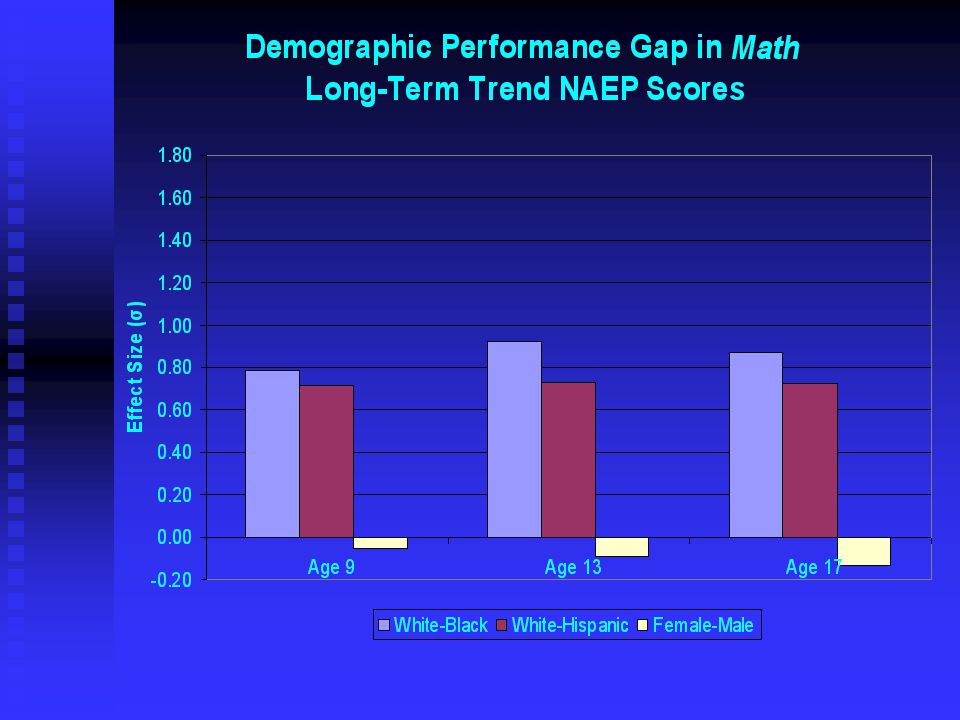
Demographic Performance Gaps from Selected Tests Interventions may aim to close demographic performance gaps Interventions may aim to close demographic performance gaps Effectiveness of interventions can be judged relative to the size of gaps they are designed to close Effectiveness of interventions can be judged relative to the size of gaps they are designed to close Effect size gaps vary across grades, years, tests, and districts Effect size gaps vary across grades, years, tests, and districts

29
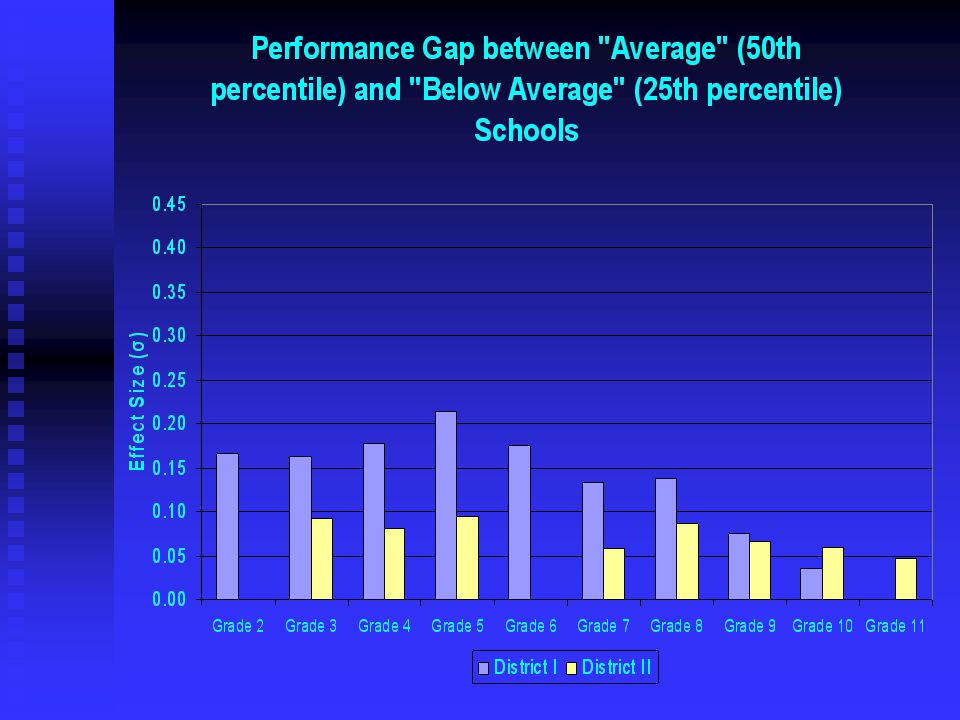
Performance Gaps between “Average” and “Weak” Schools Main idea: Main idea: What is the performance gap (effect size) for the same types of students in different schools? Approach: Approach: Estimate a regression model that controls for student characteristics: race/ethnicity, prior achievement, gender, overage for grade, and free lunch status. Infer performance gap (effect size) between schools at different percentiles of the performance distribution
 between schools at different percentiles of the performance distribution.")
32
Interpreting the Magnitude of Effect Sizes “One size” does not fit all “One size” does not fit all Instead, interpret magnitudes of effects in context Instead, interpret magnitudes of effects in context Of the interventions being studied Of the outcomes being measured Of the samples/subsamples being examined Consider different frames of reference in context, instead of a universal standard: Consider different frames of reference in context, instead of a universal standard: ES distributions, external performance criteria, normative change, subgroup/school gaps, etc.

33
Part 3: Using Effect Sizes in Power Analysis and Research Synthesis Mark W. Lipsey Vanderbilt University

34
Statistical Power The probability that a true intervention effect will be found statistically significant. The probability that a true intervention effect will be found statistically significant.

35
Estimating Statistical Power Prospectively: Finding the MDE Specify: 1. alpha level– conventionally.05 2. sample size (at all levels if multilevel design) 3. correlation between any covariates to be used and dependent variable 4. intracluster correlation coefficients (ICCs) if multilevel design 5. target power level– conventionally set at.80 Estimate: minimum detectable effect size
 3. correlation between any covariates to be used and dependent variable 4. intracluster correlation coefficients (ICCs) if multilevel design 5. target power level– conventionally set at.80 Estimate: minimum detectable effect size.")
36
Assessing the MDE Compare with a target effect size-- the smallest ES judged to have practical significance in the intervention context Compare with a target effect size-- the smallest ES judged to have practical significance in the intervention context Design is underpowered if MDE > target (back to the drawing board) Design is underpowered if MDE > target (back to the drawing board) Design is adequately powered if Design is adequately powered if MDE ≤ target value
 Design is underpowered if MDE > target (back to the drawing board) Design is adequately powered if Design is adequately powered if MDE ≤ target value")
37
Where Do You Get the Target Value for Practical Significance? NOT some broad rule of thumb, e.g, Cohen’s “small,” “medium,” and “large” NOT some broad rule of thumb, e.g, Cohen’s “small,” “medium,” and “large” Use a frame of reference appropriate to the outcome, population, and intervention Use a frame of reference appropriate to the outcome, population, and intervention meaningful success criterion research findings for similar interventions change expected without intervention gaps between relevant comparison groups et cetera

38
Selecting the Target MDE Identify one or more reference frames that may be applicable to the intervention circumstances Identify one or more reference frames that may be applicable to the intervention circumstances Use that frame to guide selection of an MDE; involve other stakeholders Use that frame to guide selection of an MDE; involve other stakeholders Use different reference frames to consider: Use different reference frames to consider: which is most applicable to the context how sensitive the choice is to the frames what the most conservative selection might be

39
Power for Different Target MDEs (2-level design: students in classrooms) ES=.20 ES=.50 ES=.80 Number of Classrooms of N=20.80 ICC=.15
 ES=.20 ES=.50 ES=.80 Number of Classrooms of N=20.80 ICC=.15")
40
Power for Different Target MDEs (same with classroom covariate R 2 =.50) Number of Classrooms of N=20 ICC=.15.80 ES=.20 ES=.50 ES=.80
 Number of Classrooms of N=20 ICC= ES=.20 ES=.50 ES=.80")
41
Interpreting Effect Sizes Found in Individual Studies & Meta-Analysis The practical significance of empirically observed effect sizes should be interpreted using approaches like those described here The practical significance of empirically observed effect sizes should be interpreted using approaches like those described here This is especially important when disseminating research results to practitioners and policymakers This is especially important when disseminating research results to practitioners and policymakers For standardized achievement measures, the practical significance of ES values will vary by student population and grade. For standardized achievement measures, the practical significance of ES values will vary by student population and grade.

42
Example: Computer-Assisted Instruction for Beginning Reading (Grades 1-4) Consider an MDE =.25 Mean ES=.25 found in Blok et al 2002 meta-analysis Mean ES=.25 found in Blok et al 2002 meta-analysis 27-65% increase over “normal” year-to- year growth depending on age 27-65% increase over “normal” year-to- year growth depending on age About 30% of the Grade 4 majority- minority achievement gap About 30% of the Grade 4 majority- minority achievement gap
 Consider an MDE =.25 Mean ES=.25 found in Blok et al 2002 meta-analysis Mean ES=.25 found in Blok et al 2002 meta-analysis 27-65% increase over normal year-to- year growth depending on age 27-65% increase over normal year-to- year growth depending on age About 30% of the Grade 4 majority- minority achievement gap About 30% of the Grade 4 majority- minority achievement gap")
43
References Bloom, Howard S. 2005. “Randomizing Groups to Evaluate Place-Based Programs.” In Howard S. Bloom, editor. Learning More from Social Experiments: Evolving Analytic Approaches. New York: Russell Sage Foundation, pp. 115-172. Bloom, Howard S. 1995. “Minimum Detectable Effects: A Simple Way to Report the Statistical Power of Experimental Designs.” Evaluation Review 19(5): 547-56. Borman, Geoffrey D., Gina M. Hewes, Laura T. Overman, and Shelly Brown. 2003. “Comprehensive School Reform and Achievement: A Meta-Analysis.” Review of Educational Research 73(2): 125-230. Hedges, Larry V. 1982. “Estimation of Effect Size from a Series of Independent Experiments.” Psychological Bulletin 92(2): 490-499. Kane, Thomas J. 2004. “The Impact of After-School Programs: Interpreting the Results of Four Recent Evaluations.” William T. Grant Foundation Working Paper, January 16. http://www.wtgrantfoundation.org/usr_doc/After-school_paper.pdf http://www.wtgrantfoundation.org/usr_doc/After-school_paper.pdf Konstantopoulos, Spyros, and Larry V. Hedges. 2005. “How Large an Effect Can We Expect from School Reforms?” Working paper #05-04, Institute for Policy Research, Northwestern University. http://www.northwestern.edu/ipr/publications/papers/2005/WP-05-04.pdf. http://www.northwestern.edu/ipr/publications/papers/2005/WP-05-04.pdf Lipsey, Mark W. 1990. Design Sensitivity: Statistical Power for Experimental Research. Thousand Oaks, CA: Sage Publications. Schochet, Peter Z. 2005. “Statistical Power for Random Assignment Evaluations of Education Programs.” Project report submitted by Mathematic Policy Research, Inc. to Institute of Education Sciences, U.S. Department of Education. http://www.mathematica-mpr.com/publications/PDFs/statisticalpower.pdf http://www.mathematica-mpr.com/publications/PDFs/statisticalpower.pdf
: Borman, Geoffrey D., Gina M. Hewes, Laura T. Overman, and Shelly Brown Comprehensive School Reform and Achievement: A Meta-Analysis. Review of Educational Research 73(2): Hedges, Larry V Estimation of Effect Size from a Series of Independent Experiments. Psychological Bulletin 92(2): Kane, Thomas J The Impact of After-School Programs: Interpreting the Results of Four Recent Evaluations. William T. Grant Foundation Working Paper, January Konstantopoulos, Spyros, and Larry V. Hedges How Large an Effect Can We Expect from School Reforms Working paper #05-04, Institute for Policy Research, Northwestern University. Lipsey, Mark W Design Sensitivity: Statistical Power for Experimental Research. Thousand Oaks, CA: Sage Publications. Schochet, Peter Z Statistical Power for Random Assignment Evaluations of Education Programs. Project report submitted by Mathematic Policy Research, Inc. to Institute of Education Sciences, U.S. Department of Education.")
44
Contact Information Howard Bloom (Howard.Bloom2@mdrc.org) Carolyn Hill (cjh34@georgetown.edu) Alison Rebeck Black (alison.black@mdrc.org) Mark Lipsey (mark.lipsey@vanderbilt.edu)

Similar presentations


 patients Policy.>")


