Download presentation
Presentation is loading. Please wait.

1
Fe-Stimulated Changes in Phytoplankton Biomarker Distributions and Carbon Isotopic Compositions During SOFeX R. Bidigare, S. Christensen, S. Brown, K. Selph, C. Sheridan, N. Cassar & M. Landry Department of Oceanography University of Hawai‘i

2
Research Objectives Investigate phytoplankton community responses to four sequential iron enrichments (0.7 nM each) at 66°S, 172°W (“Southern Patch”) Monitor pigment biomarker distributions and 13 C ratios in the “Southern Patch” and at outside stations to infer Fe-stimulated changes in algal biomass, composition and growth physiology
 at 66°S, 172°W ( Southern Patch ) Monitor pigment biomarker distributions and 13 C ratios in the Southern Patch and at outside stations to infer Fe-stimulated changes in algal biomass, composition and growth physiology")
3
HPLC TChl a Turner Chl 0 1000 2000 3000 4000 HPLC TChl a (ng L -1 ) 01000200030004000 Turner Chloropigment (ng L -1 ) SOFeX Southern Patch (R/VMelville) We hypothesize that the variable positive bias observed in the Fl Chl measurements result from the accumulation of fluorescent zooplankton grazing products (Steryl Chlorin Esters???) TChl a = Chl a + Chlorophyllide a
 Turner Chloropigment (ng L -1 ) SOFeX Southern Patch (R/VMelville) We hypothesize that the variable positive bias observed in the Fl Chl measurements result from the accumulation of fluorescent zooplankton grazing products (Steryl Chlorin Esters ) TChl a = Chl a + Chlorophyllide a")
4
050010001500200025003000 Total Chlorophyll a (ng L -1 ) -150 -120 -90 -60 -30 0 Depth (m) SOFeX Southern Patch 20.75 d 20.14 d 17.68 d 14.65 d 14.11 d 10.80 d 9.27 d 9.18 d 9.08 d 8.99 d 6.66 d 4.74 d Pre
 Depth (m) SOFeX Southern Patch d d d d d d 9.27 d 9.18 d 9.08 d 8.99 d 6.66 d 4.74 d Pre")
5
0 500 1000 1500 2000 2500 3000 Total Chlorophyll a (ng L -1 ) -23813182328 Time Since Initial Fe Addition (days) SOFeX Southern Patch (0-30 m) In Out Pre
 Time Since Initial Fe Addition (days) SOFeX Southern Patch (0-30 m) In Out Pre")
7
0 300 600 900 1200 1500 Fucoxanthin (ng L -1 ) -23813182328 Time Since Initial Fe Addition (days) SOFeX Southern Patch (0-30 m) In Out Pre
 Time Since Initial Fe Addition (days) SOFeX Southern Patch (0-30 m) In Out Pre")
8
Photoadaptation Index

9
0 10 20 30 40 50 Daily PAR (Ein m -2 ) 456789101112131415161718192021 Time Since Initial Fe Infusion (days) SOFeX Southern Patch
 Time Since Initial Fe Infusion (days) SOFeX Southern Patch")
10
3 4 5 6 7 8 Ln (Biomass) 0510152025 Time Since Initial Fe Addition (days) y = 0.058x + 3.778 r 2 = 0.83 y = 0.095x + 5.608 r 2 = 0.84 SOFeX Southern Patch (0-30 m) C Chl Phytoplankton Net Growth Rate
 Time Since Initial Fe Addition (days) y = 0.058x r 2 = 0.83 y = 0.095x r 2 = 0.84 SOFeX Southern Patch (0-30 m) C Chl Phytoplankton Net Growth Rate")
11
Apparent Phytoplankton Net Growth Rates During SOFeX (Southern Patch)
")
12
-0.4 0 0.4 0.8 1.2 13 C IN - 13 C OUT ( ‰) 471011151821 Time Since Initial Fe Infusion (days) SOFeX Southern Patch Bulk POC (mixed layer)
 Time Since Initial Fe Infusion (days) SOFeX Southern Patch Bulk POC (mixed layer)")
13
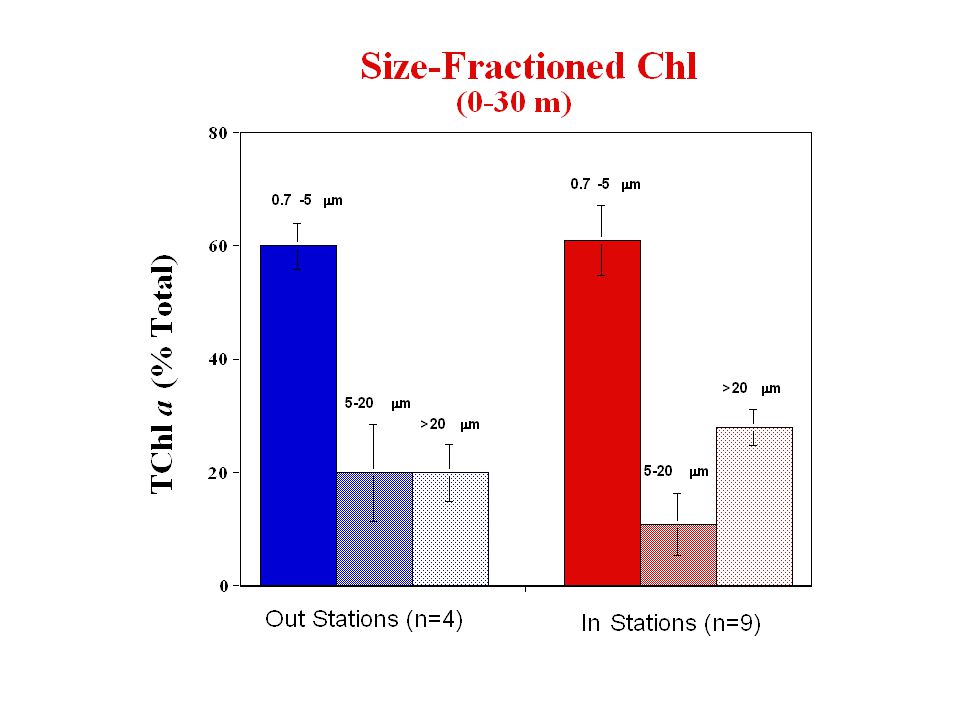
Summary Fe enrichment produced an 10-fold increase in [TChl a] in the SOFeX Southern Patch (0.2 2.0 mg/m 3 ) Only small changes in phytoplankton size structure were observed following Fe enrichment ( >20 m size fx) Variations in xanthophyll cycle pigment ratios indicate that light limitation may have restricted the magnitude of the phytoplankton response to Fe addition A differential response to Fe enrichment was observed for the Southern Patch phytoplankton community with diatoms > pelagophytes > dinoflagellates > haptophytes A ~1‰ enrichment in 13 C was measured in the POC pool in the Southern Patch relative to the outside stations
![Summary Fe enrichment produced an 10-fold increase in [TChl a] in the SOFeX Southern Patch (0.2 2.0 mg/m 3 ) Only small changes in phytoplankton size structure were observed following Fe enrichment ( >20 m size fx) Variations in xanthophyll cycle pigment ratios indicate that light limitation may have restricted the magnitude of the phytoplankton response to Fe addition A differential response to Fe enrichment was observed for the Southern Patch phytoplankton community with diatoms > pelagophytes > dinoflagellates > haptophytes A ~1‰ enrichment in 13 C was measured in the POC pool in the Southern Patch relative to the outside stations](http://images.slideplayer.com/9/2574856/slides/slide_13.jpg "Summary Fe enrichment produced an 10-fold increase in [TChl a] in the SOFeX Southern Patch (0.2 2.0 mg/m 3 ) Only small changes in phytoplankton size structure were observed following Fe enrichment ( >20 m size fx) Variations in xanthophyll cycle pigment ratios indicate that light limitation may have restricted the magnitude of the phytoplankton response to Fe addition A differential response to Fe enrichment was observed for the Southern Patch phytoplankton community with diatoms > pelagophytes > dinoflagellates > haptophytes A ~1‰ enrichment in 13 C was measured in the POC pool in the Southern Patch relative to the outside stations")
14
Future Directions Identify fluorescent grazing products 13 C biomarker analyses –Lipids (irmGC/MS) –Pigments (irmLC/MS) –SOFeX large-volume pump samples –Phytoplankton “soup” samples –AESOPS sediment core samples
 –Pigments (irmLC/MS) –SOFeX large-volume pump samples –Phytoplankton soup samples –AESOPS sediment core samples")
Similar presentations


 between 18 and 27. D) between 27 and 50.>")


?>")


>")


