Download presentation
Presentation is loading. Please wait.

1
12-Lead EKG MEPN Level IV

2
EISLO’s Discuss the changes in T wave and ST segment morphology with an MI List the criteria for identification of right or left bundle branch blocks. List the anatomically congruent leads associated with an inferior, lateral and anterior wall MI Describe morphology of Q wave presence

3
Myocardial A&P

4
Heart wall - Three layers
Epicardium (outer) visceral layer of pericardium thin, transparent smooth, slippery Myocardium (middle) mass of cardiac muscle Endocardium (inner) endothelium over thin connective tissue smooth lining for the chambers and valves continuous with blood vessel endothelium
 visceral layer of pericardium. thin, transparent. smooth, slippery. Myocardium (middle) mass of cardiac muscle. Endocardium (inner) endothelium over thin connective tissue. smooth lining for the chambers and valves. continuous with blood vessel endothelium.")
6
Cardiac Enzymes Myoglobin CK Troponin Released by all striated muscle
Rises fast (2 hours) after myocardial infarction Peaks at hours Returns to normal in hours CK Released by all muscles in the body Rises in 4-6 hours after injury Peaks in 24 hours Returns to normal in 3-4 days CK-MB is myocardial “specific” Peaks in 3-4 hours Returns to normal in 2 days Troponin More specific for myocardial injury Rises 2-6 hours after injury Peaks in 12 hours Remains elevated for 5-14 days
 after myocardial infarction. Peaks at hours. Returns to normal in hours. CK. Released by all muscles in the body. Rises in 4-6 hours after injury. Peaks in 24 hours. Returns to normal in 3-4 days. CK-MB is myocardial specific Peaks in 3-4 hours. Returns to normal in 2 days. Troponin. More specific for myocardial injury. Rises 2-6 hours after injury. Peaks in 12 hours. Remains elevated for 5-14 days.")
7
Coronary Blood Flow Arteries first branches off the aorta
blood moves more easily into the myocardium when it is relaxed between beats during diastole blood enters coronary capillary beds

8
Collateral Circulation

10
Coronary Circulation

11
Coronary Circulation Pathologies
Compromised coronary circulation due to: emboli: blood clots, air, amniotic fluid, tumor fragments fatty atherosclerotic plaques smooth muscle spasms in coronary arteries Problems ischemia (low supply of nutrients) hypoxia (low supply of O2) infarct (cell death)
 hypoxia (low supply of O2) infarct (cell death)")
12
Internodal tracts Bundle of His Right Bundle Branch
Cell specialization – pacemaker cells, transmission cells Sino-Atrial (SA) Node: natural cardiac pacemaker. The heartbeat starts here and spreads throughout the network of conduction fibers in the two atria causing them to contract. Normally, the heartbeat can only reach the ventricles (the two lower chambers), after it has passed through the atrioventricular (AV) node. Atrioventricular (AV) Node: slows down the electrical signal so that the atrial contractions can finish filling the ventricles completely. The AV node also prevents the lower chambers from beating too fast if the atria develops a fast rhythm (tachyarrhythmia). Function Impulse creation Impulse transmission Organized and coordinated Characteristics Interwoven throughout myocardium Innervation by direct cell to cell contact Right Bundle Branch
 Node: natural cardiac pacemaker. The heartbeat starts here and spreads throughout the network of conduction fibers in the two atria causing them to contract. Normally, the heartbeat can only reach the ventricles (the two lower chambers), after it has passed through the atrioventricular (AV) node. Atrioventricular (AV) Node: slows down the electrical signal so that the atrial contractions can finish filling the ventricles completely. The AV node also prevents the lower chambers from beating too fast if the atria develops a fast rhythm (tachyarrhythmia). Function. Impulse creation. Impulse transmission. Organized and coordinated. Characteristics. Interwoven throughout myocardium. Innervation by direct cell to cell contact. Right Bundle. Branch.")
13
SA Node Cardiac muscle cells are involuntary, striated, branched
Each fiber is connected to the others by intercalated discs

14
Intranodal Pathways Anterior, middle and posterior pathways. Bachman’s bundle in the right transmits through the inter-atrial septal region

15
AV Node Conduction Normal conduction pathway from atria to ventricles
Limits number of atrial impulses sent to the ventricles In the Wall of the right atrium next to the opening of the coronary sinus and the septal leaflet of the tricuspid valve

16
Bundle Branches HIS bundle – only route
LAF – anterior and superior aspects; single strand LPF – fan-like, posterior and inferior aspects; more difficult to block His Bundle, bundle branches, and the Purkinje system : The electrical signal finally passes to the ventricles causing the ventricles to contract

17
Action Potential Phase 0 Phase 2 Phase 3 Phase 1 Phase 4 Plateau phase
Begins at -70 mV with a slow influx of sodium ions; gradually raising the potential toward threshold When threshold is reached fast sodium channels open; causing the cell to fire Phase 1 Rapid sodium pumps are slowed by influx of potassium Phase 2 Plateau phase Sodium influx slows; calcium begins to enter the cell Calcium stimulates cellular contraction by stimulating the myocyte Phase 3 Reverse pumps open; rapid repolarization Phase 4 Back to the -70 mV resting potential Ion movement affects what happens electrically in the heart Medications are given to effect ion movement Lidocaine – Na+ Calcium channel blockers K+

18
Myocardial Action Potential
Depolarization Phase 1 of the action potential Stimulation of the cardiac cell by the pacemaker cell causing an influx of Na and Ca, outflow of K. Repolarization Phase 2 of the action potential No impulse entering the cells can cause it to depolarize Relative refractory period Phase 3 of the action potential Impulses entering the cardiac cell now can cause serious, uncontrolled reactions. Absolute refractory period Phase 4 of the action potential The return of the cardiac cells to resting state. One cardiac contraction, A single ventricular contraction

19
EKG Basics 25 mm per sec Each small box - horizontally = 0.4 sec
Each small box - vertically = 1 mm Horizontal marks time Vertical marks amplitude

20
EKG Review - Analysis Rhythm Rate P waves P-R Interval QRS complex
Regular or irregular Rate Too fast, too slow, just right P waves Upright, inverted, not there, not related P-R Interval ; >0.20; <0.12 QRS complex <0.12 QT Interval P Wave P wave should be upright in Leads I and II as well as V3-V6 P wave always inverted in aVR P wave usually upright in aVF and V3 but occasionally biphasic or flat P wave is variable in leads III, aVL, V1 and V2 (upright, inverted, biphasic) Most people say that your best view of the P wave is in Lead II – others say V1. The truth is that every patient is different, find the best one on your patients EKG and study that one well.
 Most people say that your best view of the P wave is in Lead II – others say V1. The truth is that every patient is different, find the best one on your patients EKG and study that one well.")
21
Normal .04 to .12 seconds in width
P wave: Represents positive and negative deflections of atrial contraction and relaxation PR Interval: Distance between the P wave and the Q/R wave QRS Complex: represents ventricular depolarization Q wave: First negative deflection R Wave: First positive deflection S Wave: second negative deflection ST Segment: Essentially isoelectric, slopes gently upward Normal > .08 sec J point: the point where the S wave meets the isoelectric line T Wave: Ventricular repolarization always upright in leads I, II, V2-V6 aVR is always negative. Leads III, aVL, aVF, and V1 can be positive or negative U Wave: unclear etiology, commonly seen in V2-V3 due to proximity to ventricular mass; common in bradycardia, hypokalemia, digitalis PR interval <.12 is indicative of preexcitement – re-entry problem or atrial dysfunction Normal .04 to .12 seconds in width Factors altering Amplitude Men have larger amplitudes than women Young people have higher amplitude than elderly Precordial amplitudes are higher than limb leads Causes of QRS widening Ventricular Rhythms BBB

22
QT interval QTc QT corrected for heart rate QT / R-R = QTc
beginning of the QRS complex to the end of the T wave represents ventricular depolarization and repolarization ---- Changes with heart rate QTc QT corrected for heart rate QT / R-R = QTc Evaluates the recovery of the ventricle Manual verification should be used when computer generation is long Range is Normal: 0.39 men; 0.41 women Age and gender dependent, 10 articles will you give you 10 different normal ranges Can be affected by: Drugs Cardiomyopathy Hypothermia Congenital QT lengthening is not well defined but is thought to be the cause of sudden death in young adults (athletes) as the HR increases the next R can land on the T Prolonged QTc associated with Torsades Bazettes formula used to calculate QTc, four formulas that can be used
 as the HR increases the next R can land on the T. Prolonged QTc associated with Torsades. Bazettes formula used to calculate QTc, four formulas that can be used.")
23
ECG Leads 6 limb leads (frontal plane) 3 bipolar leads
3 unipolar leads 6 precordial leads (horizontal plane) V1 – V6
 V1 – V6.")
24
Einthoven’s Triangle Limb Leads BIPOLAR Lead I RA (-) to LA (+)
Lead II RA (-) to LL (+) Lead III LA (-) to LL (+)
 to LL (+) Lead III. LA (-) to LL (+)")
25
AUGMENTED (UNIPOLAR) LEADS
Augmented leads combine 2 leads together (the null point) from the center point of the triangle with one positive pole. aVR (Augmented Voltage Right Arm positive) is a combination of bipolar Leads I and II aVL (Augmented Voltage Left Arm Positive) is a combination of I and III aVF (Augmented Voltage Left Foot positive) is a combination of Bipolar Leads II and III
 from the center point of the triangle with one positive pole. aVR (Augmented Voltage Right Arm positive) is a combination of bipolar Leads I and II. aVL (Augmented Voltage Left Arm Positive) is a combination of I and III. aVF (Augmented Voltage Left Foot positive) is a combination of Bipolar Leads II and III.")
26
II, III & AVF WHAT ARE THE LEADS LOOKING AT? I & AVL LIMB and AUGMENTED LEADS

27
Precordial Lead Placement
V1 – 4th intercostal space right of sternum V2 - 4th intercostal space left of sternum V4 – 5th intercostal space midclavicular line V3 – midway between V2 and V4 V6 – 5th intercostal space midaxillary line V5 – same level as V4 at anterior axillary line between V4 and V6

28
Same lead position as left side –
RIGHT SIDED EKG Same lead position as left side – looks directly at the Right ventricle

29
Posterior View Posterior leads:
V7 – lateral to V6 at posterior axillary line V8 – level of V7 at the mid-scapular line V9 – level of V8 at the paravertebral line (left posterior thorax midway from spine to V8) Posterior View
 Posterior View.")
31
PRECORDIAL LEADS V1 & V2 V3 & V4 V5 & V6

32
Bottom line is continuous strip
calibration marker LIMB LEADS AUGUMENTED LEADS PRECORDIAL LEADS Bottom line is continuous strip

33
R – Wave Progression

34
R – Wave Progression

35
Myocardial infarction
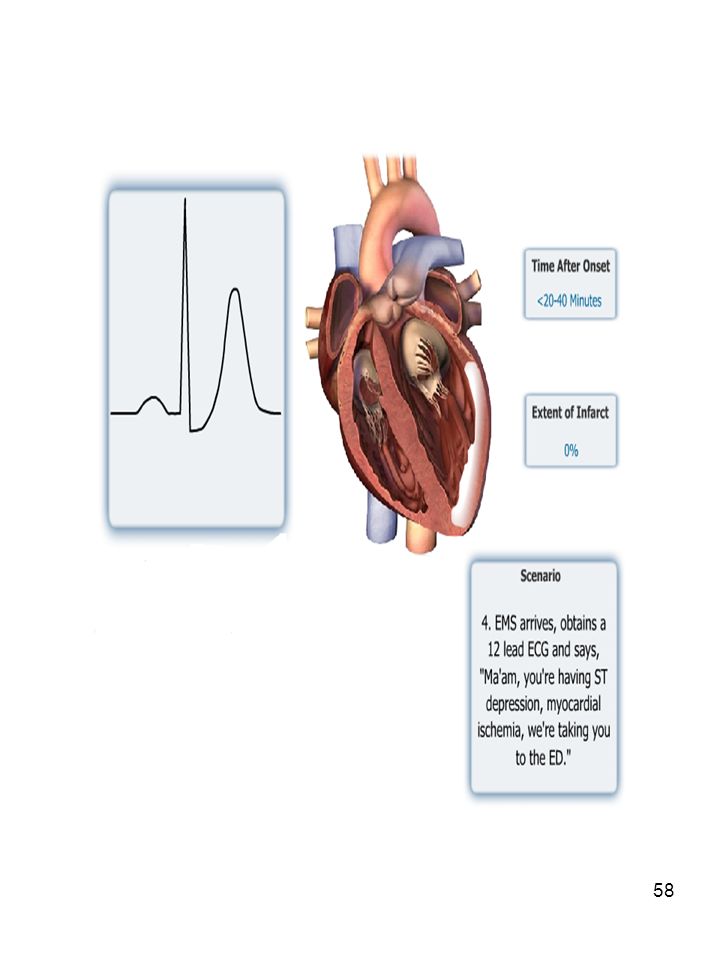
Myocardial ischemia Various definitions are used. The term commonly refers to diffuse ST segment depression, usually with associated T wave inversion Myocardial injury Injury always points outward from the surface that is injured with ST segment elevation Myocardial infarction death of heart muscle

36
Ischemia, Injury, Infarction Waveforms

37
ST segment should be electrically neutral

38
Visual aid in determining:
Ischemia or injury to myocardium Normal should be at baseline Depressed ST segment - >2 mm below baseline

40
EKG 1

41
ST Segment Elevation ST segment elevation is attributed to impending infarction but can also be due to pericarditis or vasospastic (variant) angina. The height of the ST segment is measured at a point 2 boxes after the end of the QRS complex significant if it exceeds 1 mm in a limb lead or 2 mm in a precordial lead.
 angina. The height of the ST segment is measured at a point 2 boxes after the end of the QRS complex. significant if it exceeds 1 mm in a limb lead or 2 mm in a precordial lead.")
42
EKG 2

43
T Waves T waves are normally positive in leads with a positive QRS
T waves are normally asymmetrical T waves are normally not more than 5 mm high in limb leads or 10 mm high in precordial leads or 2/3 the height of the R wave

44
T wave Ischemia Hyperkalemia Ischemia Ischemia

45
Hyperkalemia EKG 3

46
ST-T Wave Combination of infarction and often hyperkalemia
Called Tombstone ‘T’ because of the shape. Usually a sign of impending cardiac death.

47
Inferior-Anterior-Lateral
EKG 4

48
Pathology of an MI

49
Localization of ECG Pathology
Inferior: Abnormalities that appear in leads II, III, and aVF (called the inferior leads) indicate pathology on the inferior or diaphragmatic surface of the heart. Lateral: Leads I, aVF, and V5-V6 are called lateral leads. Abnormality in these leads indicates pathology on the lateral, upper surface of the heart. Anterior: Anterior pathology is seen in leads V1-V4, and often in lead I.
 indicate pathology on the inferior or diaphragmatic surface of the heart. Lateral: Leads I, aVF, and V5-V6 are called lateral leads. Abnormality in these leads indicates pathology on the lateral, upper surface of the heart. Anterior: Anterior pathology is seen in leads V1-V4, and often in lead I.")
50
Possible loss of R wave in
Overview of Infarcts Location of Infarct Arterial Supply Indicative Changes Reciprocal Changes Anterior LAD V1-V4 II, III, aVF Inferior RCA I, aVL Lateral Circumflex V5, V6 V1 Posterior Posterior Descending (RCA) V7, V8, V9 - elevation V1, V2 -ischemia Septal Septal Perforating (LAD) Posterior Descending (RCA Possible loss of R wave in V1, V2, V3 None
 V7, V8, V9 - elevation. V1, V2 -ischemia. Septal. Septal Perforating (LAD) Posterior Descending (RCA. Possible loss of R wave in. V1, V2, V3. None.")
51
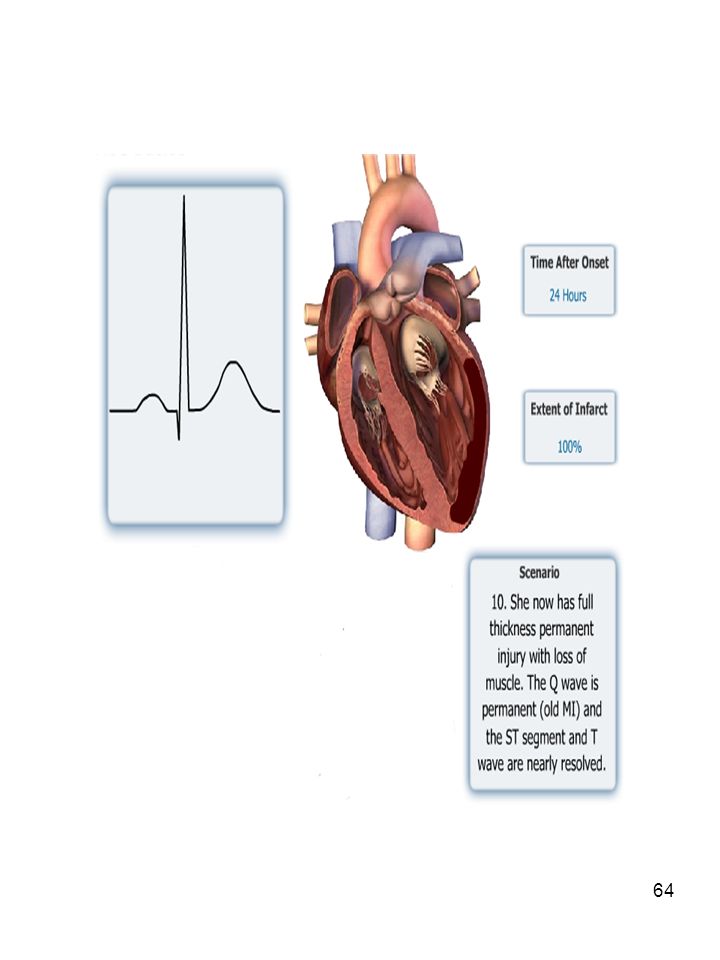
T Wave Elevation T ST Segment Elevation ST ST Q T Pathological Q Wave Q Q T T Wave Inversion

52
EKG Changes from Infarction
First Detectable Change in EKG Tall T-waves increase in height more symmetric may occur in the first few minutes Hyper-acute Phase

53
Acute Phase ST Segment Elevation Primary indication of injury
Occurs in first hour to hours ST Segment Elevation in Leads 1mm or greater in limb leads 2 mm or greater in chest leads Hallmark indication of AMI

55
CASE STUDY – EVOLUTION of MI

65
View of Inferior Heart Wall
Leads II, III, aVF Looks at inferior heart wall

66
Inferior EKG 5

67
Inferior EKG 6

68
*Sometimes referred to as High Lateral or High Apical view*
View of Lateral Heart Wall Leads I and aVL Looks at lateral heart wall Looks from the left arm toward heart *Sometimes referred to as High Lateral or High Apical view*

69
View of Lateral Heart Wall
Leads V5 & V6 Looks at lateral heart wall Looks from the left lateral chest toward heart *Sometimes referred to as Low Lateral or Low Apical view*

70
View of Entire Lateral Heart Wall
Leads I, aVL, V5, V6 - Looks at the lateral wall of the heart from two different perspectives Lateral Wall

71
Lateral EKG 7

72
Lateral EKG 8

73
View of Anterior Heart Wall
Leads V3, V4 Looks at anterior heart wall Looks from the left anterior chest

74
Anterior EKG 9

75
EKG 10

76
View of Septal Heart Wall
Leads V1, V2 Looks at septal heart wall Looks along sternal borders

77
Putting it ALL together
ANTERIOR LATERAL S E P T A L LATERAL LATERAL INFERIOR

78
Q Waves Definition Septal depolarization
Normally present in I, aVL, V6

79
Two types of Q waves Non-pathologic Pathologic Narrow, shallow Q waves
Not visible in all leads Pathologic > 0.04 in duration; at least 1/4 to 1/3 height of R wave Represent an infarcted area of myocardium

80
PATHOLOGICAL Q WAVES

81
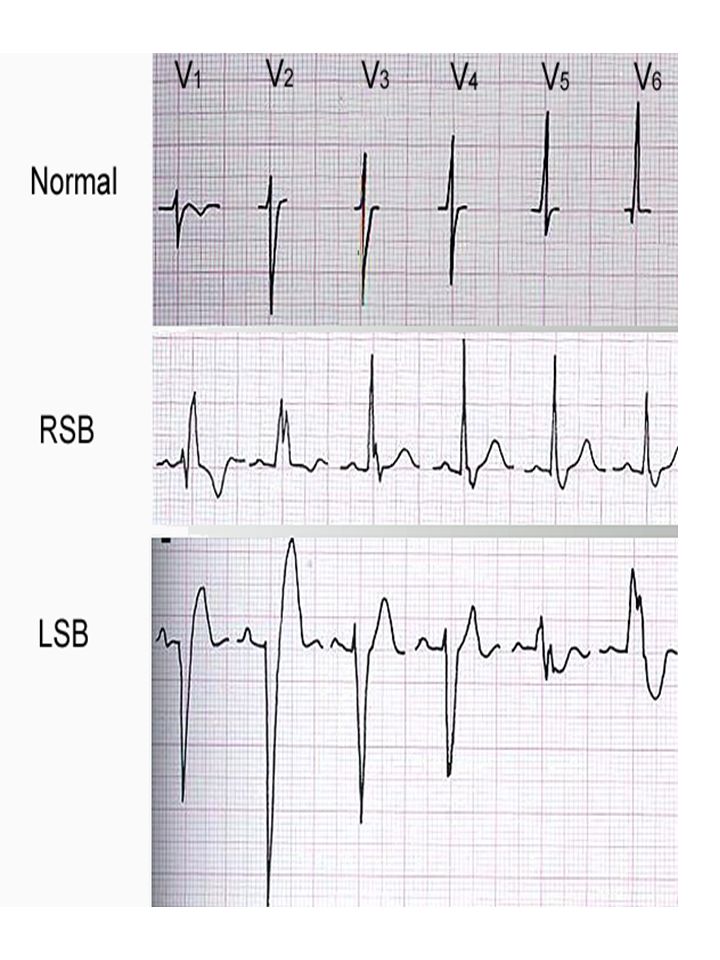
Bundle Branch Blocks If the QRS duration is > .12 there is usually an abnormality of conduction of the ventricular impulse

82
RBB Block Most common ventricular conduction defect Can be acute or chronic Acute RBBB is associated with an acute anterior MI

83
EKG 11 RBBB

84
LBB Block Always indicates a diseased heart More common in older adults

85
EKG 12 LBBB

Similar presentations


 Grants Chapter 6.>")


 Motion Controller Design for A Class of Second-order Systems Center for Self-Organizing Intelligent.>")
>")


