Download presentation
Presentation is loading. Please wait.

1
Limpopo Basin Impact Pathways Workshop 15 – 17 November 2007 Birchwood Hotel, Johannesburg Boru Douthwaite, CPWF Impact Project CIAT, Cali, Colombia

2
Impact Pathways Matter

3
Why make Impact Pathways explicit? People plan and implement projects (programs, countries …) on the basis of their change models - their implicit theories about how the world works, i.e., impact pathways If you can improve the impact pathways (IPs) you can improve the practice, making impact more likely IPs show a project’s rationale and networks –Help communicate what the project is doing More fundable –Help with planning, including MTPs –Provide a basis for evaluation Starting point for evaluation is a good model of what you think will happen Provide information to support programmatic integration Provides impact hypotheses for ex-post impact assessment
 on the basis of their change models - their implicit theories about how the world works, i.e., impact pathways If you can improve the impact pathways (IPs) you can improve the practice, making impact more likely IPs show a project’s rationale and networks –Help communicate what the project is doing More fundable –Help with planning, including MTPs –Provide a basis for evaluation Starting point for evaluation is a good model of what you think will happen Provide information to support programmatic integration Provides impact hypotheses for ex-post impact assessment.")
4
PIPA makes Impact Pathways explicit It does so by developing two perspectives …. 1.A problem tree that shows a linear logic linking project outputs to project goal; and 2.Network maps that show the evolving relationships necessary to achieve the goal

5
Impact pathways – a more complete picture…. Problem Tree Network maps

6
Foundations Adaptation of concepts from Program Evaluation –Renger and Titcomb (2002) – problem trees –Chen (2005) – program theory –Mayne (2004) - performance stories Innovation histories –Douthwaite and Ashby, 2005 Social network analysis –Cross and Parker, 2004
 – problem trees –Chen (2005) – program theory –Mayne (2004) - performance stories Innovation histories –Douthwaite and Ashby, 2005 Social network analysis –Cross and Parker, 2004")
7
Workshop Road Map

8
Outputs produced after the workshop

9
Use of PIPA Outputs Use of PIPA outputsPIPA outputs used Ex-ante impact assessment Essential: Impact logic model, output targets, impact narrative Optional: Extrapolation domain analysis, scenario analysis Impact Pathways AnalysisEssential: Outcomes logic model, output targets and milestones, vision Optional: Impact logic model Laying the foundation for ex-post impact assessment Essential: Outcomes and impact logic models Optional: Impact pathways analysis (that updates project impact hypotheses) Extrapolation domain analysis
 Extrapolation domain analysis")
10
Expectations

11
Causal analysis / Problem tree

12
Refining and presenting your problem tree Adapt or develop anew your project problem tree for presentation (PowerPoint or cards) If cards, writing one problem per card –Use one color for problems the project will address –Use another for other problems Modify, and add as you see fit –But don’t go into too much detail We’ll present the problem trees together with project visions in plenary Exercise 1
 If cards, writing one problem per card –Use one color for problems the project will address –Use another for other problems Modify, and add as you see fit –But don’t go into too much detail We’ll present the problem trees together with project visions in plenary Exercise 1")
13
Example of a Problem Tree developed during an IP workshop

14
PN 34 Improved Fisheries Management Problem and Outcome Trees Main problem to Goal Determinants to Products Problems to Outcomes

15
Deriving Products/ Outputs from the Problem Tree The determinants are the problems the project is directly addressing with its outputs Hint: the use of the output solves the determinant Identify, write on cards and add to the problem tree the outputs, showing which determinants they correspond to Exercise 2

16
Example from Ground Water Governance (PN42)
")
17
Some definitions Activity – what we’re doing inside the project Hold IP Workshop Outputs – what we produce that other people make use of, that solve the determinant Improved rice variety; priority setting publication Determinant – determinants are the problems the project is directly addressing with its outputs Next users – people and organizations who directly use the outputs End users – the people and organizations that the next users work with. Often the end users are the ultimate beneficiaries (e.g., resource-poor farmers), but not always. Politically-important actors– people and organizations whose support is needed for project success Outcomes – usually the results of the use of outputs by others (often come in chains) Promotion of rice variety by extension system Adoption of rice variety by farmers Higher rice yields Higher income More children sent to school
, but not always. Politically-important actors– people and organizations whose support is needed for project success Outcomes – usually the results of the use of outputs by others (often come in chains) Promotion of rice variety by extension system Adoption of rice variety by farmers Higher rice yields Higher income More children sent to school.")
18
Level of influence of a project - change 3 years 10 - 30 years

19
Scaling Out and Scaling Up Scaling up - an institutional expansion, from adopters and their grassroots organizations to policy makers, donors, development institutions Scaling out - spread of a project outputs (i.e., a new technology, a new strategy, etc.) from farmer to farmer, community to community, within the same stakeholder groups
 from farmer to farmer, community to community, within the same stakeholder groups")
20
Develop a vision of project success 2 years after the end of the project Take 5 minutes to individually answer the question, then develop common project vision by filling out Worksheet 1 –You wake up 2 years after your project has finished. Your project has been a success and is well on its way to achieving its goal. Describe what this success looks like to a journalist: What was the situation like before the project started (hint – look at the problem tree) –What were the unmet needs and requirements of next users and end users? What are the next users now doing differently? How are project outputs disseminating (scaling out)? What political support is nurturing this spread (scaling up)? What are the end users doing differently? What are the benefits they are enjoying as a result of the project? Keep it realistic Exercise 3
 –What were the unmet needs and requirements of next users and end users. What are the next users now doing differently. How are project outputs disseminating (scaling out). What political support is nurturing this spread (scaling up). What are the end users doing differently. What are the benefits they are enjoying as a result of the project. Keep it realistic Exercise 3.")
21
Impact pathways – a more complete picture…. Causal Analysis Network maps

22
Workshop Road Map

23
What is a network? Many kinds of entities can be part of a network: people, projects, organisations, documents, events, cities, countries, etc. Each of these entities can have different levels of influence in the network, and And there are many kinds of relationships that can link such entities, involving transmission or exchange of information, money, goods, affection, influence, infection, etc. A network is a collection of people and / or things that are connected to each other by some kind of relationship

24
Advantages of network models Actor-oriented descriptions: observable, understandable, verifiable Captures real-life complexity: We are subject to multiple influences We influence many others Network models help us understand innovation processes: Innovation processes happen through different actors, acting in networks These interactions, relationships and influence are modeled in network maps

26
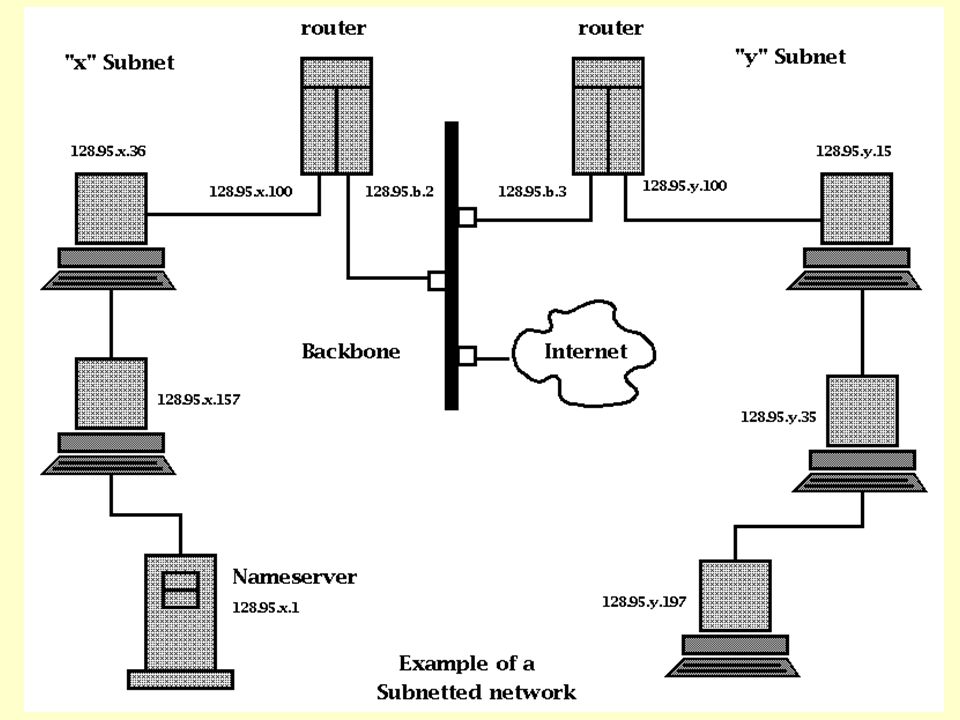
Airline network

27
Road Network

29
How change happens Orlikowski and Hofman, 1997 Improvements in poverty alleviation, food security and the state of natural resources result from dynamic, interactive, non-linear, and generally uncertain processes of innovation.” EIARD, 2003

30
A network diagram (organisations linked by a project) Influence pathway: actor + relationship + actor + relationship…
 Influence pathway: actor + relationship + actor + relationship…")
31
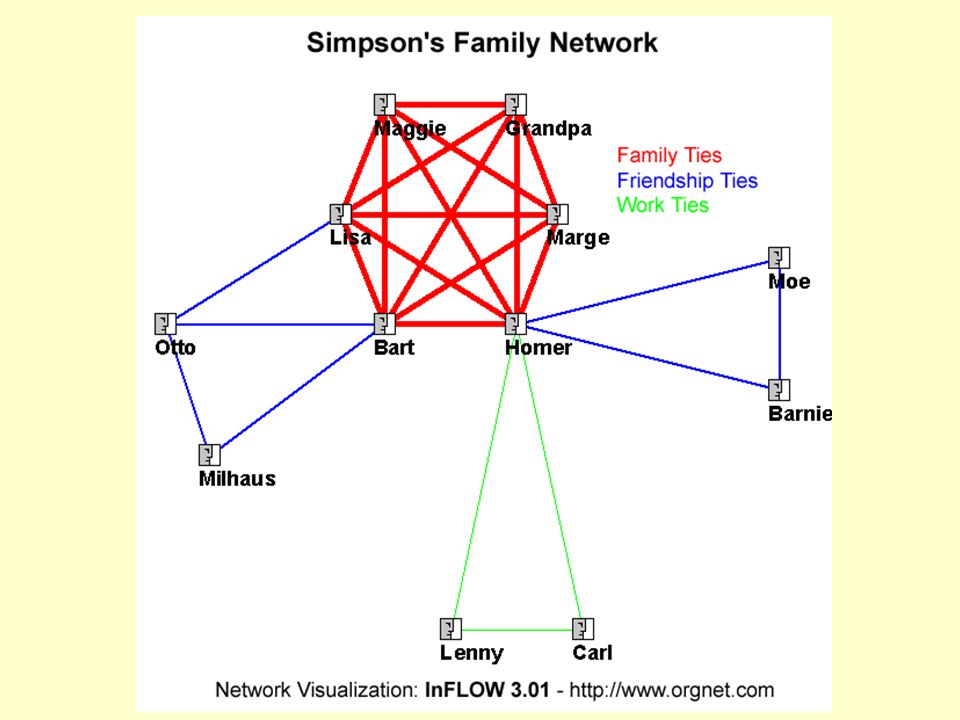
A plotted network diagram, multiple relations The human eye is an analytic tool of remarkable power, and eyeballing pictures of networks is an excellent way to gain an understanding of their structure. (The structure and function of complex networks, M. E. J. Newman)
.")
32
A plotted network diagram, one type of relation

33
Network tasks….. 1.Identify relevant actors 2.Develop network diagrams of key relationships (research, funding, scaling out and scaling up) for Your project now Residual network 2 years after project has finished 3.Identify key levels of influence 4.Develop a scaling influence strategy (Worksheet 2)
 for Your project now Residual network 2 years after project has finished 3.Identify key levels of influence 4.Develop a scaling influence strategy (Worksheet 2).")
34
Identify key actors Who are the actors involved in research, funding, scaling out and scaling up in the area your project is working in? Can be positions (eg. DDG-R) or organizations Remember actors at different scales: community/local, your own organization, regional, national, international
 or organizations Remember actors at different scales: community/local, your own organization, regional, national, international.")
35
Some types of actors Government Organization National Agricultural Research and Extension Organization (NAREO) CGIAR Centre University Ultimate Beneficiary NGO Research Organization Private Sector Donor Other (please specify)
 CGIAR Centre University Ultimate Beneficiary NGO Research Organization Private Sector Donor Other (please specify)")
36
Fill out an actor table (Table 1) ACRONYM FULL NAMELOCATIONTYPE OF ORGANIZATION ROLE IRRIInt. Rice Research Institute Los Baños, Philippines CG CentreProject implementer MOFAMinistry of Fisheries and Agric. Accra, Ghana GOPolitically- important actor FGsFarmers GroupsNorthern Ghana Ult. beneficiaryEnd user PhilRicePhilippine Rice Research Institute Muños, Philippines NAREONext user DfIDDept. for Int. Development London, England Govnt. OrgFunding agency DDG-RDeputy Director General of Research CIAT, CaliCG CentreScaling-out actor Exercise 4a

37
Develop a network diagram for your project now Actors: Use cards for nodes Use different colour cards for different types of node yellow = project implementers, blue = next user, green = end user, red = politically-important actor, red with black dot = donor Relationships Use arrows to describe direction Use colour to describe relationship type Green = funding; brown = research / work; red = scaling out; black = scaling up Don’t use distance/length Exercise 4b

39
Identify influence levels and attitudes in the networks Actors: Construct influence towers (0-3 chips) for key actors Indicate their attitude towards your project: positive neutral negative Exercise 4c
 for key actors Indicate their attitude towards your project: positive neutral negative Exercise 4c")
41
Draw a second network showing how actors need to be linked to achieve the vision Adjust the influence and attitude Will the attitude of the actor remain the same or change? Will the same actors still be equally influential? Will there be new influential actors in the area? Develop a future network corresponding to the vision Exercise 5

42
Developing a Scaling Strategy (Table 2) Describe the most important differences between the two networks Why is the change important to achieve the vision? What are the project’s strategies for achieving the change? Exercise 6a

43
Network Changes Achieved since the beginning of the project (Table 2) Exercise 6b Describe the most important network and influence changes since the beginning of the project Why was the change important? What were the project’s strategies (e.g., co- development of knowledge and technology, communication, political lobbying, etc.) for achieving these changes?
 for achieving these changes .")
44
Workshop Road Map

45
Developing the Outcomes Logic Model (a description of the project’s impact pathways) Why (Dart, 2005)? –To evaluate or clarify the logic of the project intervention –To provide a framework to evaluate the performance of a project Before, during and after Evaluation can provide information to improve decision making and enhance learning

46
Outcomes Logic Model (fill one table for all stakeholder groups) Actor (or group of actors who are expected to change in the same way) Change in Practice required to achieve the Project’s Vision Change in KAS required to support this change Project strategies to bring about these changes in KAS and Practice? Exercise 7 KAS = Knowledge, Attitudes and Skills

47
Identify Outcome Targets (prioritize changes from Outcomes Logic Model) Exercise 8 The key outcomes the project wishes to monitor AssumptionsSMART outcome target Means of verification? By whom? How? SMART = Specific, Measurable, Attributable, Realistic, Timebound

48
Identifying Milestones SMART Outcome Target SMART Milestone to be achieved in the next six months Means of Verification? By whom? In what form? Who is responsible for making the progress described? Exercise 9

49
Where we are now

50
Impact Pathways Evaluation

51
The process

52
Workshop Road Map

53
Use of PIPA Outputs Use of PIPA outputsPIPA outputs used Ex-ante impact assessment Essential: Impact logic model, output targets, impact narrative Optional: Extrapolation domain analysis, scenario analysis Impact Pathways AnalysisEssential: Outcomes logic model, outcome targets and milestones, vision Optional: Impact logic model Laying the foundation for ex-post impact assessment Essential: Outcomes logic model and impact logic model Optional: Impact pathways analysis (that updates project impact hypotheses) Extrapolation domain analysis Program network mapsEssential: ‘Now’ and ‘future’ network maps
 Extrapolation domain analysis Program network mapsEssential: ‘Now’ and ‘future’ network maps")
54
Impact Logic Model for the Strategic Innovations in Dryland Farming (SIDF) Project
 Project")
55
Says little about who does what …….an actor-orientated perspective is missing

56
……provided by network mapping

57
….. as part of an impact narrative

58
Scope of impact Uncertainty of impact Local, close-to- project Basin- scale, global Secured Anticipated Participatory Impact Pathways Analysis Extrapolation domain analysis Scenario analysis Methodologies used for evaluating impact potential Exploring possibilities

59
Link between regions through bio- physical similarities

60
But socio- economic condition also critical

61
EDA method Looking for pixels with similar climate (and soil) Looking for pixels with similar socio- economic (land use factors) Project origin
 Looking for pixels with similar socio- economic (land use factors) Project origin")
62
Extrapolation domain of aerobic rice in Asia

63
Areas that hold promise for adoption of aerobic rice

64
EDA: Summary Method in development Represents what what is believed, on basis of –Current experience –Available global data Beware false prophets, BUT… …a rapid first step in exploratory dialogue with new stakeholders

65
Info needed for Extrapolation Domain Analysis What is the main change that your project is contributing to that is likely to scale-out and scale-up? Who will adopt? What are the factors likely to influence scaling-out and scaling-up? Where are your pilot sites in which the change is starting to happen? Exercise 10

66
Volta – Research network

67
Next Steps Participants finish worksheets and send to BFP-Impact Project (end of Nov) IP writes workshop report (end of Nov) IP send draft impact narratives to projects (end of Jan) Participants respond to queries (end of Feb) IP write first draft of Limpopo Basin Impact Pathways Working Paper (end of March)
 IP writes workshop report (end of Nov) IP send draft impact narratives to projects (end of Jan) Participants respond to queries (end of Feb) IP write first draft of Limpopo Basin Impact Pathways Working Paper (end of March)")
Similar presentations


 problem to: funding agencies,>")


