Download presentation
Presentation is loading. Please wait.

1
Waller Creek Intake CFD Modeling and Simulation ALDEN Research Laboratory Inc. 30 Shrewsbury St., Holden, MA 01520 Preliminary Results September 18, 2009 Flood Control Turning Vane Design

2
CFD model geometry with proposed flood control turning vane Flood control turning vane Isometric view 1Isometric view 2

3
CFD model geometry with proposed flood control turning vane Flood control turning vane

4
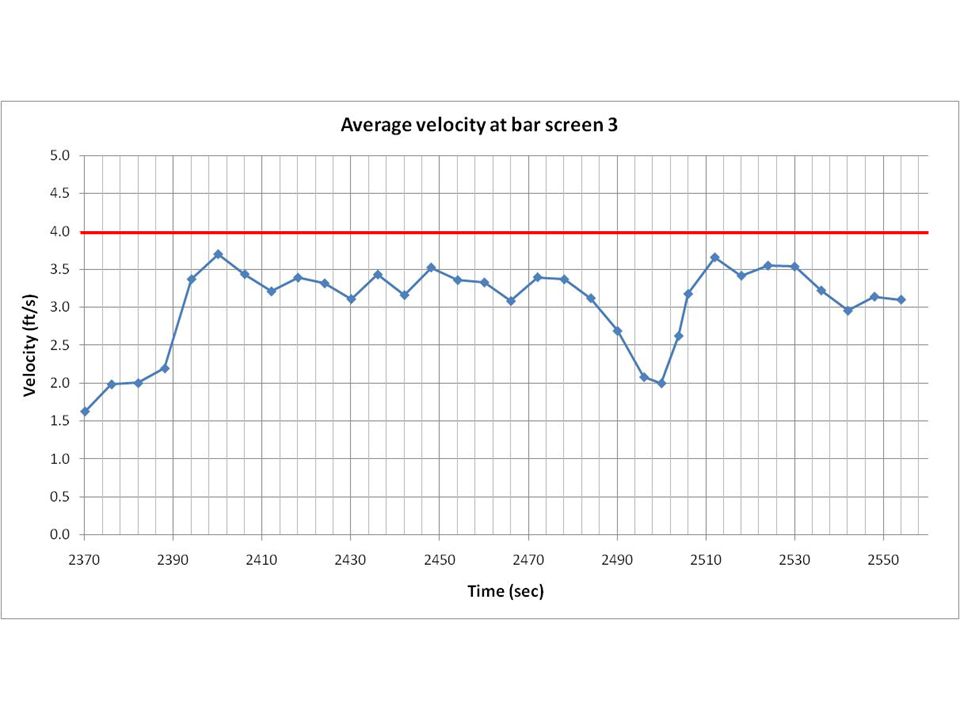
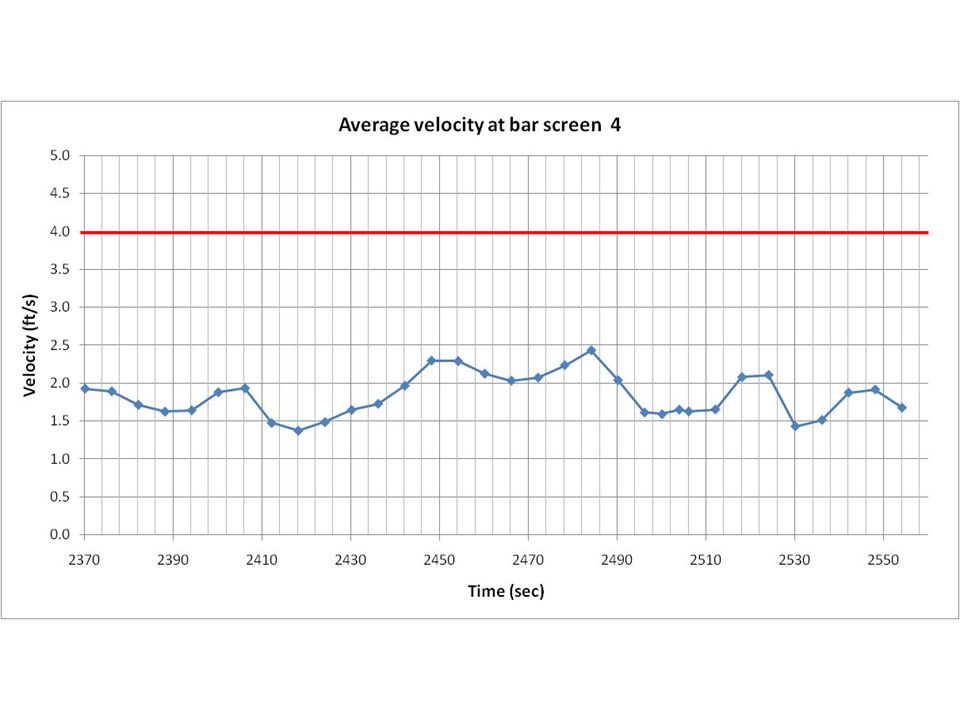
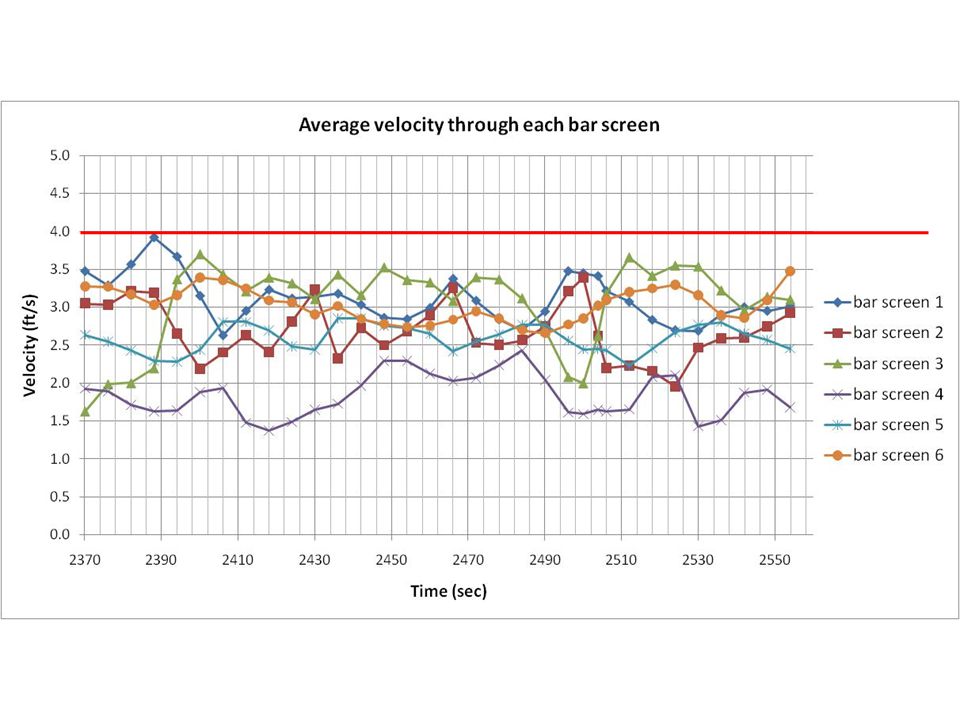
V 6 = 3.32 ft/s V 5 = 3.14 ft/s V 4 = 2.04 ft/s V 3 = 3.63 ft/s V 2 = 3.07 ft/s V 1 = 3.4 ft/s Average velocity (in the bar screen area) Time = 2540 sec. 1 2 34 5 6 (velocity color scale is the actual velocity )
.")
5
88.76 % 98.6 % 100 %80.13 % 95.19 % 80.12 % Percent of bar screen area at or below 4 ft/s 1 2 34 5 6 Time = 2540 sec. (velocity color scale is the actual velocity )
.")
6
1 2 3 4 5 6 Velocity contour through each bar screen Time = 2540 sec. (velocity color scale is the actual velocity ) Iso-view 1
 Iso-view 1.")
7
1 2 3 4 5 6 Velocity contour through each bar screen Time = 2540 sec. (velocity color scale is the actual velocity ) Iso-view 2
 Iso-view 2.")
8
1 2 3 45 6 Velocity contour through each bar screen Time = 2540 sec. (velocity color scale is the actual velocity ) Iso-view 3
 Iso-view 3.")
9
Velocity contour at different locations with different color scales Time = 2540 sec.

10
Plot of velocity contours with vectors (slice plane cut at elevation 476 ft.) Isometric View Same with slide 10 with different color scale Time = 2540 sec.
 Isometric View Same with slide 10 with different color scale Time = 2540 sec.")
11
Iso-surface plot of water colored with velocity magnitude Isometric View

12
Iso-surface plot of water colored with velocity magnitude Isometric View Same with slide 10 with different color scale Time = 2540 sec. same with slide 11 but different color scale

Similar presentations