Download presentation
Presentation is loading. Please wait.

1
The Impact of Letter Grading in NYC

2
Reasons to Speak at CASA

3
THERE ARE THREE THINGS THAT I AM VERY PASSIONATE ABOUT

4
My daughter Rachel

5
Who is now 13……..

6
BRUCE SPRINGSTEEN

7
Who I am going to see tonight ….

8
And the success of the NYC Restaurant Grading System

9
The DOHMH Landscape Approximately 24,000 Restaurants Restaurant Inspections FY ‘13 = 83,914 –Initial Inspections = 40,050 –Re-inspections = 25,391 –Others (Survey’s Complaints, etc.) = 18,473 Avg. No. Restaurant Inspectors FY ‘13 = 85

10
Letter Grading Launched July 2010 GOALS: Use consumer purchasing power to motivate restaurants Reduce unsafe food handling practices and improve restaurant hygiene Publicly reward high-performing restaurants Increase government transparency Reduce, over time, foodborne illness

11
Grading Creates Multiple Incentives for Excellent Performance A-grade card posted in window, website, mobile apps Initial A grade no inspection for year Initial or Re-inspection A grade no fines Improved performance less frequent inspections, lower fines Better practices protect customers

12
Adapting Scores to Grades Earlier Scoring System –Public Health Hazards - 7 Points –Critical Violations – 5 Points –General Violations – 2 Points –Condition Levels - Indicate extent to which violations exist and modifies points –28 or more combined points – Compliance Inspection

14
Adapting Scores to Grades “Administrative” Violations – Scores not counted toward grades. Example: – Permits violations –Calorie labeling –Trans fat

15
How Restaurant Grading Works Scores counted toward grade only include sanitary violations Grading summarizes inspection results into a grade based on a score: –A = 0-13 Points –B = 14-27 Points –C = 28 or more points

16
How Restaurant Grading Works Two types of grading inspections: –Initial inspections Only restaurants receiving an “A” are issued a grade card following this inspection An “A” grade must be posted immediately There are no hearings or fines issued to restaurants receiving an “A” following an inspection, providing an additional incentive to perform well Restaurants scoring 13 or more points are scheduled for a follow-up inspection 2-4 weeks later

17
How Restaurant Grading Works –Re-Inspection Restaurants receiving an “A” must post that grade immediately There are no hearings or fines for restaurants issued an “A” grade following an inspection Restaurants receiving a “B” or “C,” are issued a grade card reflecting their score, and a Grade Pending card Either the grade card or the Grade Pending card must be posted at the end of the inspection

18
How Restaurant Grading Works Due Process –OATH Tribunal –Restaurants are entitled to a hearing before having to post a grade card –A grade card must be posted on the day of the hearing, unless granted an adjournment –If a hearing changes a score to the extent the grade would change, a new grade card is issued and must be posted immediately Restaurants receiving an adjudicated “A” grade must pay incurred fines –Only one adjournment is allowed before the grade must be posted

19
Posted Grades

20
How Restaurant Grading Works Inspection Cycles –Inspection cycles include the: – Initial Inspections –Re-Inspections –Compliance Inspections Compliance Inspections may be assigned to FSEs that have scored poorly on their Initial and Re-Inspections. –May also be assigned in lieu of closing a FSE that has previously performed well on inspections

21
How Restaurant Grading Works Inspection Intervals –The amount of time between the end of one inspection cycle and the start of another is determined by the score received following the initial inspection –Inspection Intervals are determined by the higher score of either the Initial or Re-Inspection. –The interval is not affected by a hearing’s outcome –Intervals (+ or – 1 Month) “A” = 12 Months “B” = 6 Months “C” = 4 Months Closed = 3 Months
 A = 12 Months B = 6 Months C = 4 Months Closed = 3 Months.")
22
Summary Promotes high food safety standards Assures restaurants fairness: –Dual-inspections for a grade –Inspection frequency based on performance –Impartial inspection review by a tribunal –Financial incentives Consumer engagement through greater transparency of inspection results

23
Overview Evaluate grade program impact on Restaurant hygiene & food handling practices Diner behavior Foodborne illness

24
Methods: Hygiene Analysis ItemDescription Data SourceFood Safety and Community Sanitation Tracking System (FACTS) Inspection descriptors & outcomes, restaurant characteristics Time PeriodJuly 2007-July 2013 Inspection TypeRecent initial inspections in time period Inspection Score Adjustments Pre-grade program exclude points from administrative violations Analysis ofInspection scores, cited violations
 Inspection descriptors & outcomes, restaurant characteristics Time PeriodJuly 2007-July 2013 Inspection TypeRecent initial inspections in time period Inspection Score Adjustments Pre-grade program exclude points from administrative violations Analysis ofInspection scores, cited violations")
25
NYC Restaurant Population Approximately 24,000 restaurants operating each day 2007-2013: 43,892 restaurants 38% in Manhattan, 4% in Staten Island 11% chain restaurants 45% quick service with limited seating or take-out

26
A Grades by UHF42 in 2011 and 2013 Source. NYC Environmental Public Health Tracking Portal, accessed March 2014 20112013

27
Score on Recent Initial Inspection, NYC Restaurants, 2010-2013

28
Inspection Performance Improvement Estimated Success of Scoring 13 Points or Less on Initial Inspection in NYC Restaurants, July 2007 - July 2013 (n=172,067) IndicatorSuccess Ratio95% CL (LL, UL) Time Period 13-36 months before gradingReference 0-12 months before grading1.05(1.01, 1.09) 0-12 months after grading0.87(0.84, 0.90) 13-24 months after grading1.26(1.22, 1.31) 25-36 months after grading1.35(1.31, 1.40) Season July-SeptemberReference October-December1.20(1.16, 1.24) January-March1.30(1.26, 1.35) April-June1.20(1.16, 1.24) Chain Restaurant NoReference Yes3.46(3.31, 3.61) Note. BESP frozen initial inspection dataset, initial inspections in restaurants between July 27, 2007 - July 26, 2013

29
Kitchen Cleanliness

30
Kitchen Managers & Workers

31
Food Handling and Holding

32
Pest Control

33
New Yorkers Overwhelmingly Support & Use Grading ResponsePercentage (95% CL) Eats out more than once per week68 (63 - 72) Concerned about getting sick from eating restaurant food in NYC 72 (68 -76) Considers grades when dining out89 (85 - 92) Approve of letter grades91 (87 - 94) Approve of more frequent inspection if an A grade is not earned 89 (85 - 92) More confident eating in an A grade restaurant 77 (72 - 82) Note. July 2011 (n=502) & Jan 2012 (n=511) surveys conducted by Baruch College Survey Research.
 & Jan 2012 (n=511) surveys conducted by Baruch College Survey Research..")
34
Grade Distribution following reinspections Grades Awarded Not Reinspected ReinspectedReinspection pending Estimated Total Percent A Grade (ini/reinsp) 153156627067.00 B Grade 06604024.00 C Grade 0257109.00 Not Graded for B/C initial 0041690.00 Total15315158024169100.00
 B Grade C Grade Not Graded for B/C initial Total")
36
Pre-Adjudicated Score Distribution on Previous Initial Inspection to Recent Initial Inspection as of 3/31/2014 Recent Initial Inspection Score Category Previous Initial Inspection Score Category 0-13 Points0-13 Points %14-27 Points14-27 Points %28+ Points28+ Points %Total 0-13 Points 522769.61162021.576628.827509 14-27 Points 340843.76298538.33139517.917788 28+ Points 180832.35221639.651565285589 Total 10443 6821 3622 20886 Note: Includes active gradable FSEs as of 3/31/2014. Pre-adjudicated inspection scores on each FSEs two most recent initial inspections as of 3/31/2014 are compared. Report generated on 3/31/2014.

37
Next Steps Use results to inform development of educational food safety resources and outreach efforts with operators Analyze hygiene metrics stratified by restaurant characteristics Use other data sources to evaluate program impact on foodborne illness

38
[1 Facts December 2013

39
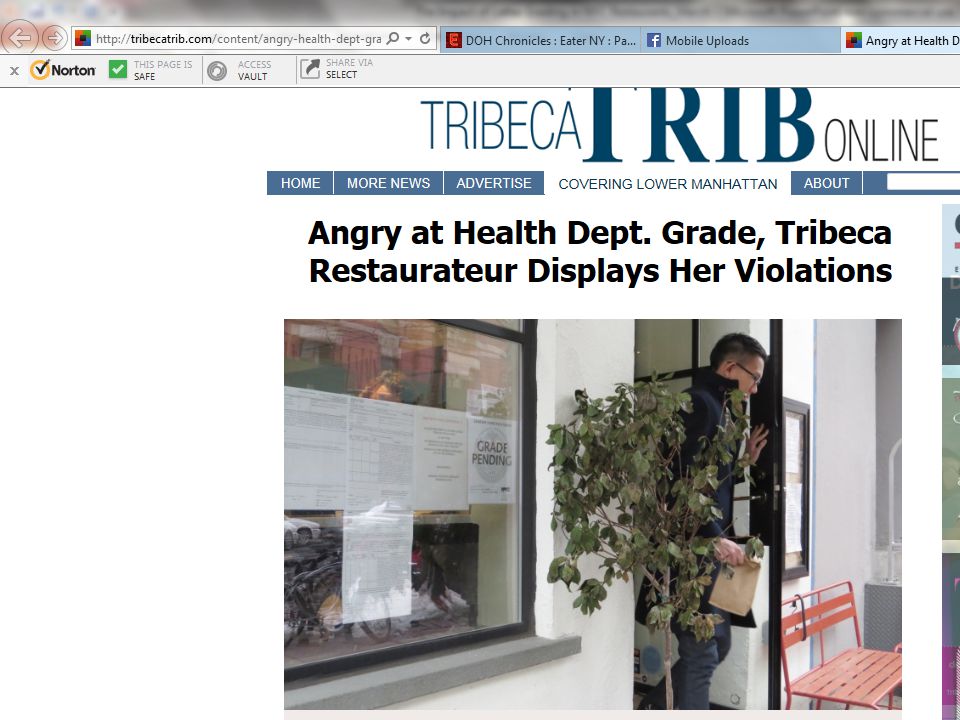
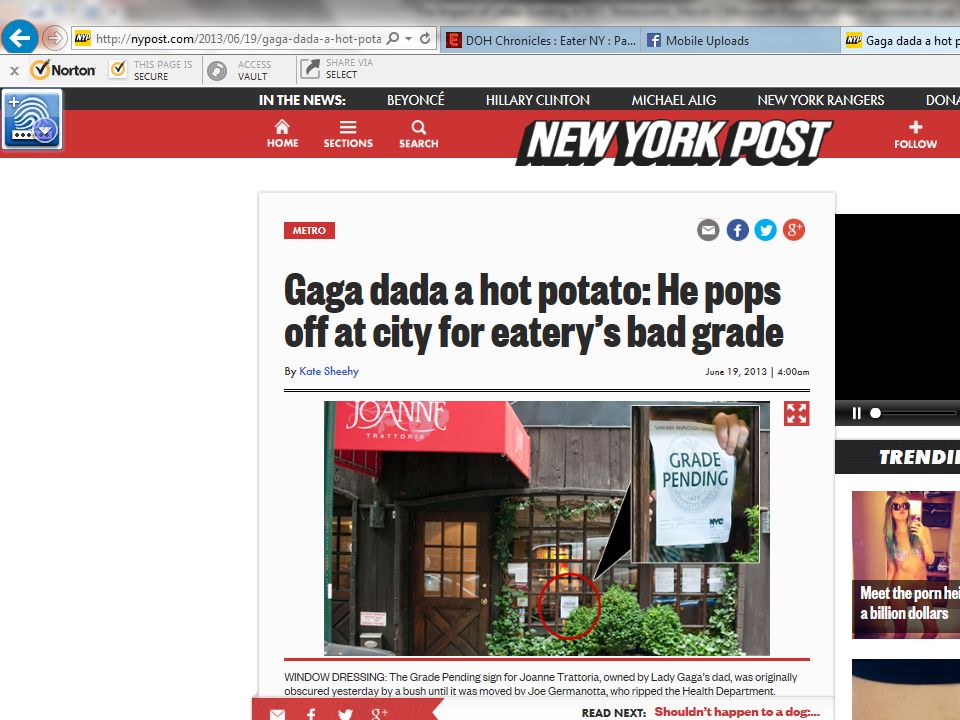
Like Any successful program we have our critics

40
Not our fault Due to the video that was released, the health department used it as evidence to ask us to re-cement and closed down the bakery for extermination. As a small one-shop bakery, we often feel like we're being looked at under a tremendous microscope. A lot of time people don't see the larger ramifications of their actions and how a tiny video of a mouse running across the screen for 3 seconds can cause harm and damages to an honest, small business that people's livelihood depends on. We of course believe that we run a clean and good operation, but see that we were targeted and will rise to the occasion to be even better. Chef says we will be doing everything that was asked of us, and hope to reopen on Monday. And he's sadden for our customers who had plans this weekend that we weren't able to welcome them.

43
Restaurant Grading is a success

44
A majority of Restaurants are Posting an A 87 per cent of Restaurants post an A 11 per cent of Restaurants post a B 2 per cent of Restaurants post a C

45
Salmonella Between 2010 ( the year before grading ) and 2013 there has been a 14 % decline in Salmonella Cases
 and 2013 there has been a 14 % decline in Salmonella Cases")
46
Questions ?

Similar presentations


 patients Policy.>")
 Grants Chapter 6.>")


