Download presentation
Presentation is loading. Please wait.

1
DATA STORY BIOLOGY BENCHMARK 3

2
BENCHMARK I OVERALL SCORES

3
BENCHMARK I DISTRICT COMPARISON

4
BM II OVERALL SCORES

5
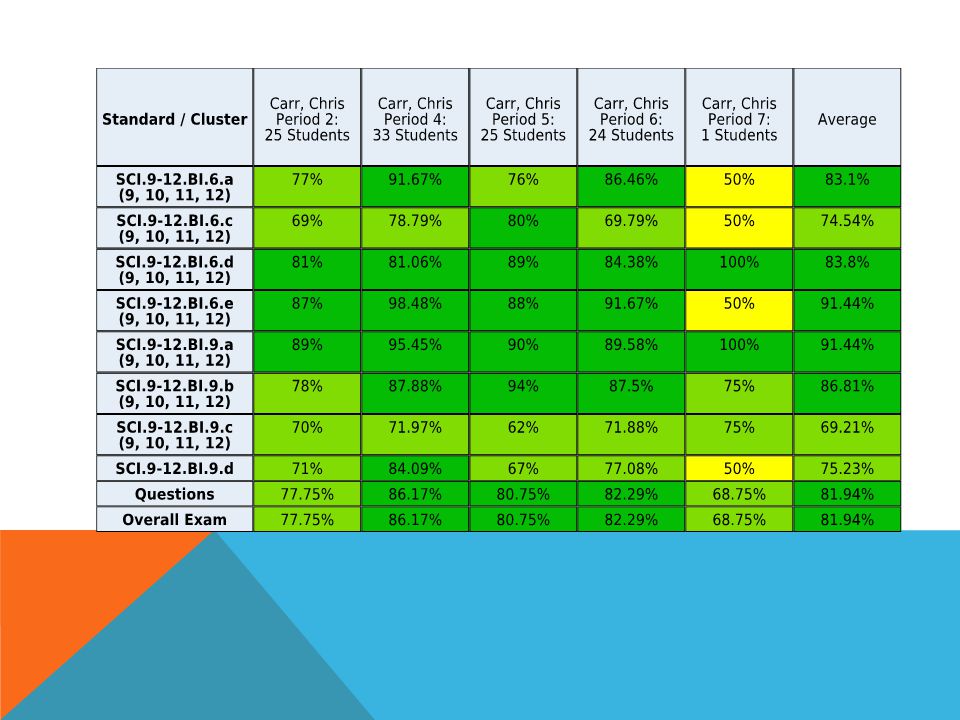
BM II PERIOD COMPARISON

7
AREAS OF STRENGTH Proficient/Advanced 6a, 6d, 6e, 9a, 9b, 9d Ecology and nervous system functioning

11
AREAS OF WEAKNESS BI 9.c-69.21%-Students know how feedback loops in the nervous and endocrine systems regulate conditions in the body. BI 6.c-74.54%-Students know how fluctuations in population size in an ecosystem are determined by the relative rates of birth, immigration, emigration, and death. Question Analysis-6c-difficult vocabulary and long questions (gestation), 9c-high detail questions matching glands to the hormones they produce
, 9c-high detail questions matching glands to the hormones they produce.")
12
ACTION PLAN Explicit instruction of nervous system and homeostasis BM III Self Assessment-all students-tracking standards proficiency throughout the year Test-taking strategies for all students-focus on decoding questions Select focus B students-academic interventions until CST CST Action Plan-Art and PE support vocab and test-taking practice

Similar presentations


 Grade 5 Grade 8 Grade 10 Life Science Standards.>")


 Spring 2009 California Standards Test.>")


 Academic Performance Index (API) and Assessing California Standards Test (CST) Data.>")


