Download presentation
Presentation is loading. Please wait.

1
Infrared Spectroscopy
1

2
Infrared Absorbance

3
IR- Empirical Comparisons
Identifying functional groups in organic molecules

4
Infrared Spectroscopy
Region of infrared that is most useful lies between mm ( cm-1) depends on transitions between vibrational energy states Stretching: higher energy / higher wave number (cm-1) Bending: lower energy / lower wave number (cm-1) 2
 depends on transitions between vibrational energy states. Stretching: higher energy / higher wave number (cm-1) Bending: lower energy / lower wave number (cm-1) 2.")
5
A bond must have a dipole or an induced dipole in order to have an absorbance in the IR spectrum.
When the bond stretches, the increasing distance between the atoms increases the dipole moment. Therefore, the greater the dipole, the more intense the absorption. (i.e., The greater the molar extinction coefficient () in Beer’s law, A = bc.
 in Beer’s law, A = bc.")
6
The energy (IR frequency/ wave number) and the intensity of the absorption band also depends on the concentration of solution from Beer’s law, A = bc. It is easier to stretch an O–H bond if it is hydrogen bonded

7
Functions & Infrared Spectra
Analyzing Structure: Functions & Infrared Spectra The molecular formula is a critical piece of information, which limits the functional possibilities. The presence & absence of absorption bands must be considered in identifying a possible structure in IR spectroscopy. Empiricism is critical to successful identification. NOTE: Bonds which lack dipole moments are not detected.

8
Structural/Functional Components
Figure: UN Caption: The IR spectrum has distinct regions. The left of the spectrum shows the C-H, O-H, and N-H stretches. The triple bonds absorb around 2200 cm-1 followed by the double bonds to the right at around 1700 cm-1. The region below 1400 cm-1 is called the fingerprint region.

10
An Infrared Spectrum The peaks are quantized absorption bands corresponding to molecular stretching and bending vibrations

11
The functional group stretching region The fingerprint region

12
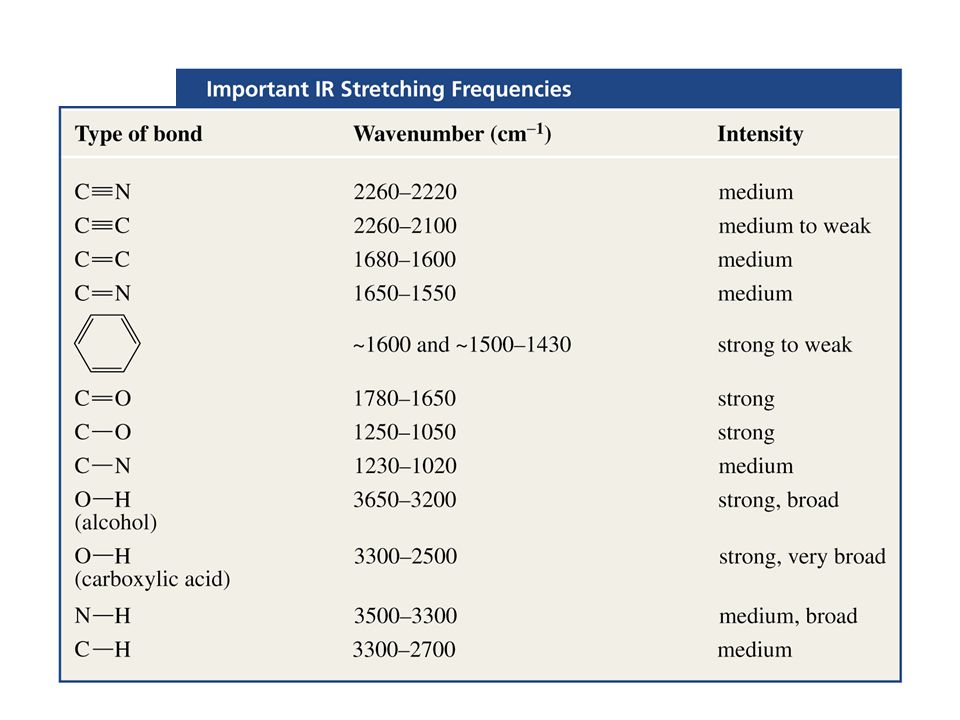
Infrared Absorption Frequencies
Structural unit Frequency, cm-1 Stretching vibrations (single bonds) O—H (alcohols) O—H (carboxylic acids) N—H First examine the absorption bands in the vicinity of cm–1 8
 O—H (alcohols) O—H (carboxylic acids) N—H First examine the absorption bands in the vicinity of cm–1. 8.")
14
IR Spectrum of a Primary Amine(1o)
The N–H bending vibration occurs at ~1600 cm–1

15
Infrared Absorption Frequencies
Structural unit Frequency, cm-1 Stretching vibrations (single bonds) sp C—H sp2 C—H sp3 C—H sp2 C—O 1200 sp3 C—O 8
 sp C—H sp2 C—H sp3 C—H sp2 C—O sp3 C—O")
16
Infrared Absorption Frequencies
Structural unit Frequency, cm-1 Stretching vibrations (single bonds) sp C—H sp2 C—H sp3 C—H sp2 C—O 1200 sp3 C—O 8
 sp C—H sp2 C—H sp3 C—H sp2 C—O sp3 C—O")
17
Infrared Absorption Frequencies
Structural unit Frequency, cm-1 Stretching vibrations (multiple bonds) C —C C— —C N 8
 C —C. C— —C. N")
18
Some hydrocarbon absorption bands

19
Structural Components & Functional Differences:
The nitrogen of an amide is less electronegative than the oxygen of an ester. Therefore the amide has a longer (weaker) C=O bond ( cm-1) and the ester ( cm-1) is shorter (stronger).
 C=O bond ( cm-1) and the ester ( cm-1) is shorter (stronger).")
20
Infrared Absorption Frequencies
Structural unit Frequency, cm-1 Stretching vibrations (carbonyl groups) Aldehydes and ketones Carboxylic acids Acid anhydrides and Esters Amides 8
 Aldehydes and ketones Carboxylic acids Acid anhydrides and Esters Amides")
21
Cyclic aliphatic ketone

22
Mono substituted aromatic methyl ketone

23
Mono substituted aromatic ketone

24
Aliphatic ester I

25
Aliphatic ester II

26
Aliphatic ester III

27
Mono substituted aromatic ester

28
Mono substituted aromatic conjugated ester

29
Infrared Absorption Frequencies
Structural unit Frequency, cm-1 Stretching vibrations (single bonds) sp2 C—O 1200 sp3 C—O 8
 sp2 C—O sp3 C—O")
30
Dihexyl Ether ~1100 cm-1 cm-1 8

31
~1200 cm-1

32
Infrared Absorption Frequencies
Structural unit Frequency, cm-1 Bending vibrations of alkenes CH2 RCH CH2 R2C 890 CHR' cis-RCH CHR' trans-RCH CHR' R2C 8

33
wavenumber (cm–1) assignment
3075 2950 1650 and 890 ?

34
cis trans

35
Summary: C–H bond absorption and hybridization of the carbon atom

36
Distinctive Stretch of C–H Bond in an Aldehyde (the “waggle” vibration)
")
37
Aliphatic aldehyde

38
Mono-substituted aromatic aldehyde

39
Mono-substituted aromatic conjugated aldehyde

40
Mono substituted aromatic ester

41
Para di-substituted aromatic ether & aldehyde

42
Infrared Spectroscopy Common Functional Groups Handout
1

43
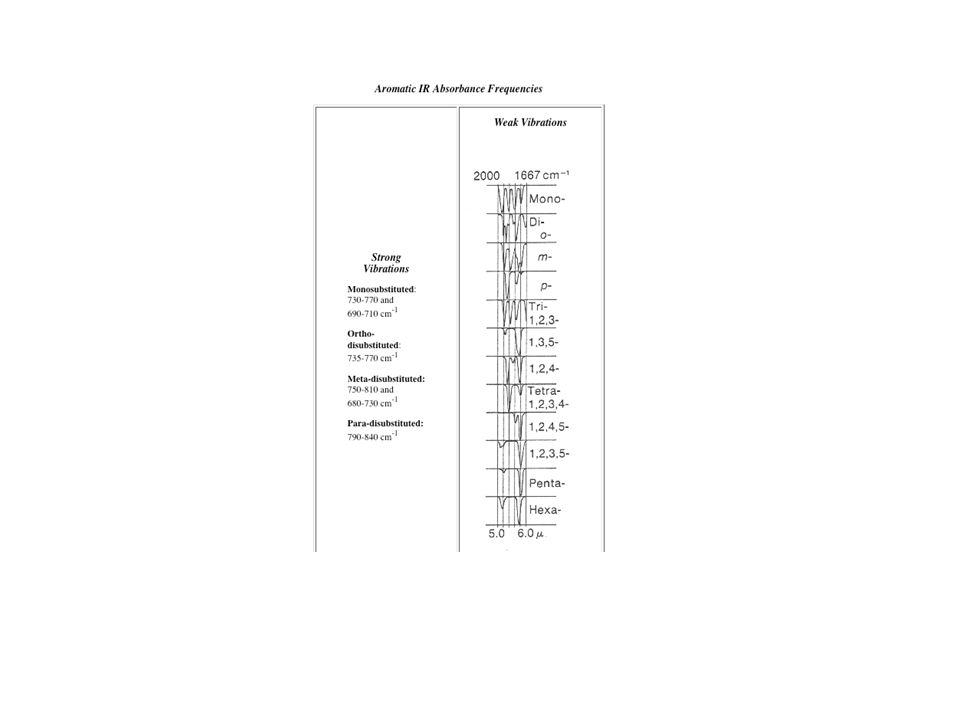
Aromatic Absorption Frequencies
Structural unit Frequency, cm-1 Bending vibrations of derivatives of benzene Monosubstituted and Ortho-disubstituted Meta-disubstituted and Para-disubstituted 8

45
Infrared Spectrum of tert-butylbenzene
C6H5C(CH3)3 Ar—H H—C Monsubstituted benzene 2000 3500 3000 2500 1000 1500 500 Wave number, cm-1 8
3. Ar—H. H—C. Monsubstituted benzene Wave number, cm")
46
Chemical Communication: Smell / Pheromones
Pheromone Synthesis [20:40-23:51]

47
Infrared Spectroscopy Common Functional Groups QUIZ
1

48
Is the following IR of cis or trans 2-pentene?
Question Is the following IR of cis or trans 2-pentene? cis B) trans
 trans.")
49
Question Identify the compound from the IR above. benzyl alcohol
C7H6O Identify the compound from the IR above. benzyl alcohol 1,4,6-heptatrien-3-one 2,4,6-heptatrienaldehyde benzaldehyde

50
Question Identify the compound from the IR above.
C10H12O Identify the compound from the IR above. 4-phenylbutanaldehyde phenylpropyl ketone meta-isopropylbenzaldehyde 1-phenyl-2-butanone

51
Question Identify the compound from the IR above. cyclopropanone
C3H4O Identify the compound from the IR above. cyclopropanone propynol 2-cyclopropenol 1,2-propadienol

52
Question Identify the compound from the IR above. N-methylacetamide
C3H7NO Identify the compound from the IR above. N-methylacetamide N,N-dimethylformamide 3-aminopropanal N-methylamino-ethanal

53
Question I II III Match the ortho, meta and para isomers of xylene.
B) C) D)
 C) D)")
54
Question Identify the compound from the IR above. methylbenzoate
C8H8O2 Identify the compound from the IR above. methylbenzoate phenylacetate p-anisaldehyde o-anisaldehyde

Similar presentations


>")


 rays at.>")

>")


