Download presentation
Presentation is loading. Please wait.

1
Why Should I Care Who’s an Engineer? The Need for Women in Engineering Cathy Pieronek SWE Title IX Lead 4 May 2013

2
Agenda Introduction & motivation History of women in engineering Status of women in engineering today Why the under-representation of women in engineering matters Why women are under-represented in engineering What you need to know

3
Presenter – Cathy Pieronek Assistant Dean for Academic Affairs College of Engineering, Univ. of Notre Dame Also initiated and currently direct ND’s Women’s Engineering Program Education B.S. in aerospace engineering, Notre Dame M.S. in aerospace engineering, UCLA J.D., Notre Dame Engineering experience Spacecraft systems engineer, NASA programs, TRW Space & Defense Sector, Redondo Beach, CA SWE Title IX Lead Focusing on the application of Title IX to STEM fields

4
Motivation While women have made great strides across all fields of study and employment, their unequal representation in STEM fields matters Women comprise only 10-12% of the engineering workforce, but nearly 50% of payroll employment nationally STEM fields are among the highest-paying, especially at the entry level (bachelor’s degree only) Unequal participation of women in STEM fields results in: Lower national economic competitiveness Persistent economic inequity for women and their families Less racial and ethnic diversity in the workforce
 Unequal participation of women in STEM fields results in: Lower national economic competitiveness Persistent economic inequity for women and their families Less racial and ethnic diversity in the workforce")
5
History of Women in Engineering

6
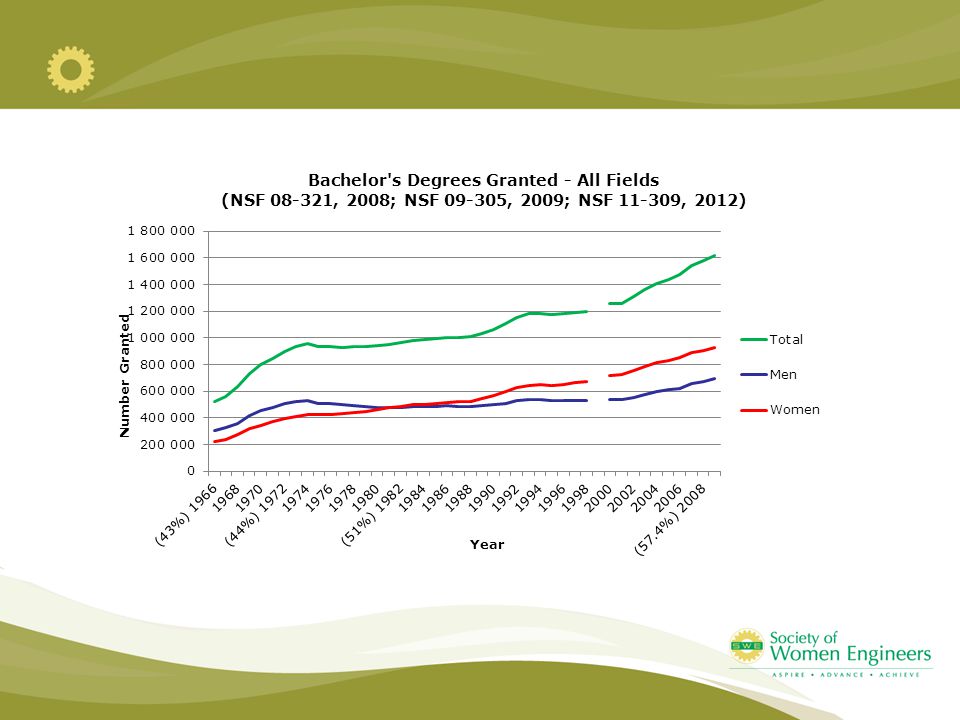
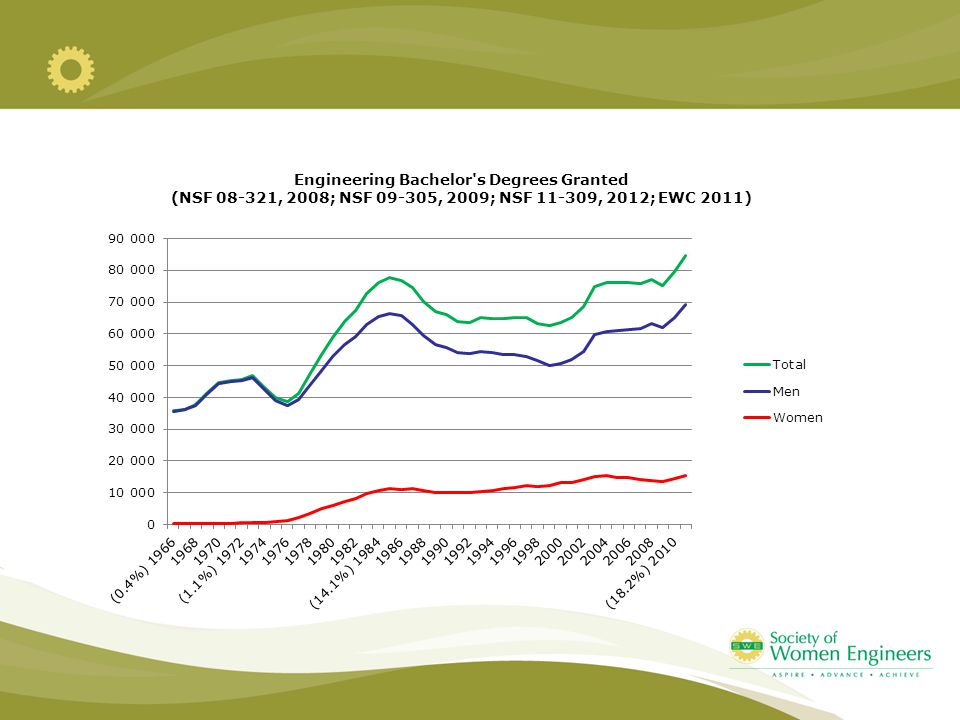
Before 1972 In the 1960s, women were ~ 50% of college-aged population, but earned 53.8% of all high school diplomas 43% of all bachelor’s degrees (any major) 0.7% of all engineering bachelor’s degrees More single-sex colleges than today Women’s colleges didn’t offer engineering Women had limited access to certain programs Co-ed colleges limited enrollment of women Law, medicine, etc., limited participation of women
 0.7% of all engineering bachelor’s degrees More single-sex colleges than today Women’s colleges didn’t offer engineering Women had limited access to certain programs Co-ed colleges limited enrollment of women Law, medicine, etc., limited participation of women")
7
Moment of Change: Title IX Enacted (1972) Congress sought to prohibit sex-based discrimination in all federally funded educational programs and activities Bans all sex-based discrimination at K-12 and post- secondary levels Caused major changes in higher education Many all-men’s colleges opened to women or merged with sister schools Historically co-ed schools opened all academic (and athletic) programs to women
 Congress sought to prohibit sex-based discrimination in all federally funded educational programs and activities Bans all sex-based discrimination at K-12 and post- secondary levels Caused major changes in higher education Many all-men’s colleges opened to women or merged with sister schools Historically co-ed schools opened all academic (and athletic) programs to women")
8
A decade later (1982) In 1982, women earned: 50.5% of all bachelor’s degrees 12.3% of engineering bachelor’s degrees o An increase of 1657% over 1972 Post-graduate engineering degrees earned by women also increased dramatically From 1.6% to 9% of master’s degrees From 0.6% to 4.7% of PhD degrees
 In 1982, women earned: 50.5% of all bachelor’s degrees 12.3% of engineering bachelor’s degrees o An increase of 1657% over 1972 Post-graduate engineering degrees earned by women also increased dramatically From 1.6% to 9% of master’s degrees From 0.6% to 4.7% of PhD degrees")
9
1982 to 2008 Number of engineering bachelor’s degrees granted to women grew significantly from 1972 to 1985, but leveled off quickly No real growth in numbers since 1985 Percentage changes result from large fluctuations in number of men earning EG degrees Growth in engineering master’s and Ph.D. degrees continued slowly, and leveled off around 1995 Today, slight growth again at both advanced degree levels But, 42% of MS and 48% of PhD degrees go to non- domestic students

10
Status of Women in Engineering Today

11
Status of women in higher ed today 48.6% of US college-aged population (18-24 year olds) 57.4% of bachelor’s degrees; 18.5% of engineering BS degrees 6.3% non-US, vs. 5.9% for men 60.6% of master’s degrees; 23% of engineering MS degrees 41.2% non-US, vs. 40.3% for men 50.4% of doctoral degrees; 21.6% of engineering PhD degrees 54.0% non-US, vs. 62.7% for men Women are over-represented in chemical, civil, agricultural and bioengineering, among other fields Good news: chemical is highest-paid at B.S. level Bad news: other disciplines at lower end of engineering pay scale

12
Women in Illinois & Missouri vs. Nation Bachelor’s degrees earned by women: Nationally, 57.4% Illinois, 56.7% Missouri, 58.1% Engineering bachelor’s degrees earned by women: Nationally, 18.2% (6.3% to foreign nationals) Illinois, 18.0% (17.1% to foreign nationals) Missouri, 18.7% (7.0% to foreign nationals) Engineering master’s degrees earned by women: Nationally, 22.6% (41.2% to foreign nationals) Illinois, 24.5% (65.3% to foreign nationals) Missouri, 17.6% (46.7% to foreign nationals) Engineering PhD degrees earned by women: Nationally, 21.7% (54.0% to foreign nationals) Illinois, 22.7% (54.0% to foreign nationals) Missouri, 25.2% (64.5% to foreign nationals)
 Illinois, 18.0% (17.1% to foreign nationals) Missouri, 18.7% (7.0% to foreign nationals) Engineering master’s degrees earned by women: Nationally, 22.6% (41.2% to foreign nationals) Illinois, 24.5% (65.3% to foreign nationals) Missouri, 17.6% (46.7% to foreign nationals) Engineering PhD degrees earned by women: Nationally, 21.7% (54.0% to foreign nationals) Illinois, 22.7% (54.0% to foreign nationals) Missouri, 25.2% (64.5% to foreign nationals).")
17
U.S. Demographics Overall, the group of women earning B.S. degrees in engineering is more diverse than the group of men Women earning engineering B.S. degrees = 61.4% white o Illinois, 57.8% white o Missouri, 78.1% white Men earning engineering B.S. degrees = 70.4% white o Illinois, 65.3% white o Missouri, 82.8% white Nationwide, women earn 23% of engineering BS degrees granted to non-white domestic students (in Illinois, 20.4%; in Missouri, 25.4%) o 25.5% of engineering BS degrees granted to African-American students (in Illinois, 23.7%; in Missouri, 25.4%) But only 16.3% of engineering BS degrees granted to white students (in Illinois, 16.2%; in Missouri, 17.8%)
 o 25.5% of engineering BS degrees granted to African-American students (in Illinois, 23.7%; in Missouri, 25.4%) But only 16.3% of engineering BS degrees granted to white students (in Illinois, 16.2%; in Missouri, 17.8%).")
19
Top Producers of Female Engineering Graduates: U.S. Engineering schools that grant more than 50 engineering degrees per year, 10 highest percentages of female engineers (ASEE 2010-11 data): Olin College of Engineering44.9% MIT43.4% Univ. of Tennessee, Chattanooga41.9% Howard University (HBCU)38.2% Brown University36.2% Tuskegee University36.1% Harvey Mudd College35.9% Columbia University35.3% Dartmouth College34.5% Mercer University33.3% Of this list, only MIT (at #25) also appears in the top 50 producers of engineering B.S. degrees
: Olin College of Engineering44.9% MIT43.4% Univ. of Tennessee, Chattanooga41.9% Howard University (HBCU)38.2% Brown University36.2% Tuskegee University36.1% Harvey Mudd College35.9% Columbia University35.3% Dartmouth College34.5% Mercer University33.3% Of this list, only MIT (at #25) also appears in the top 50 producers of engineering B.S. degrees.")
20
Female Engineering Graduates by School in Illinois and Missouri Illinois (18% women overall) Northwestern325 total105 (F)32.3% Olivet Nazarene7228.6% Illinois Institute of Tech.2566425.0% Illinois – Urbana/Champaign146824816.9% So. Illinois – Carbondale135 21 15.6% So. Illinois – Edwardsville235 33 14.0% Illinois – Chicago392 55 14.0% Bradley University1802111.7% Northern Illinois University121129.9% Missouri (18.7% women overall) Southeast Missouri State5240.0% Washington U St. Louis2708230.4% Missouri U of Science & Tech84315218.0% St. Louis University991717.2% Missouri – Columba & KC3984912.3%
 Southeast Missouri State5240.0% Washington U St. Louis % Missouri U of Science & Tech % St. Louis University % Missouri – Columba & KC %.")
21
Additional Facts - Illinois 75% of Illinois college students are Illinois residents 22.6% of male high school students, but only 2.3% of female high school students, are interested in a career in engineering By 2018, Illinois is projected to need to fill 348,000 STEM jobs (75,000 in engineering alone) – 6 th among states In 2008-09, Illinois schools awarded 15,767 STEM degrees (22.7% of all degrees awarded, below national average of 24.2%) In 2008-09, Illinois schools awarded 3198 engineering & engineering technology degrees (4.6% of all degrees, national average is 5.3%) UIUC, grants most engineering degrees in state (1468), but only 11 to African Americans (0.7%) and 50 to Hispanics (3.4%) African Americans comprise 14.5% of state’s population Hispanics comprise 15.8% of state’s population
 – 6 th among states In , Illinois schools awarded 15,767 STEM degrees (22.7% of all degrees awarded, below national average of 24.2%) In , Illinois schools awarded 3198 engineering & engineering technology degrees (4.6% of all degrees, national average is 5.3%) UIUC, grants most engineering degrees in state (1468), but only 11 to African Americans (0.7%) and 50 to Hispanics (3.4%) African Americans comprise 14.5% of state’s population Hispanics comprise 15.8% of state’s population")
22
Additional Facts - Missouri 72% of Missouri college students are Missouri residents 24.4% of male high school students, but only 2.3% of female high school students, are interested in a career in engineering By 2018, Missouri is projected to need to fill 143,000 STEM jobs (32,000 in engineering alone) – 20 th among states In 2008-09, Missouri schools awarded 9588 STEM degrees (25% of all degrees awarded, above national average of 24.2%) In 2008-09, Missouri schools awarded 1837 engineering & engineering technology degrees (4.9% of all degrees, national average is 5.3%) MST, grants most engineering degrees in state (843), but only 42 to African Americans (5.0%) and 15 to Hispanics (1.8%) African Americans comprise 11.6% of state’s population Hispanics comprise 3.5% of state’s population
 – 20 th among states In , Missouri schools awarded 9588 STEM degrees (25% of all degrees awarded, above national average of 24.2%) In , Missouri schools awarded 1837 engineering & engineering technology degrees (4.9% of all degrees, national average is 5.3%) MST, grants most engineering degrees in state (843), but only 42 to African Americans (5.0%) and 15 to Hispanics (1.8%) African Americans comprise 11.6% of state’s population Hispanics comprise 3.5% of state’s population")
23
Why the Under-representation of Women in Engineering Matters

24
For Women - Economic Equity Math, computer science and engineering are among the highest- paid occupations (BLS 2007). Higher average new assistant professor salaries (CHE 3/7/11) o Engineering: $76,518 o Psychology: $54,859 o Biology & biomed sciences:$57,272 Top 10 highest-paying jobs with only a bachelor’s degree are all EG, CS or IT fields (NACE 2010) Median salary for people age 29 & younger by first degree favors engineering degrees. o Engineering$56K o Psychology$35K o Biology$30K Small wage gap between men and women with engineering degrees.
 o Engineering: $76,518 o Psychology: $54,859 o Biology & biomed sciences:$57,272 Top 10 highest-paying jobs with only a bachelor’s degree are all EG, CS or IT fields (NACE 2010) Median salary for people age 29 & younger by first degree favors engineering degrees. o Engineering$56K o Psychology$35K o Biology$30K Small wage gap between men and women with engineering degrees..")
25
For Our Communities - Competitiveness Proportion of white men in US population will shrink to about 34% in the coming decades. Currently, white men comprise 67.5% of all employed engineers A lack of women and other under-represented groups in engineering will hurt economic competitiveness. Currently, women comprise 11.5% of all employed engineers Minority males comprise 21% Demand for scientists & engineers over the next decade is expected to increase at four times the rate of all other occupations (Georgetown University 2010)
.")
26
For Our Industries – Good Business Women make most purchasing decisions Women design for women in ways men don’t Business studies have shown that women leaders tend to behave more ethically than male leaders Tend to be less inclined to take excessive risks Companies with at least one woman on the board have better business results, better risk management and lower rates of bankruptcy than companies with no woman on the board (Int’l J of Business Governance and Ethics, 2013) Women on corporate boards are far more likely than men to favor increased boardroom diversity, new regulations for executive compensation, proxy access for shareholders and enhanced risk management (Heidrick & Struggles, 2010) Many studies have highlighted the value of diversity on project/work teams Improving conditions for women also can lead to increased diversity
 Women on corporate boards are far more likely than men to favor increased boardroom diversity, new regulations for executive compensation, proxy access for shareholders and enhanced risk management (Heidrick & Struggles, 2010) Many studies have highlighted the value of diversity on project/work teams Improving conditions for women also can lead to increased diversity")
27
Factors that Affect the Success of Women in Engineering

28
Why are women underrepresented in engineering? Internal factors Interest o Christina Hoff Sommers of AEI: her granddaughter prefers playing with dolls, so (all) girls must be differently wired Ability o Lawrence Summers, former Harvard president: women just can’t do science the way men can o Various studies that show that girls have lower levels of spatial reasoning skills than boys External factors Climate o Hostile or supportive or ambivalent? Culture - Messages we send our girls and young women
 girls must be differently wired Ability o Lawrence Summers, former Harvard president: women just can’t do science the way men can o Various studies that show that girls have lower levels of spatial reasoning skills than boys External factors Climate o Hostile or supportive or ambivalent. Culture - Messages we send our girls and young women.")
29
Interest? If interest truly is a function of genetics, we’d expect to see similar trends across the globe Significant regional differences internationally Significant regional differences nationally o Lower participation of women in engineering in the southeast US and Utah (religious/cultural) Likely more a matter of acculturation/culture than genetics
 Likely more a matter of acculturation/culture than genetics.")
30
International Trends By region, percentage of first engineering degrees granted to women: South America34.5% Central/Eastern Europe31.5% Africa29.2% Western Europe27.5% Oceania25.3% North/Central America23.2% Middle East22.1% Asia18.6% But, no data by gender available for China, Russia or India, which together account for 45% of all first engineering degrees granted worldwide.

31
International Trends Countries granting more than 5,000 first engineering degrees – top five producers of female engineers: Argentina48.7% Algeria37.9% Columbia37.8% Bulgaria37.7% Portugal35.2% United States: 26 th of 31 countries on this list, at 19.5% Bottom five: Japan11.6% Taiwan13.5% Netherlands14.5% United Kingdom15.5% Iraq18.9%

32
Interest varies by field Women comprise more than 30% of B.S. graduates in agricultural, bio, chemical, environmental and industrial engineering (EWC 2011) These fields together account for 33.6% of all engineering B.S. degrees earned by women in 2011 But, these fields together account for only 17.9% of all engineering B.S. degrees granted nationwide in 2011 Women are under-represented in the four largest engineering fields (mechanical, civil, electrical & computer) (EWC 2011) Together account for 66% of all engineering B.S. degrees in 2011 But only 48.7% of all degrees granted to women Civil is 20.5% women, while others are 11-11.5% women
 These fields together account for 33.6% of all engineering B.S. degrees earned by women in 2011 But, these fields together account for only 17.9% of all engineering B.S. degrees granted nationwide in 2011 Women are under-represented in the four largest engineering fields (mechanical, civil, electrical & computer) (EWC 2011) Together account for 66% of all engineering B.S. degrees in 2011 But only 48.7% of all degrees granted to women Civil is 20.5% women, while others are % women.")
33
Interest – IL/MO universities U of Illinois Urbana/Champaign (16.9%) 48% bioengineering, 38% agricultural, 30% chemical, 25% each civil and metallurgical Fields account for 30% of UIUC engineering degrees Northwestern (32.3%) Reasonably well distributed across fields, but no female graduates in computer engineering, and low representation in electrical engineering Missouri U of Science & Technology (18%) 42% architectural, 35% chemical, 26% civil Fields account for 26% of MST engineering degrees Washington U of St. Louis (30.4%) 47% of bioengineers Accounts for 37% of WUSL engineering degrees
 47% of bioengineers Accounts for 37% of WUSL engineering degrees.")
34
Ability? Eighth-grade boys and girls exhibit equivalent performance on math assessment tests, and have for at least two decades (NAEP 2009). High school girls take 55% of all AP tests (College Board 2009): 47% of calculus and chemistry tests But only 31% of physics tests and 17% of computer science tests High school girls represent 53% of all SAT test-takers: Score lower in math than boys (average 31 points) But outperform men in college-level math courses KEY POINT: Need to understand what happens in high schools to discourage girls
. High school girls take 55% of all AP tests (College Board 2009): 47% of calculus and chemistry tests But only 31% of physics tests and 17% of computer science tests High school girls represent 53% of all SAT test-takers: Score lower in math than boys (average 31 points) But outperform men in college-level math courses KEY POINT: Need to understand what happens in high schools to discourage girls.")
35
Ability? Generally, girls do not perform as well as boys on spatial reasoning tests, but recent studies have proven that this is a skill that can be taught – it is not simply an innate characteristic Engineers are problem-solvers by education; mothers are problem solvers by necessity – girls need to have their problem-solving abilities reinforced Likely more a matter of acculturation/culture than ability, either innate or learnable

36
Climate? Athena Factor (HBR 2008) revealed climate issues in the IT industry: Masculine-oriented culture, sometimes hostile Severe isolation Mysterious career paths Systems of reward that emphasize risk-taking Extreme work pressures (travel, extended work-weeks) Stemming the Tide (UW-Madison 2011) studied engineering and found similar factors negatively affected women’s persistence in engineering
 revealed climate issues in the IT industry: Masculine-oriented culture, sometimes hostile Severe isolation Mysterious career paths Systems of reward that emphasize risk-taking Extreme work pressures (travel, extended work-weeks) Stemming the Tide (UW-Madison 2011) studied engineering and found similar factors negatively affected women’s persistence in engineering.")
37
Climate? 2007 study by the Healthcare Businesswomen’s Association identified elements of women-friendly technical workplaces: Senior leadership support Equitable performance evaluation processes Metrics focused on behavior and results Recruitment practices that support equal representation of women Advancement programs for high potential women Career and work flexibility to retain talent

38
Stemming the Tide Study Recommendations for Business: Create clear, visible and transparent paths toward advancement Invest in providing substantial training and professional development Communicate clear work goals and relevance of individual tasks to the big picture Create a positive climate o Root out uncivil and undermining behaviors o Create supportive networks, including formal and informal mentoring o Offer work-life initiatives that support the family structure Recommendations for Higher Education Align curriculum with industry needs Zero tolerance for incivility Teach career management skills

39
The Role of Title IX and other Gender-Equity Initiatives

40
Title IX & STEM Educational “choices” made by girls & women affect their ability to participate in the STEM workforce Title IX opened all educational options to girls women But the “choices” girls & women make to participate in STEM fields can be affected by the culture or environment of those fields Title IX requires more than just “allowing” women to engage in particular fields – the law also requires educational institutions to ensure freedom from the biases (subtle or overt) that affect women’s participation in all fields.
 that affect women’s participation in all fields.")
41
Other Gender-Equity Initiatives Similarly, workplace “choices” made by women are made, in part, because of the workplace environments they face (2004 GAO study) Civil rights laws prevent the active discrimination against women in the workplace (Title VII of the Civil Rights Act) But civil rights laws do not necessarily impact facially neutral workplace policies or cultures, even if those policies or cultures differentially impact women We must do more than merely “allow” women to engage in particular fields – we must identify and remedy those factors that negatively drive women away And in doing so, will improve the workplace for men as well!
 Civil rights laws prevent the active discrimination against women in the workplace (Title VII of the Civil Rights Act) But civil rights laws do not necessarily impact facially neutral workplace policies or cultures, even if those policies or cultures differentially impact women We must do more than merely allow women to engage in particular fields – we must identify and remedy those factors that negatively drive women away And in doing so, will improve the workplace for men as well!")
42
Questions?

Similar presentations


 pantry survey found that.>")


 Grants Chapter 6.>")


