Download presentation
Presentation is loading. Please wait.

1
The Warm Winter of 2011-2012 What caused it? It was a La Niña winter…aren’t they supposed to be cold?

2
La Niña La Niña is characterized by unusually cold ocean temperatures in the Equatorial Pacific With a La Niña pattern, wetter than normal conditions are often experienced across the Pacific Northwest United States as well as far western Canada and drier and warmer than normal conditions across much of the southern United States. La Niña is only one of a number of factors that influence weather in temperate climates, so La Niña years are not always marked by "typical" La Niña conditions.

4
The “Wild Card” Quote from NOAA: “ For the second winter in a row, La Niña will influence weather patterns across the country, but as usual, it’s not the only climate factor at play. The ‘wild card’ is the lesser-known and less predictable Arctic Oscillation that could produce dramatic short-term swings in temperatures this winter.”

6
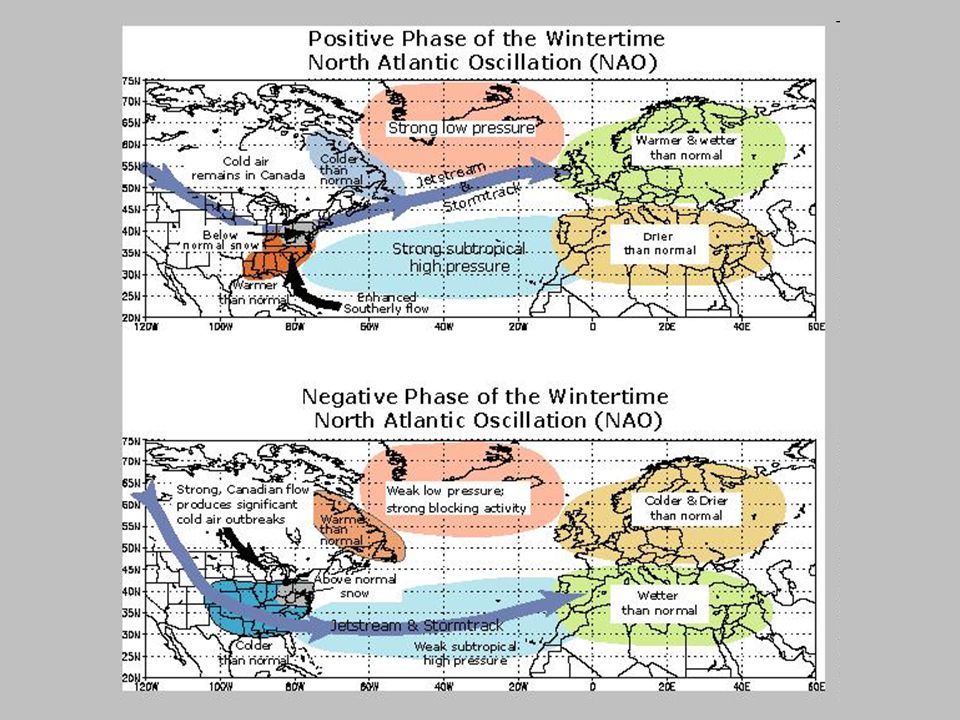
The cause of the winter warmth is the most extreme configuration of the jet stream ever recorded, as measured by the North Atlantic Oscillation (NAO). The Arctic Oscillation (AO) and its close cousin, the North Atlantic Oscillation (one can think of this as the North Atlantic’s portion of the larger-scale AO), are climate patterns in the Northern Hemisphere defined by fluctuations in the difference of sea-level pressure in the North Atlantic between the Icelandic Low and the Azores High.
 and its close cousin, the North Atlantic Oscillation (one can think of this as the North Atlantic’s portion of the larger-scale AO), are climate patterns in the Northern Hemisphere defined by fluctuations in the difference of sea-level pressure in the North Atlantic between the Icelandic Low and the Azores High..")
8
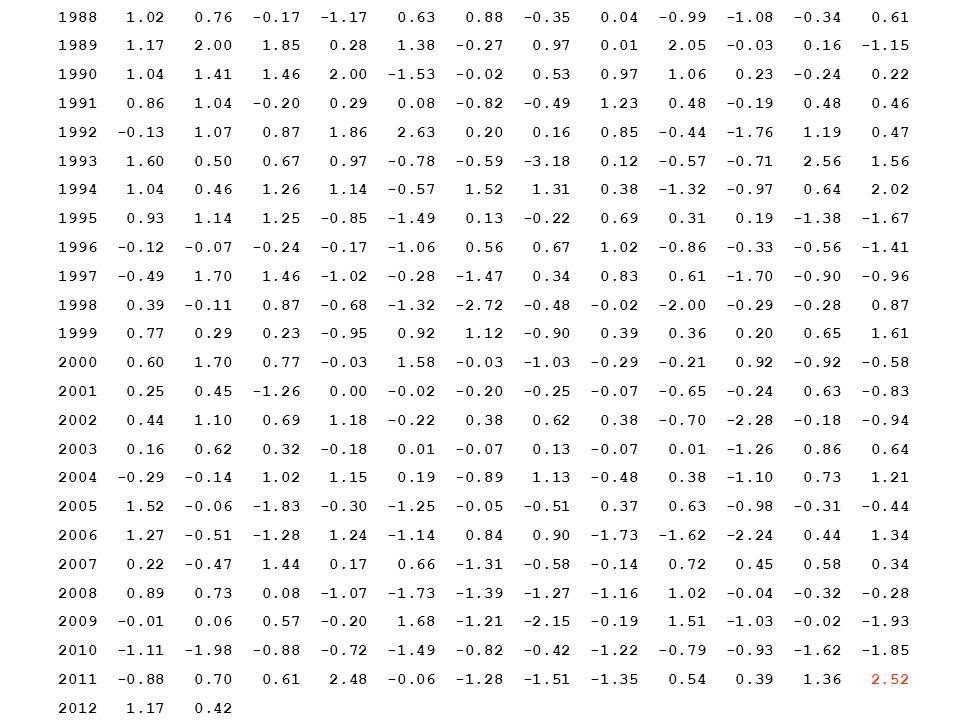
NAO Gone Wild During December 2011, the NAO index was +2.52, the strongest positive NAO on record for December (since 1865). This extreme difference in pressure “trumped” the La Niña for much of this past winter. All predictions were for a colder than average winter, since this is normal during most La Niña winters.

9
1950 0.92 0.40 -0.36 0.73 -0.59 -0.06 -1.26 -0.05 0.25 0.85 -1.26 -1.02 1951 0.08 0.70 -1.02 -0.22 -0.59 -1.64 1.37 -0.22 -1.36 1.87 -0.39 1.32 1952 0.93 -0.83 -1.49 1.01 -1.12 -0.40 -0.09 -0.28 -0.54 -0.73 -1.13 -0.43 1953 0.33 -0.49 -0.04 -1.67 -0.66 1.09 0.40 -0.71 -0.35 1.32 1.04 -0.47 1954 0.37 0.74 -0.83 1.34 -0.09 -0.25 -0.60 -1.90 -0.44 0.60 0.40 0.69 1955 -1.84 -1.12 -0.53 -0.42 -0.34 -1.10 1.76 1.07 0.32 -1.47 -1.29 0.17 1956 -0.22 -1.12 -0.05 -1.06 2.21 0.10 -0.75 -1.37 0.24 0.88 0.51 0.10 1957 1.05 0.11 -1.26 0.49 -0.79 -0.72 -1.19 -0.55 -1.66 1.32 0.73 0.12 1958 -0.54 -1.06 -1.96 0.37 -0.24 -1.38 -1.73 -1.56 -0.07 0.16 1.64 -0.70 1959 -0.87 0.68 -0.15 0.36 0.39 0.40 0.74 0.06 0.88 0.89 0.41 0.44 1960 -1.29 -1.89 -0.50 1.36 0.45 -0.21 0.35 -1.40 0.39 -1.73 -0.51 0.06 1961 0.41 0.45 0.55 -1.55 -0.36 0.86 -0.39 0.90 1.24 0.51 -0.62 -1.48 1962 0.61 0.55 -2.47 0.99 -0.10 0.16 -2.47 0.14 -0.37 0.41 -0.23 -1.32

10
1963 -2.12 -0.96 -0.43 -1.35 2.16 -0.43 -0.77 -0.64 1.79 0.94 -1.27 -1.92 1964 -0.95 -1.43 -1.20 0.36 0.52 1.29 1.90 -1.77 0.20 0.74 -0.01 -0.15 1965 -0.12 -1.55 -1.51 0.72 -0.62 0.29 0.32 0.45 0.37 0.38 -1.66 1.37 1966 -1.74 -1.39 0.56 -0.75 0.22 1.05 0.32 -1.76 -0.45 -0.68 -0.04 0.72 1967 -0.89 0.19 1.51 0.18 -0.99 1.40 0.41 1.44 0.93 0.07 0.60 -0.45 1968 0.13 -1.29 0.40 -1.08 -1.76 0.33 -0.80 -0.66 -1.92 -2.30 -0.93 -1.40 1969 -0.83 -1.55 -1.56 1.53 0.55 0.55 0.57 -1.45 2.07 0.66 -0.96 -0.28 1970 -1.50 0.64 -0.96 -1.30 1.14 1.55 0.10 0.10 -0.09 -0.92 -0.60 -1.20 1971 -1.13 0.24 -0.84 -0.24 0.50 -1.57 0.24 1.55 0.39 0.58 -0.20 0.60 1972 0.27 0.32 0.72 -0.22 0.95 0.88 0.18 1.32 -0.12 1.09 0.54 0.19 1973 0.04 0.85 0.30 -0.54 -0.44 0.39 0.57 -0.06 -0.30 -1.24 -0.93 0.32 1974 1.34 -0.14 -0.03 0.51 -0.24 -0.14 -0.76 -0.64 0.82 0.49 -0.54 1.50 1975 0.58 -0.62 -0.61 -1.60 -0.52 -0.84 1.55 -0.26 1.56 -0.54 0.41 0.00 1976 -0.25 0.93 0.75 0.26 0.96 0.80 -0.32 1.92 -1.29 -0.08 0.17 -1.60 1977 -1.04 -0.49 -0.81 0.65 -0.86 -0.57 -0.45 -0.28 0.37 0.52 -0.07 -1.00 1978 0.66 -2.20 0.70 -1.17 1.08 1.38 -1.14 0.64 0.46 1.93 3.04 -1.57 1979 -1.38 -0.67 0.78 -1.71 -1.03 1.60 0.83 0.96 1.01 -0.30 0.53 1.00 1980 -0.75 0.05 -0.31 1.29 -1.50 -0.37 -0.42 -2.24 0.66 -1.77 -0.37 0.78 1981 0.37 0.92 -1.19 0.36 0.20 -0.45 0.05 0.39 -1.45 -1.35 -0.38 -0.02 1982 -0.89 1.15 1.15 0.10 -0.53 -1.63 1.15 0.26 1.76 -0.74 1.60 1.78 1983 1.59 -0.53 0.95 -0.85 -0.07 0.99 1.19 1.61 -1.12 0.65 -0.98 0.29 1984 1.66 0.72 -0.37 -0.28 0.54 -0.42 -0.07 1.15 0.17 -0.07 -0.06 0.00 1985 -1.61 -0.49 0.20 0.32 -0.49 -0.80 1.22 -0.48 -0.52 0.90 -0.67 0.22 1986 1.11 -1.00 1.71 -0.59 0.85 1.22 0.12 -1.09 -1.12 1.55 2.29 0.99 1987 -1.15 -0.73 0.14 2.00 0.98 -1.82 0.52 -0.83 -1.22 0.14 0.18 0.32

11
1988 1.02 0.76 -0.17 -1.17 0.63 0.88 -0.35 0.04 -0.99 -1.08 -0.34 0.61 1989 1.17 2.00 1.85 0.28 1.38 -0.27 0.97 0.01 2.05 -0.03 0.16 -1.15 1990 1.04 1.41 1.46 2.00 -1.53 -0.02 0.53 0.97 1.06 0.23 -0.24 0.22 1991 0.86 1.04 -0.20 0.29 0.08 -0.82 -0.49 1.23 0.48 -0.19 0.48 0.46 1992 -0.13 1.07 0.87 1.86 2.63 0.20 0.16 0.85 -0.44 -1.76 1.19 0.47 1993 1.60 0.50 0.67 0.97 -0.78 -0.59 -3.18 0.12 -0.57 -0.71 2.56 1.56 1994 1.04 0.46 1.26 1.14 -0.57 1.52 1.31 0.38 -1.32 -0.97 0.64 2.02 1995 0.93 1.14 1.25 -0.85 -1.49 0.13 -0.22 0.69 0.31 0.19 -1.38 -1.67 1996 -0.12 -0.07 -0.24 -0.17 -1.06 0.56 0.67 1.02 -0.86 -0.33 -0.56 -1.41 1997 -0.49 1.70 1.46 -1.02 -0.28 -1.47 0.34 0.83 0.61 -1.70 -0.90 -0.96 1998 0.39 -0.11 0.87 -0.68 -1.32 -2.72 -0.48 -0.02 -2.00 -0.29 -0.28 0.87 1999 0.77 0.29 0.23 -0.95 0.92 1.12 -0.90 0.39 0.36 0.20 0.65 1.61 2000 0.60 1.70 0.77 -0.03 1.58 -0.03 -1.03 -0.29 -0.21 0.92 -0.92 -0.58 2001 0.25 0.45 -1.26 0.00 -0.02 -0.20 -0.25 -0.07 -0.65 -0.24 0.63 -0.83 2002 0.44 1.10 0.69 1.18 -0.22 0.38 0.62 0.38 -0.70 -2.28 -0.18 -0.94 2003 0.16 0.62 0.32 -0.18 0.01 -0.07 0.13 -0.07 0.01 -1.26 0.86 0.64 2004 -0.29 -0.14 1.02 1.15 0.19 -0.89 1.13 -0.48 0.38 -1.10 0.73 1.21 2005 1.52 -0.06 -1.83 -0.30 -1.25 -0.05 -0.51 0.37 0.63 -0.98 -0.31 -0.44 2006 1.27 -0.51 -1.28 1.24 -1.14 0.84 0.90 -1.73 -1.62 -2.24 0.44 1.34 2007 0.22 -0.47 1.44 0.17 0.66 -1.31 -0.58 -0.14 0.72 0.45 0.58 0.34 2008 0.89 0.73 0.08 -1.07 -1.73 -1.39 -1.27 -1.16 1.02 -0.04 -0.32 -0.28 2009 -0.01 0.06 0.57 -0.20 1.68 -1.21 -2.15 -0.19 1.51 -1.03 -0.02 -1.93 2010 -1.11 -1.98 -0.88 -0.72 -1.49 -0.82 -0.42 -1.22 -0.79 -0.93 -1.62 -1.85 2011 -0.88 0.70 0.61 2.48 -0.06 -1.28 -1.51 -1.35 0.54 0.39 1.36 2.52 2012 1.17 0.42
15
This Winter vs. The Last Two This winter’s AO/NAO pattern was in dramatic contrast with what occurred the previous two winters, when we had the most extreme December jet stream patterns on record in the opposite direction (a strongly negative AO/NAO). These negative AO/NAO conditions suppressed westerly winds over the North Atlantic, allowing Arctic air to spill southward into eastern North America and Western Europe, bringing unusually cold and snowy conditions.
. These negative AO/NAO conditions suppressed westerly winds over the North Atlantic, allowing Arctic air to spill southward into eastern North America and Western Europe, bringing unusually cold and snowy conditions..")
16
Agricultural Implications If the current NAO index is known, one can use the known statistical correlations between the NAO and the expected weather to help forecast the climate conditions and likely weather for the next few months. This knowledge can be used to help plan the best types of crop to grow in a particular season and predict the likelihood that weather-dependent insect pests and plant diseases will need to be treated.

17
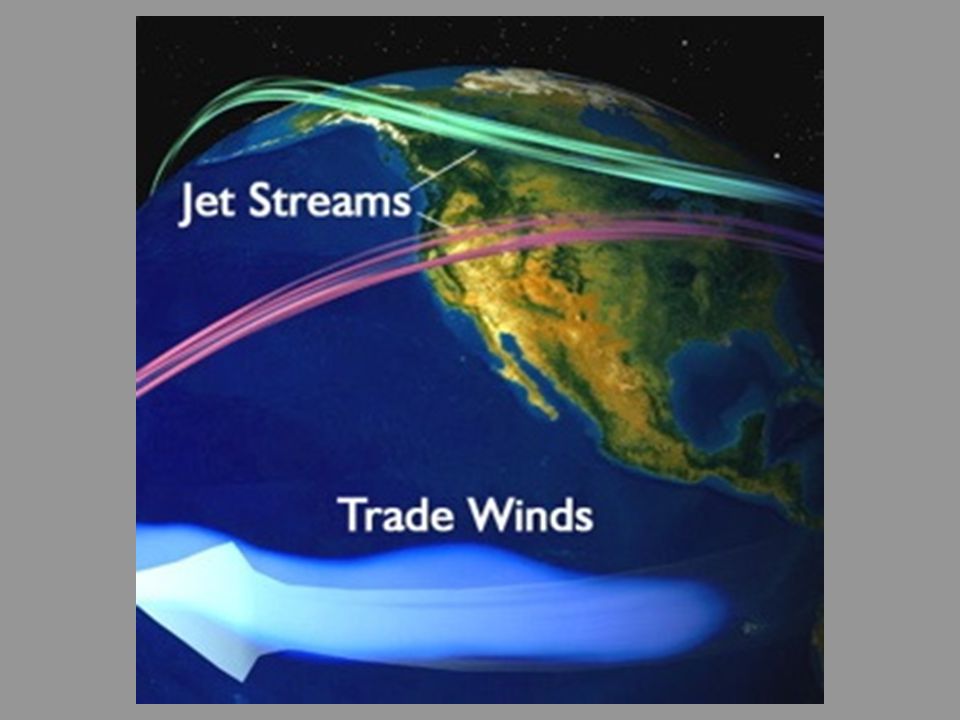
The Jet Stream There are actually two jet streams --Subtropical --Polar Jet streams are strongest between 30 and 60 degrees north

20
Northern vs. Southern Hemisphere Weather in the northern hemisphere is more extreme, especially in terms of temperature. Why? In a large part, this is due to there being more water in the southern hemisphere. Since water heats and cools more slowly, temperatures are less extreme. At about 50 degrees north, Winnipeg’s climate is more extreme than that found at 50 degrees south.

21
El Niño El Niño is characterized by unusually warm ocean temperatures in the Equatorial Pacific. Normally, El Niño winters are mild over western Canada and parts of the northern United States, and wet over the southern United States from Texas to Florida. El Niño is only one of a number of factors that influence weather in temperate climates. El Niño years, therefore, are not always marked by "typical" El Niño conditions.

22
El Niños and La Niñas List of El Niño and La Niña years: http://www.cpc.ncep.noaa.gov/products/analysis_ monitoring/ensostuff/ensoyears.shtmlhttp://www.cpc.ncep.noaa.gov/products/analysis_ monitoring/ensostuff/ensoyears.shtml (next 3 slides) A La Niña does not necessarily follow an El Niño, and an El Niño does not necessarily follow a La Niña, and neither event lasts for a specific amount of time. Either event can be strong, weak, or somewhere in between.

23
YearDJFJFMFMAMAMAMJMJJJJAJASASOSONONDNDJ 1950-1.4-1.3-1.2 -1.1-0.9-0.6-0.5-0.4-0.5 -0.7 1951-0.8-0.6-0.4-0.200.40.611.11.21.10.9 19520.60.40.3 0.1-0.100.2 0.3 19530.50.6 0.7 0.8 0.7 19540.70.50.1-0.3-0.5 -0.6-0.7-0.8-0.7 1955-0.7 -0.8 -0.7-1.4-1.7-1.6 1956-1.1-0.8-0.6-0.5 -0.6-0.5 1957-0.300.40.70.911.11.2 1.31.51.8 19581.81.61.20.90.70.60.50.3 0.40.50.6 19590.6 0.50.30.2-0.1-0.2-0.3-0.100.10 1960-0.1-0.2 -0.1 00.10.2 0.1 19610000.10.30.40.2-0.1-0.3 -0.2-0.1 1962-0.2-0.3 -0.2-0.10 -0.2-0.3-0.4-0.5

24
1963-0.4-0.20.10.20.30.50.81.11.21.31.41.3 19641.10.60.1-0.3-0.6 -0.7-0.8 1965-0.6-0.300.20.50.81.21.41.71.9 1.7 19661.41.10.90.60.40.30.20.10-0.1 -0.2 1967-0.3-0.4-0.5-0.4-0.20.1 -0.1-0.3 -0.4 1968-0.6-0.8-0.7-0.5-0.20.10.40.5 0.60.81 19691.1 10.90.80.60.5 0.80.9 0.8 19700.60.4 0.30.1-0.2-0.5-0.7 -0.8 1971-1.2-1.3-0.8-0.7 -0.8-0.9-0.8 1972-0.6-0.300.30.60.81.11.41.61.92.1 19731.81.20.60-0.5-0.8-1.2-1.3-1.6-1.9-2 1974-1.9-1.6-1.2-0.8-0.7-0.5-0.4 -0.6-0.8-0.7 1975-0.5 -0.6 -0.8-1.1-1.2-1.4-1.5-1.6-1.7 1976-1.5-1.1-0.7-0.5-0.3-0.10.20.40.60.70.8 19770.6 0.3 0.4 0.50.70.8 19780.70.50.1-0.2-0.3 -0.4 -0.3-0.1 1979-0.10.10.20.30.200 0.30.5 0.6 19800.50.40.3 0.4 0.20-0.100 1981-0.4-0.6-0.5-0.4-0.3 -0.4 -0.3-0.2 -0.1 1982-0.100.10.30.50.60.711.51.92.12.2 19832.21.91.51.20.90.60.2-0.2-0.5-0.8-0.9-0.8 1984-0.5-0.3-0.2-0.4-0.5 -0.3-0.2-0.3-0.6-0.9-1.1 1985-0.9-0.7 -0.6-0.5 -0.4 1986-0.5-0.4-0.2 -0.100.30.50.70.91.11.2 19871.21.31.21.111.21.41.6 1.51.31.1

25
19880.70.50.1-0.2-0.7-1.2-1.3-1.2-1.3-1.6-1.9 1989-1.7-1.5-1.1-0.8-0.6-0.4-0.3 -0.2-0.1 19900.10.2 0.3 0.4 19910.30.2 0.30.50.70.80.7 0.81.11.4 19921.61.51.41.210.70.30-0.2-0.3-0.20 19930.20.30.50.6 0.50.30.2 0.1 19940.1 0.20.30.4 0.50.711.2 199510.80.60.30.20-0.1-0.4-0.7-0.8-0.9 1996-0.9-0.8-0.6-0.4-0.3-0.2 -0.3 -0.4-0.5 1997-0.5-0.4-0.10.20.71.21.51.82.12.32.42.3 19982.21.81.40.90.4-0.2-0.7-1.2 -1.4-1.5 1999-1.5-1.3-0.9 -1.1 -1.3-1.5-1.7 2000-1.7-1.5-1.1-0.9-0.8-0.7-0.6-0.5 -0.6-0.8 2001-0.7-0.6-0.5-0.3-0.2-0.100 -0.2 -0.3 2002-0.200.10.30.50.70.8 0.91.21.3 20031.10.80.40-0.2-0.10.20.4 0.3 20040.30.20.1 0.30.50.7 20050.60.40.3 0.20.10-0.2-0.5-0.8 2006-0.9-0.7-0.5-0.300.10.20.30.50.811 20070.70.3-0.1-0.2-0.3 -0.6-0.9-1.1-1.2-1.4 2008-1.5 -1.2-0.9-0.7-0.5-0.3-0.2-0.1-0.2-0.4-0.7 2009-0.9-0.8-0.6-0.20.10.40.50.60.711.41.6 20101.61.41.10.70.2-0.3-0.8-1.2-1.4-1.5 2011-1.4-1.3-0.7-0.4-0.2 -0.3-0.6-0.8 2012-0.9

26
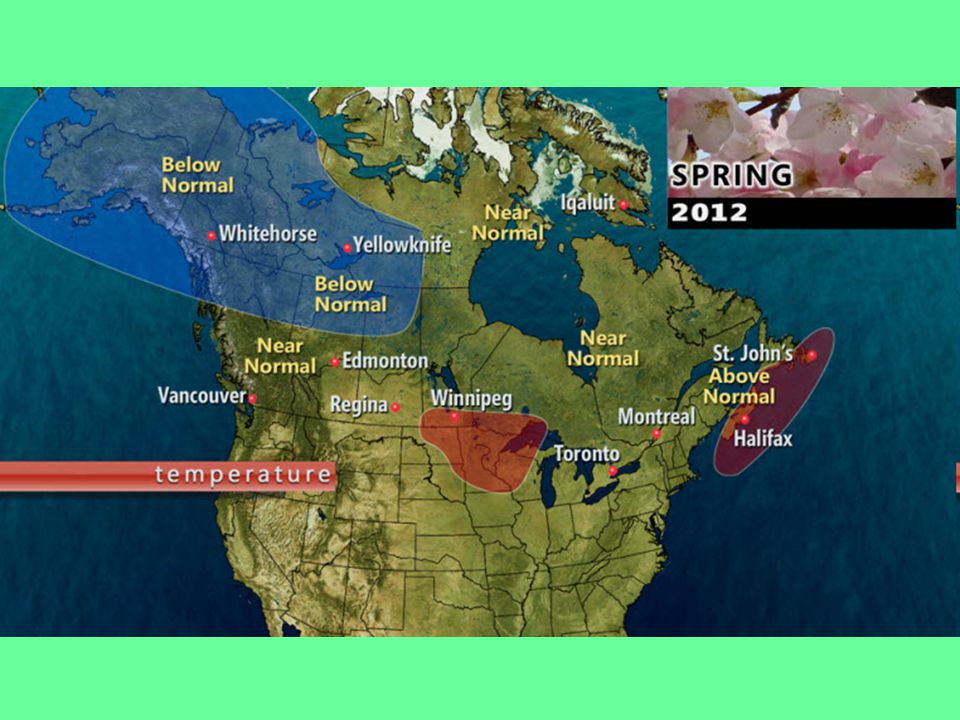
Spring began two days ago…so what’s in store for us this season?

29
Official La Niña and El Niño Forecasts MODEL / GROUP Forecast Start Date 1-3 MONTHS (Mar 2012 to May 2012) 4-6 MONTHS (Jun 2012 to Aug 2012) POAMA POAMA Australian Bureau of Meteorology 1 FebruaryCool/NeutralNeutral CFS CFS NCEP (US) 28 FebruaryNeutral GloSea GloSea UK Met Office 13 FebruaryCool/NeutralNeutral# GEOS-5 GEOS-5 NASA Goddard GMAO (US) 1 FebruaryCool/NeutralNeutral System 4 System 4 ECMWF (EU) 1 FebruaryNeutral JMA/MRI-CGCM JMA/MRI-CGCM Japan Met. Agency 1 FebruaryNeutralNeutral/Warm

30
Spring and Summer 2012

Similar presentations


 Grants Chapter 6.>")