Download presentation
Presentation is loading. Please wait.

1
Industry Profile: Specialty Retail Travis Newton Truett Shaw

2
Who? What? Why? Specialty Retail is a part of the retail sector that is primarily concerned with niche segments, mainly Generation Y (7-24 y/o) Gen Y makes up roughly 25% of the total U.S. Population. (72.9 million) Gen Y-ers are categorized as trend-savvy, sophisticated, fickle, and particular-we know what we want. What the young kids are wearing these days…at least according to the analysts…super short mini skirts, sheer tops, vintage surf, terry cloth, velour, 80s glam and punk,etc…
 Gen Y makes up roughly 25% of the total U.S. Population. (72.9 million) Gen Y-ers are categorized as trend-savvy, sophisticated, fickle, and particular-we know what we want. What the young kids are wearing these days…at least according to the analysts…super short mini skirts, sheer tops, vintage surf, terry cloth, velour, 80s glam and punk,etc….")
3
A Generation Born to Spend In 1995 teens spent an average of $66/week. In 2002 the number went up to $87/week In 2002 teen spending reached nearly $170 billion

4
This Season Specialty retail is cyclical so it is very important to know what is going on NOW with the industry. The buzz has begun to build about the Holiday season, and so far things are looking up. Holiday sales are supposed to grow 5.7% this year to $217 billion! The Good: Cold weather requires a new wardrobe Stores are staying on top of trends Increased consumer optimism and pent up demand The Bad: Spending concerns, job security, energy costs are high, have the child tax credits been spent already?

5
Introduction Shopping Malls Casual Apparel Teenagers/ Young Adults Gap, Limited Seasonal Timing

6
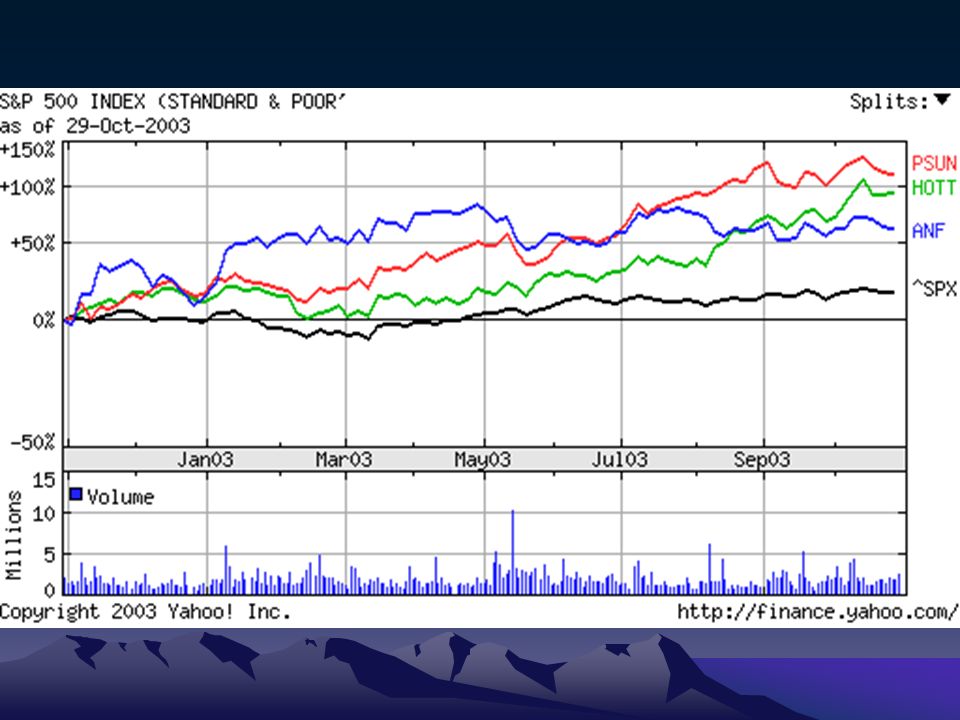
Abercrombie & Fitch Co Symbol: ANF Price: 27.96 Range: 17.55-33.65 602 Stores –Abercrombie & Fitch –abercrombie –Hollister Co.

7
Pacific Sunwear of California Inc Symbol: PSUN Price: 23.30 Range: 10.00-24.22 799 Stores –Pacific Sunwear (619) –PacSun Outlet (73) –d.e.m.o. (107)
.")
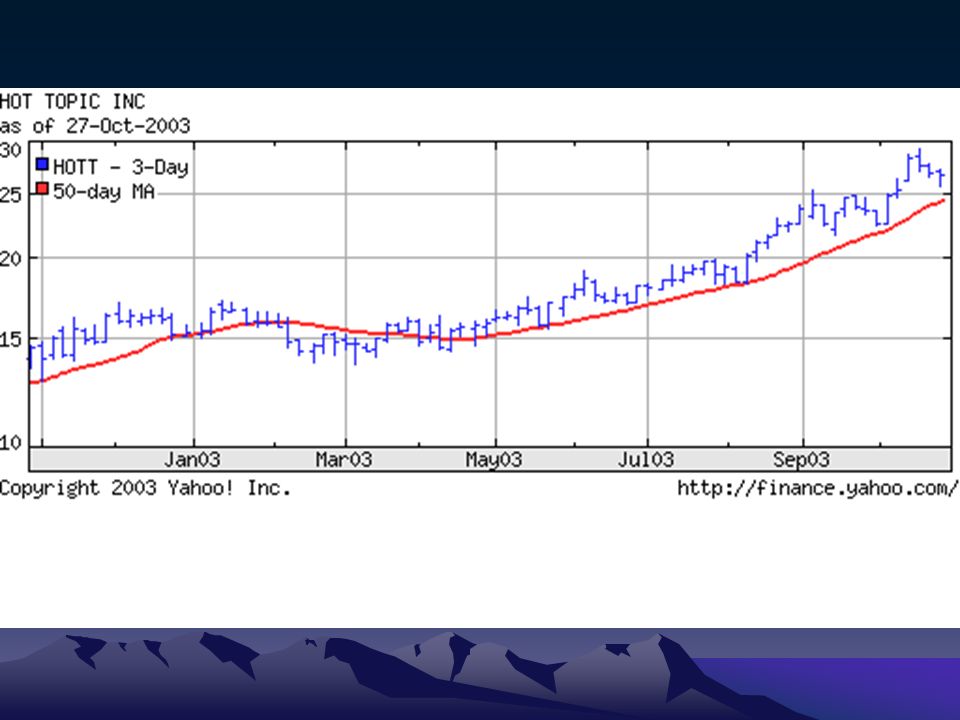
8
Hot Topic, Inc Symbol: HOTT Price: 28.61 Range: 12.79-29.31 505 Stores –Hot Topic (463) –Torrid (42)
 –Torrid (42)")
9
Market Capitalization Stock Price X Total Number of Shares Outstanding ANF: 2.86B PSUN: 1.78B HOTT: 1.33B

10
Average Volume Mean number of shares traded daily ANF: 1.92M PSUN: 1.82M HOTT: 0.91M

11
P/E Ratio Price per share / Earnings per share –Higher = strong growth prospects –Lower = risky firm How much investors will pay for profit ANF: 14.71 PSUN: 28.95 HOTT: 36.91

12
Earnings Per Share (EPS) Net Income / Total Number of Shares Outstanding High correlation with cash flow and stock price ANF: 2.013 PSUN: 0.793 HOTT: 0.760
 Net Income / Total Number of Shares Outstanding High correlation with cash flow and stock price ANF: PSUN: HOTT: 0.760")
13
Price To Sales Ratio Stock Price / (Total Sales / Number of Shares) Amount each dollar of sales is worth to investors ANF: 1.69 PSUN: 1.96 HOTT: 2.85
 Amount each dollar of sales is worth to investors ANF: 1.69 PSUN: 1.96 HOTT: 2.85")
14
EV / EBITDA Enterprise Value / Earnings Before Interest, Taxes, Depreciation, and Amortization Economic Value Of A Company / Operational Cash Flow ANF: 6.45 PSUN: 13.25 HOTT: 16.70

19
Conclusion Happy Halloween Go Gators!

Similar presentations


 Grants Chapter 6.>")
