Download presentation
Presentation is loading. Please wait.

1
Participation of Underrepresented Populations: in Cancer-related Trials Jean G. Ford, M.D. Associate Professor of Epidemiology Johns Hopkins Bloomberg School of Public Health

2
Objectives ■Discuss results of evidence-based review ■Highlight future directions for research

3
Background ■1993 NIH Revitalization Act called for inclusion of women & minorities in all human subjects research ■NCI budget nearly doubled from 1993 to 2002 –Trial accrual increased –Not clear if all populations benefited ■Some populations remain under- represented in NCI-funded clinical trials

4
Key Questions ■What are barriers & promoters for participation of underrepresented populations in cancer trials? ■What effects do healthcare providers have on recruitment of under-represented populations? ■What recruitment strategies are efficacious? ■What measures of recruitment success have been used? ■What methods have been used to study recruitment strategies?

5
Conceptual Framework Ford JG Howerton MW, Powe NR, Bass EB, et al., Cancer. 2008; 112:228-42.

6
Summary of Search

7
Barriers to & Promoters of Enrollment Key Findings from 65 studies

8
Study Characteristics ■Dates published –< 1996: 10 –1996 – 2000: 14 –2001 – 2005: 41 ■Study Design: –Observational/Experimental: 9 –Descriptive (registry reviews, surveys): 33 –Qualitative (focus groups, semi-structured interviews): 24 ■Setting: –Hospital inpatient or outpatient: 43 –Community: 33 –Other: 7
: 33 –Qualitative (focus groups, semi-structured interviews): 24 ■Setting: –Hospital inpatient or outpatient: 43 –Community: 33 –Other: 7")
9
Study Characteristics (II) ■Type of population: –African-American: 35 –Older adults: 19 –Latino/Hispanic: 12 –Asian/Pacific Islander: 6 –Native American / Alaskan Native: 4 –Adolescent: 4 –Rural: 2 ■US-based: 40
 ■Type of population: –African-American: 35 –Older adults: 19 –Latino/Hispanic: 12 –Asian/Pacific Islander: 6 –Native American / Alaskan Native: 4 –Adolescent: 4 –Rural: 2 ■US-based: 40")
10
Barriers to Awareness (N = 18 studies)
")
11
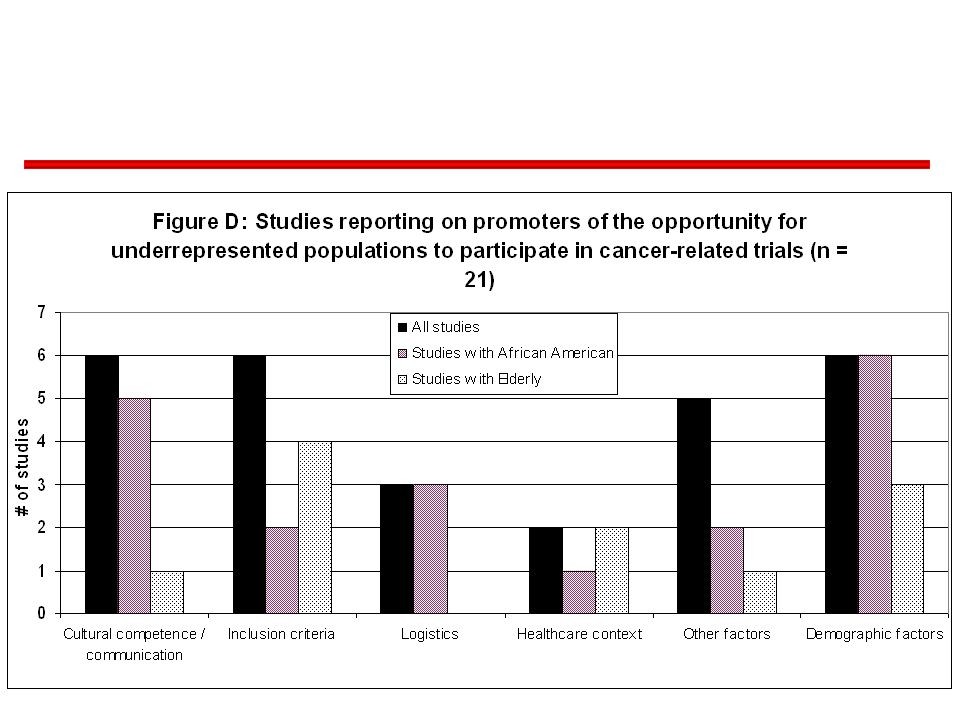
Barriers to Opportunity (N = 34 studies)
")
12
Barriers to Acceptance (N = 36 studies)
")
13
Barriers stastically associated with accrual to cancer trials ■Awareness (n = 3) –Lack of education about clinical trials –Lack of knowledge about origins of cancer ■Opportunity (n = 16) –Sociodemographic characteristics –Lack of health insurance –Exclusion criteria (age, comorbid conditions) –Provider referral –Managed care ■Acceptance (n = 3) –Perceived harm –Loss of control –Nature of intervention –Time commitment –Loss of income –Transportation Ford JG, et al., Cancer. 2008; 112:228-42.

14
Other Key Findings on Barriers & Promoters ■Available evidence mostly about accrual to therapeutic trials ■Barriers to opportunity frequently reported for both prevention & treatment trials ■Limited data on Latinos/Hispanics, Asian/Pacific Islanders, American Indians/Alaska Natives, older adults, & adolescents ■Barriers differed across populations

15
Relation of Barriers & Promoters to Conceptual Framework ■Awareness: – 8 barriers ■Opportunity to participate: – 88 ■Acceptance/refusal of participation: – 44

16
Healthcare Provider Effects Key Findings from 18 studies Howerton MW, et al., Cancer. 2007; 109:465-76.

17
Studies Reporting on Provider Barriers to- and Promoters of Clinical Trial Enrollment

18
Studies Reporting on Provider Attitudes as Barriers to Clinical Trial Enrollment (n=15)
")
19
Studies Reporting on Provider Promoters of Clinical Trial Enrollment (n=7)
")
20
Studies Reporting on Study Design Barriers (n=11)
")
21
Healthcare System Barriers ■Lack of minority investigators/personnel (n=1) ■Lack of dissemination of study opportunities to providers (n=2) ■Lack of cultural competence among providers and/or staff (n=1) ■Lack of access to institutions conducting cancer trial (n=1)
 ■Lack of dissemination of study opportunities to providers (n=2) ■Lack of cultural competence among providers and/or staff (n=1) ■Lack of access to institutions conducting cancer trial (n=1)")
22
Efficacy of Recruitment Strategies Key findings from 7 studies Lai GY, et al. Clinical Trials. 2006; 3: 133-141.

23
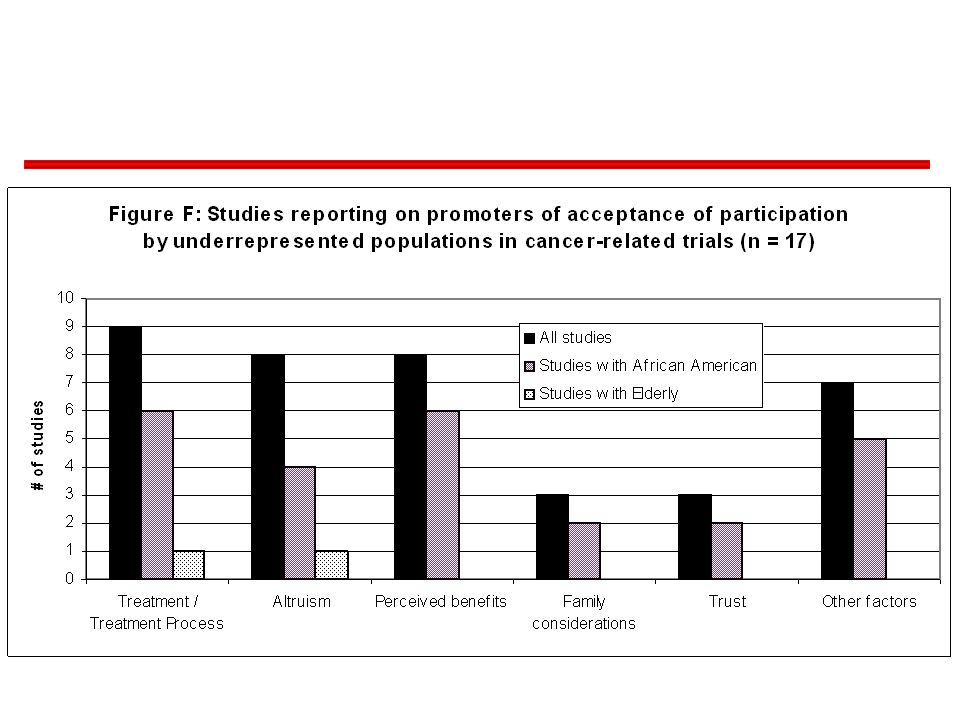
Types of Promoters (I) ■Most frequently reported: –patient incentives (n = 6) –provider incentives (n = 3) –altruism (n = 6) –culturally relevant education about trials (n = 4) ■59 distinct promoters of enrollment into cancer clinical trials –36 therapeutic trials only –14 prevention trials only –17 therapeutic and prevention trials
 ■Most frequently reported: –patient incentives (n = 6) –provider incentives (n = 3) –altruism (n = 6) –culturally relevant education about trials (n = 4) ■59 distinct promoters of enrollment into cancer clinical trials –36 therapeutic trials only –14 prevention trials only –17 therapeutic and prevention trials")
24
Types of Promoters (II) ■Promoters in relation to conceptual framework –6 awareness –29 opportunity –25 acceptance ■Levels at which promoters occur –40 patient level –12 provider level –6 study design level –2 healthcare system level
 ■Promoters in relation to conceptual framework –6 awareness –29 opportunity –25 acceptance ■Levels at which promoters occur –40 patient level –12 provider level –6 study design level –2 healthcare system level")
27
Recruitment Strategies/Interventions Author, Year Target PopulationRecruitment Intervention Moinpour, 2000 African Americans (Sites A-D); Latino/Hispanic (Site E) ■Minority recruiter Linnan, 2002 Workers in a manufacturing company ■Active recruitment arm –Employees signed up to participate ■Passive at worksites –Company provided list of employee names & home phone #s Brewster, 2002 Latina/Hispanic women ■Clinic registry vs. media campaign

28
Recruitment Strategies/Interventions (II) Author, YearTarget Population Recruitment Intervention Ford, 2004African Americans 4 increasingly intensive strategies ■Enhanced mailings ■Minority interviewers ■Letter & phone reminders ■Church-based project sessions Mandelblatt, 2005 Latinas■5-10 minute educational counseling delivered by non-physician study staff + informational brochure ■Informational brochure only
 Author, YearTarget Population Recruitment Intervention Ford, 2004African Americans 4 increasingly intensive strategies ■Enhanced mailings ■Minority interviewers ■Letter & phone reminders ■Church-based project sessions Mandelblatt, 2005 Latinas■5-10 minute educational counseling delivered by non-physician study staff + informational brochure ■Informational brochure only")
29
Recruitment Strategies/Interventions (III) Author, YearTarget PopulationRecruitment Intervention Paskett, 2002Rural physicians in North Carolina & South Carolina ■Tumor-reporting system ■Nurse facilitator ■Quarterly newspapers ■Health educator Kimmick, 2005Older adults CALGB Physicians ■Standard information (control) ■Educational intervention –Educational symposium –Geriatric oncology educational materials –Monthly mailings & e-mails for 1 year –Case discussion seminar
 Author, YearTarget PopulationRecruitment Intervention Paskett, 2002Rural physicians in North Carolina & South Carolina ■Tumor-reporting system ■Nurse facilitator ■Quarterly newspapers ■Health educator Kimmick, 2005Older adults CALGB Physicians ■Standard information (control) ■Educational intervention –Educational symposium –Geriatric oncology educational materials –Monthly mailings & s for 1 year –Case discussion seminar")
30
Results AuthorDescriptor of Point EstimatePoint Estimate Moinpour, 2000 Change in Site A enrollment, 1995-1996 Change in Site B enrollment, 1995-1996 Change in Site C enrollment, 1995-1996 Change in Site D enrollment, 1995-1996 Change in Site E enrollment, 1995-1996 -0.3% -0.5% -1.8% -0.6% 0.5%

31
Results (II) AuthorDescriptor of Point Estimate (p value) Linnan, 2002 Difference in enrollment36.6% (p<0.0001) Brewster, 2002 Odds ratio of women presenting in clinic Odds ratio of women screened by telephone 3.00 (2.38, 3.78) 2.97 (2.52, 3.51) Ford, 2004 Difference in enrollment (Arm C vs. Arm D) 1.0% (p<0.01)
 1.0% (p<0.01).")
32
Results (III) AuthorDescriptor of Point Estimate (p value) Mandelblatt, 2005 Intent to enroll in the STAR trial, intervention vs. control ■77% intent vs. 67% in intervention vs. control groups (P=0.03) Kimmick, 2005 % enrollment of older adults, Intervention % enrollment of older adults, Control ■Baseline: 40% (P=0.40) ■Year 1: 36% (P=0.35) ■Year 2: 31% (P=0.83) ■Baseline: 36% ■Year 1: 32% ■Year 2: 31%
 Kimmick, 2005 % enrollment of older adults, Intervention % enrollment of older adults, Control ■Baseline: 40% (P=0.40) ■Year 1: 36% (P=0.35) ■Year 2: 31% (P=0.83) ■Baseline: 36% ■Year 1: 32% ■Year 2: 31%.")
33
Results (IV) AuthorDescriptor of Point EstimatePoint Estimate Paskett, 2002 Enrollment change of breast cancer patients, 1991-1996 (NC) Enrollment change of colorectal cancer patients, 1991-1996 (NC) Enrollment change of breast cancer patients, 1991-1996 (SC) Enrollment change of colorectal cancer patients, 1991-1996 (SC) -9% 1% 44% -5%
 AuthorDescriptor of Point EstimatePoint Estimate Paskett, 2002 Enrollment change of breast cancer patients, (NC) Enrollment change of colorectal cancer patients, (NC) Enrollment change of breast cancer patients, (SC) Enrollment change of colorectal cancer patients, (SC) -9% 1% 44% -5%")
34
Recruitment Strategies/Interventions UyBico SJ et al., JGIM 2007;22:852–863

35
Limitations of Studies of Efficacy of Recruitment Interventions ■Few studies available ■All published studies focused on accrual to prevention trials ■Limited generalizability ■Intensity needed to modify behavior ■Varying quality of study methods

36
Summary

37
Application of Evidence to Conceptual Framework

38
Overall Summary ■More barriers to opportunity than to awareness or acceptance –More evidence on barriers than on promoters –Mistrust a common theme ■Provider barriers at level of professionals, study design & healthcare system ■Recruitment goals rarely reported a priori

39
Limitations of Evidence ■Heterogeneity –study design –data quality ■Relationship between barriers & promoters unclear ■Overlap between underrepresented populations ■More evidence from therapeutic trials than prevention trials ■Excluded studies other than clinical trials ■Recruitment experience not always reported

40
Conclusions ■In order to improve the knowledge base on accrual of underrepresented populations to clinical trials, hypothesis- driven studies are needed, with adequate power to detect differences. ■The quality of the evidence can be improved by nesting recruitment studies within plans for conducting trials.

41
Principal Investigators: Jean G. Ford, MD Mollie W. Howerton, PhD, MPH Co-Investigators: Tiffany L. Gary, PhD, Gabriel Y. Lai, MHS. Shari Bolen, MD, MPH, Jon Tilburt, MD M. Chris Gibbons, MD, MPH, Charles Baffi, PhD, MPH Renee F. Wilson, MS, Carolyn J. Feuerstein Peter Tanpitukpongse, Neil R. Powe, MD, MPH, MBA Eric B. Bass, MD, MPH The EPC Team

Similar presentations

 Program Maria Madison, Abt Douglas Fuller,>")


 AcademyHealth Meeting, Seattle, June 25, 2006.>")


