Download presentation
Presentation is loading. Please wait.

1
Human Population Dynamics

2
US –310,241,523 (Net gain of 1 person every 11 seconds) World –6,868,672,761 Current Population
 World –6,868,672,761 Current Population")
4
2000 years ago Historical Population Sizes

5
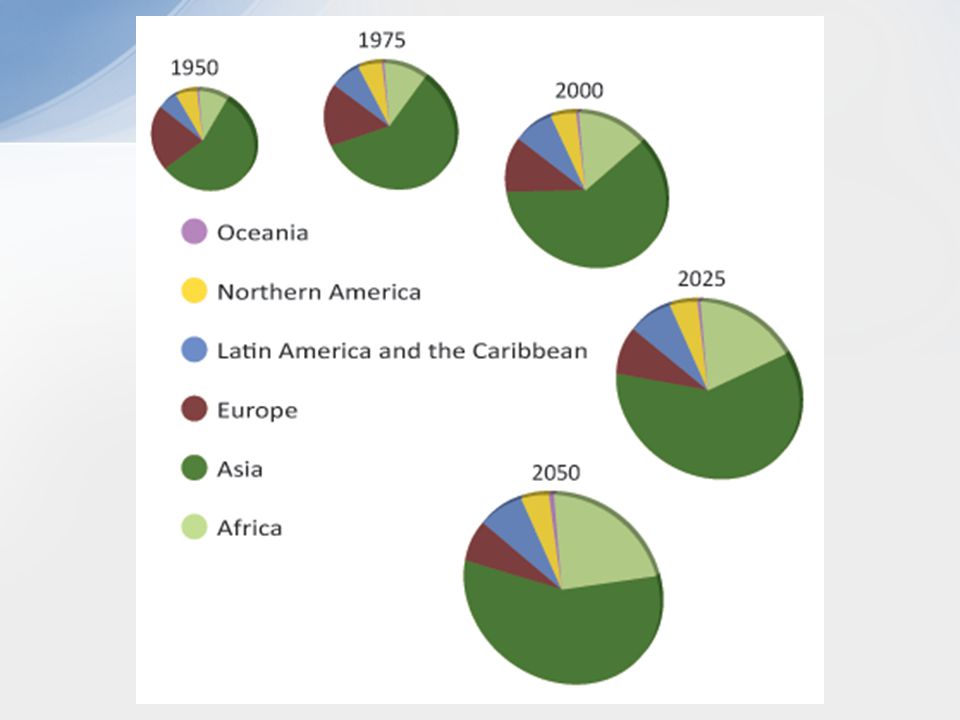
World Population Distribution

6
World Population Density

7
Historical Population Sizes

8
Historical Population Changes 3 surges in population –Tools and fire –Agricultural Revolution –Industrial and Medical Revolution

9
Rapid growth in past ~100 years due to decrease in death rate –Increased nutrition (more food, better distribution) –Improvements in medical technology –Improvements in sanitation and personal hygiene –Safer water supplies Recent Population Changes
 –Improvements in medical technology –Improvements in sanitation and personal hygiene –Safer water supplies Recent Population Changes")
10
Change = (crude birth rate + immigration) – (crude death rate + emigration) % change = (crude birth rate - crude death rate)/10 Current world growth rate = 1.1% –Increase of 76 million per year Population Change
 – (crude death rate + emigration) % change = (crude birth rate - crude death rate)/10 Current world growth rate = 1.1% –Increase of 76 million per year Population Change")
11
High income, highly developed Middle income, moderately developed (upper & lower) Low income, developing Different Worlds
 Low income, developing Different Worlds")
12
Putting it in Perspective

13
Replacement Level Fertility (RLF) –Couple has enough children to replace themselves –RLF = 2.1 required to replace each generation Total Fertility Rate (TFR) –Total number of children a woman will have in her life Fertility Rates
 –Couple has enough children to replace themselves –RLF = 2.1 required to replace each generation Total Fertility Rate (TFR) –Total number of children a woman will have in her life Fertility Rates")
14
CountryTFRDoubling Time (years) World2.854 Developing Countries3.144 Niger7.523 Brazil2.254 Developed Countries1.6700 US2.0117 Germany1.7--- Fertility Rates
 World2.854 Developing Countries3.144 Niger7.523 Brazil2.254 Developed Countries US Germany Fertility Rates")
15
What if TFR < 2.1? –Population decline –Population aging In US, 66% of growth by 2050 from immigrants and their descendants Fertility Rates

16
Growth rate has decreased However, population still increasing - rapidly Growth Rate

17
950 CE to 1600650 years 1600 to 1800200 years 1800 to 1925125 years 1925 to 197550 years 1975 to 202550 years Doubling Time

18
If a population has a growth rate of 2.0%, what is its doubling time? If a population has a doubling time of 14 years, what is its growth rate? Calculating Doubling Time

19
Population Projection

20
Population Profiles

22
Demographic Transition Process occurring during last ~100 years Stabilization of population growth in highly developed nations

23
Factors influencing transition 1. 2. 3. Demographic Transition

24
Phase I –Common Characteristics? –NET RESULT = Countries? –Brazilian tribes?

25
Demographic Transition Phase II –Common Characteristics? –NET RESULT = ex. Nepal, Afghanistan, Sub-Sahara Africa –Niger –Burundi –Tanzania

26
Demographic Transition Phase III –Common Characteristics? –NET RESULT = Ex. China

27
Demographic Transition Phase IV –Common Characteristics? –NET RESULT = Ex: US, England

28
Phase V? –Characteristics? –Consequences? Ex: Japan, Germany Demographic Transition

Similar presentations


 in a given year.>")


