Download presentation
Presentation is loading. Please wait.

1
KRISHNA MURTHY IIT ACADEMY

2
VIDEO LESSONS

3
FUNCTIONS

4
Let X and Y be two nonempty sets of real numbers
Let X and Y be two nonempty sets of real numbers. A function from X into Y is a rule or a correspondence that associates each element of X with a unique element of Y. The set X is called the domain of the function. For each element x in X, the corresponding element y in Y is called the image of x. The set of all images of the elements of the domain is called the range of the function.

5
f x y x y x X Y RANGE DOMAIN

6
Determine which of the following relations represent functions.
Not a function. Function. Function.

7
Not a function. (2,1) and (2,-9) both work.
 and (2,-9) both work.")
8
Find the domain of the following functions:
B)
")
9
Square root is real only for nonnegative numbers.
C) Square root is real only for nonnegative numbers.
 Square root is real only for nonnegative numbers.")
10
Theorem Vertical Line Test
A set of points in the xy - plane is the graph of a function if and only if a vertical line intersects the graph in at most one point.

11
y x Not a function.

12
y x Function.

13
Domain of a function represents the horizontal spread of its graph & the range the vertical spread.
4 (2, 3) (10, 0) (4, 0) (1, 0) x (0, -3) -4
 (10, 0) (4, 0) (1, 0) x. (0, -3) -4.")
14
One-to-One Function On-to Function Inverse Function

15
A function f is said to be one-to-one or injective, if for each x in the domain of f there is exactly one y in the range and no y in the range is the image of more than one x in the domain. A function is not one-to-one if two different elements in the domain correspond to the same element in the range.

16
x1 y1 x1 y1 x2 y2 x2 x3 y3 x3 y3 One-to-one & on-to function
Domain Co domain x1 x2 x3 y1 y3 Domain Co domain One-to-one & on-to function NOT One-to-one but on to function One-one but not on to function Domain Co domain

17
ON-TO or Surjective function
A function f is said to be on to if every element of the co-domain is the image of some element of the domain. That is for all y in co-domain, there exist x in domain such that y = f(x). ON-TO ness depends on co-domain
. ON-TO ness depends on co-domain.")
18
BIJECTIVE FUNCTION A function is said to be objective
if it is both one-one and on-to x1 x2 x3 y1 y2 y3 Domain Co domain

19
Use the graph to determine whether the function
is one-to-one. Horizontal line Cuts the graph in more than one point. Not one-to-one.

20
Use the graph to determine whether the function is one-to-one.

21
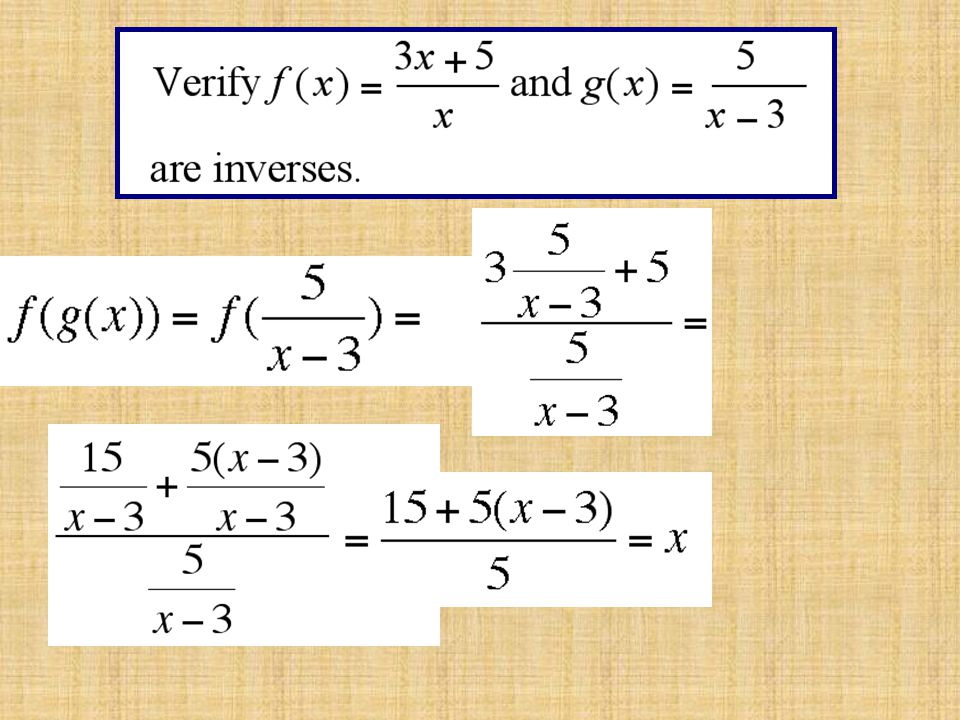
Let f denote a one-to-one function y = f(x)
Let f denote a one-to-one function y = f(x). The inverse of f, denoted by f -1 , is a function such that f -1(f( x )) = x for every x in the domain of f and f(f -1(x))=x for every x in the domain of f -1. .
. The inverse of f, denoted by f -1 , is a function such that f -1(f( x )) = x for every x in the domain of f and f(f -1(x))=x for every x in the domain of f")
22
Domain of f Range of f

23
Theorem The graph of a function f and the graph of its inverse are symmetric with respect to the line y = x.

24
y = x (0, 2) (2, 0)
 (2, 0)")
25
The function is one-to-one.
Find the inverse of The function is one-to-one. Interchange variables. Solve for y.

26
Check.

29
Even and Odd Functions Even functions are functions for which the left half of the plane looks like the mirror image of the right half of the plane. Odd functions are functions where the left half of the plane looks like the mirror image of the right half of the plane, only upside-down. Mathematically, we say that a function f(x) is even if f(x) = f(-x) and is odd if f(-x) = -f(x).
 is even if f(x) = f(-x) and is odd if f(-x) = -f(x).")
30
Some Examples even functions odd functions f(x) = |x| f(x) = 1/x
 = |x| f(x) = 1/x.")
31
f(x) = x2 ,Even f(x) = x3 , Odd
 = x2 ,Even f(x) = x3 , Odd")
32
y = cosx, Even y = sinx, Odd

33
Is there a function which is both even as well as odd?

34
Yes there is Only one function which is both even as well as odd

35
The function is y = f(x) = 0
Let y = f(x) be one such function Then, f(-x) = f(x) and f(-x) = -f(x) So, f(x) = -f(x) f(x) = 0
 be one such function. Then, f(-x) = f(x) and f(-x) = -f(x) So, f(x) = -f(x) f(x) = 0.")
36
PERIODIC FUNCTIONS

37
A function f is periodic if there exists some number p>0 such that
Periodic functions are functions that repeat over and over, or cycle on a specific period. This is expressed mathematically that A function f is periodic if there exists some number p>0 such that f(x) = f(x+p) for all possible values of x The least possible value of p is called the fundamental period of the function.
 = f(x+p) for all possible values of x. The least possible value of p is called the fundamental period of the function.")
38
f(x) = sinx, is a periodic func with fundamental period 2π
f(x) = cosx, is also a periodic func with fundamental period 2π
 = cosx, is also a periodic func with fundamental period 2π.")
39
are periodic functions with fundamental period π
y = tanx & y = cotx are periodic functions with fundamental period π Graph of y = tanx

40
A property of some periodic functions that cycle within some definite range is that they have an amplitude in addition to a period. The amplitude of a periodic function is the distance between the highest point and the lowest point, divided by two. For example, sin(x) and cos(x) have amplitudes of 1.
 and cos(x) have amplitudes of 1..")
41
A.f(x) + B.g(x),where A and B are real numbers is
COMBINATIONS OF PERIODIC FUNCTIONS There are no hard and rigid rules for finding the periods of functions which are the combinations of periodic functions but the following technique may work in many cases. If the period of f(x) is (a/b)π and that of g(x) is (c/d)π ,then the period of A.f(x) + B.g(x),where A and B are real numbers is (LCM of a,c)/(HCF of b,d) times π
 is (a/b)π and that of g(x) is (c/d)π ,then the period of. A.f(x) + B.g(x),where A and B are real numbers is. (LCM of a,c)/(HCF of b,d) times π.")
42
For example, find the period of
y = sin7x + tan(5/3)x. Period of sin7x is 2π/7 and that of tan(5/3)x is 3π/5. Hence the period of the given function is (LCM of 2,3)/(HCF of 7,5) times π that is 6 π
x. Period of sin7x is 2π/7. and that of tan(5/3)x is 3π/5. Hence the period of. the given function is. (LCM of 2,3)/(HCF of 7,5) times π. that is 6 π.")
43
If the period of f(x) is p then that of a.f(x) + b is
also p and that of f(ax+b) is p/|a| For e.g, period of sin(4-3x) is 2π/3
 is p/|a| For e.g, period of sin(4-3x) is 2π/3.")
44
If f(x) is periodic and g(x) is non periodic then
f{g(x)} is not periodic except when g(x) is linear. For e.g, y = sin(4-3x2) is not periodic
} is not periodic except when g(x) is linear. For e.g, y = sin(4-3x2) is not periodic.")
45
A constant function is periodic but has no fundamental period.
y = x – [x] is a periodic function whose fundamental period is 1

46
Increasing & Decreasing Functions
BEHAVIOR OF FUNCTIONS By behavior of a function, we mean, its Increasing & Decreasing nature Increasing & Decreasing Functions

47
x1 < x2 implies f(x1) ≤ f(x2)
A function f(x) is said to be increasing in an interval, if for any x1, x2 belonging to this interval, x1 < x2 implies f(x1) ≤ f(x2) OR x1 >x2 implies f(x1) ≥ f(x2) That is, if x increases then f(x) should increase and if x decreases then f(x) should decrease. The function is said to be strictly increasing if x1 < x2 implies f(x1) < f(x2) x1 >x2 implies f(x1) > f(x2)
 is said to be increasing in an interval, if for any x1, x2 belonging to this interval, x1 < x2 implies f(x1) ≤ f(x2) OR. x1 >x2 implies f(x1) ≥ f(x2) That is, if x increases then f(x) should increase and if x decreases then f(x) should decrease. The function is said to be strictly increasing if. x1 < x2 implies f(x1) < f(x2) x1 >x2 implies f(x1) > f(x2)")
49
The function y = 3x is strictly increasing

50
x1 < x2 implies f(x1) ≥ f(x2)
A function f(x) is said to be DECREASING in an interval, if for any x1, x2 belonging to this interval, x1 < x2 implies f(x1) ≥ f(x2) OR x1 > x2 implies f(x1) ≤ f(x2) That is, if x increases then f(x) should decrease and if x decreases then f(x) should increase. The function is said to be strictly decreasing if x1 < x2 implies f(x1) > f(x2) x1 >x2 implies f(x1) < f(x2)
 is said to be DECREASING in an interval, if for any x1, x2 belonging to this interval, x1 < x2 implies f(x1) ≥ f(x2) OR. x1 > x2 implies f(x1) ≤ f(x2) That is, if x increases then f(x) should decrease and if x decreases then f(x) should increase. The function is said to be strictly decreasing if. x1 < x2 implies f(x1) > f(x2) x1 >x2 implies f(x1) < f(x2)")
51
The function y = tanx is strictly increasing .
The function y = -[x] is decreasing but not strictly decreasing DRAW THE GRAPH and verify.

52
MONOTONIC FUNCTION A function is said to be MONOTONIC in an interval if it either increases or decrease in that interval but does not change its behavior.

53
increasing in its domain
The function y = tanx is monotonically increasing in its domain

54
The graph of y = cos x This function is NOT MONOTONIC

55
Library of Functions, Piecewise-Defined Functions

56
f(x)=mx+b A linear function is a function of the form
The graph of a linear function is a line with a slope m and y-intercept b. (0,b)
")
57
A constant function is a function of the form
f(x)=b y b x
=b. y. b. x.")
58
Identity function is a function of a form:
f(x)=x (1,1) (0,0)
=x. (1,1) (0,0)")
59
The square function

60
Cube Function

61
Square Root Function

62
Reciprocal Function

63
Absolute Value Function
f(x) = |x|
 = |x|")
64
When functions are defined by more than one equation, they are called piece-wise defined functions.

65
For the following function
a) Find f(-1), f(1), f(3). b) Find the domain. c)Sketch the graph.
 Find f(-1), f(1), f(3). b) Find the domain. c)Sketch the graph.")
66
a) f(-1) = = 2 f(1) = 3 f(3) = = 0 b)
 f(-1) = = 2 f(1) = 3 f(3) = = 0 b)")
67
c)
")
68
Polynomial Functions and Models

69
A polynomial function is a function of the form

70
Determine which of the following are polynomials
Determine which of the following are polynomials. For those that are, state the degree. (a) f ( x ) 3 x 2 4 x 5 = - + Polynomial. Degree 2. (b) Not a polynomial. (c) Not a polynomial.
 f. ( x. ) 3. x x. 5. = - + Polynomial. Degree 2. (b) Not a polynomial. (c) Not a polynomial.")
71
If f is a polynomial function and r is a real number for which f(r)=0, then r is called a (real) zero of f, or root of f(x) = 0. If r is a (real) zero of f, then (a) r is an x-intercept of the graph of f. (b) (x - r) is a factor of f.
 r is an x-intercept of the graph of f. (b) (x - r) is a factor of f.")
72
Use the above to conclude that x = -1 and x = 4 are the real roots (zeroes) of f.
 of f.")
73
1 is a zero of multiplicity 2.

74
. If r is a Zero of Even Multiplicity
If r is a Zero of Odd Multiplicity .

75
Theorem If f is a polynomial function of degree n, then f has at most n-1 turning points.

76
Theorem For large values of x, either positive or negative, the graph of the polynomial resembles the graph of the power function.

77
For the polynomial (a) Find the x- and y-intercepts of the graph of f.
(b) Determine whether the graph crosses or touches the x-axis at each x-intercept. (c) Find the power function that the graph of f resembles for large values of x. (d) Determine the maximum number of turning points on the graph of f.
 Determine whether the graph crosses or touches the x-axis at each x-intercept. (c) Find the power function that the graph of f resembles for large values of x. (d) Determine the maximum number of turning points on the graph of f.")
78
For the polynomial (e) Use the x-intercepts and test numbers to find the intervals on which the graph of f is above the x-axis and the intervals on which the graph is below the x-axis. (f) Put all the information together, and connect the points with a smooth, continuous curve to obtain the graph of f.
 Use the x-intercepts and test numbers to find the intervals on which the graph of f is above the x-axis and the intervals on which the graph is below the x-axis. (f) Put all the information together, and connect the points with a smooth, continuous curve to obtain the graph of f.")
79
(b) -4 is a zero of multiplicity 1. (crosses)
(a) The x-intercepts are -1, 5 and -4. y-intercept: (b) -4 is a zero of multiplicity 1. (crosses) -1 is a zero of multiplicity 2. (touches) 5 is a zero of multiplicity 1. (crosses) (d) At most 3 turning points.
 The x-intercepts are -1, 5 and -4. y-intercept: (b) -4 is a zero of multiplicity 1. (crosses) -1 is a zero of multiplicity 2. (touches) 5 is a zero of multiplicity 1. (crosses) (d) At most 3 turning points.")
80
Test number: f (-5) Graph of f: Above x-axis Point on graph: (-5, 160)
 .")
81
Graph of f: Below x-axis
Test number: f (-2) = -14 Graph of f: Below x-axis Point on graph: (-2, -14)
 = -14. Graph of f: Below x-axis. Point on graph: (-2, -14)")
82
Graph of f: Below x-axis
Test number: f (0) = -20 Graph of f: Below x-axis Point on graph: (0, -20)
 = -20. Graph of f: Below x-axis. Point on graph: (0, -20)")
83
Test number: f (6) = 490 Graph of f: Above x-axis Point on graph: (6, 490)
 = 490 Graph of f: Above x-axis Point on graph: (6, 490)")
84
(6, 490) (-1, 0) (-5, 160) (0, -20) (5, 0) (-4, 0) (-2, -14)
 (-1, 0) (-5, 160) (0, -20) (5, 0) (-4, 0) (-2, -14)")
85
Quadratic Functions

86
A quadratic function is a function of the form:

87
Properties of the Graph of a Quadratic Function
Parabola opens up if a > 0; the vertex is a minimum point. Parabola opens down if a < 0; the vertex is a maximum point.

88
Graphs of a quadratic function f(x) = ax2 + bx + c
Opens down Vertex is highest point Axis of symmetry a < 0 Axis of symmetry a > 0 Opens up Vertex is lowest point

89
Steps for Graphing a Quadratic Function by Hand
Determine the vertex. Determine the axis of symmetry. Determine the y-intercept, f(0). Determine how many x-intercepts the graph has. If there are no x-intercepts determine another point from the y-intercept using the axis of symmetry. Graph.
. Determine how many x-intercepts the graph has. If there are no x-intercepts determine another point from the y-intercept using the axis of symmetry. Graph.")
90
Since -3 < 0 the parabola opens down.
Without graphing, locate the vertex and find the axis of symmetry of the following parabola. Does it open up or down? Vertex: Since -3 < 0 the parabola opens down.

91
Finding the vertex by completing the square:
= a(x - h)2 + k; vertex: (2, 13)
2 + k; vertex: (2, 13)")
92
(2,4) (0,0)
 (0,0)")
93
(0,0) (2, -12)
 (2, -12)")
94
(2, 0) (4, -12)
 (4, -12)")
95
Vertex (2, 8) (4,-4) f(x) = -3( x - 2 )2 + 8
 (4,-4) f(x) = -3( x - 2 )2 + 8")
96
Determine whether the graph opens up or down.
Find its vertex, axis of symmetry, y-intercept, x-intercept. x-coordinate of vertex: y-coordinate of vertex: Axis of symmetry:

97
There are two x-intercepts:

98
(0, 5) (-5.55, 0) (-0.45, 0) Vertex: (-3, -13)
 (-5.55, 0) (-0.45, 0) Vertex: (-3, -13)")
99
Quadratic Models

100
A farmer has 3000 yards of fence to enclose a rectangular field
A farmer has 3000 yards of fence to enclose a rectangular field. What are the dimensions of the rectangle that encloses the most area? w x The available fence represents the perimeter of the rectangle. If x is the length and w the width , then 2x + 2w = 3000

101
The area of a rectangle is represented by
A = xw Let us express one of the variables from the perimeter equation. 2x + 2w = 3000 x = (3000-2w)/2 x = w Substitute this into the area equation and maximize for w. A = (1500-w)w = -w w The equation represents a parabola that opens down, so it has a maximum at its vertex point.
/2. x = w. Substitute this into the area equation and maximize for w. A = (1500-w)w = -w w. The equation represents a parabola that opens down, so it has a maximum at its vertex point.")
102
The vertex is w = -1500/(-2) = 750. Thus the width should be 750 yards and the length is then x = = 750 The largest area field is the one with equal sides of length 750 yards and total area: A = 7502=562,500 sq.y.

103
A projectile is fired from a cliff 400 feet above the water at an inclination of 45o to the horizontal, with a given muzzle velocity of 350ft per second. The height of the projectile above water is given by the equation below where x represents the horizontal distance of the projectile from the base of the cliff. Find the maximum height of the projectile.

104
To find the maximum height we need to find the coordinates of the vertex of the parabola that is represented by the above equation.

105
The maximum height is feet and the projectile reaches it at feet from the base of the cliff.

106
Vertex ( , ) (0,400)
 (0,400)")
107
Rational Functions I

108
A rational function is a function of the form
Where p and q are polynomial functions and q is not the zero polynomial. The domain consists of all real numbers except those for which the denominator is 0.

109
All real numbers except -6 and-2.
Find the domain of the following rational functions: All real numbers except -6 and-2. All real numbers except -4 and 4. All real numbers.

111
y Horizontal Asymptotes y = R(x) y = L x y y = L x y = R(x)
 y = L x y y = L x y = R(x)")
112
Vertical Asymptotes x = c y x x = c y x

113
If an asymptote is neither horizontal nor vertical it is called oblique.
x

114
Theorem Locating Vertical Asymptotes
A rational function in lowest terms, will have a vertical asymptote x = r, if x - r is a factor of the denominator q.

115
Vertical asymptotes: x = -1 and x = 1
Find the vertical asymptotes, if any, of the graph of each rational function. Vertical asymptotes: x = -1 and x = 1 No vertical asymptotes Vertical asymptote: x = -4

116
Consider the rational function
1. If n < m, then y = 0 is a horizontal asymptote of the graph of R. 2. If n = m, then y = an / bm is a horizontal asymptote of the graph of R. 3. If n = m + 1, then y = ax + b is an oblique asymptote of the graph of R. Found using long division. 4. If n > m + 1, the graph of R has neither a horizontal nor oblique asymptote. End behavior found using long division.

117
Find the horizontal and oblique asymptotes if any, of the graph of
Horizontal asymptote: y = 0 Horizontal asymptote: y = 2/3

118
Oblique asymptote: y = x + 6

119
Rational Functions II: Analyzing Graphs

120
Analyzing the Graph of a Rational Function
Find the domain of the rational function R. Write R in the lowest terms. Locate the x and y intercepts. Test for symmetry. Locate vertical asymptotes. Locate horizontal and oblique asymptotes. Graph R.

121
Analyze the graph of:

122
In lowest terms: x-intercept: -1 y-intercept: No symmetry

123
Vertical asymptote: x = -3
Hole: (3, 4/3) Horizontal asymptote: y = 2
 Horizontal asymptote: y = 2.")
124
1 -4 -2 R(1) = 1 R(-4) = 6 R(-2) = -2 Above x-axis Above x-axis Below x-axis (-4, 6) (-2, -2) (1, 1)
 (1, 1)")
125
x = - 3 (-4, 6) (1, 1) (3, 4/3) y = 2 (-2, -2) (-1, 0) (0, 2/3)
 (1, 1) (3, 4/3) y = 2 (-2, -2) (-1, 0) (0, 2/3)")
126
Exponential Functions

127
An exponential function is a function of the form
where a is a positive real number (a > 0) and The domain of f is the set of all real numbers.
 and . The domain of f is the set of all real numbers.")
128
(1, 6) (1, 3) (-1, 1/6) (-1, 1/3) (0, 1)
 (1, 3) (-1, 1/6) (-1, 1/3) (0, 1)")
129
Summary of the characteristics of the graph of
The domain is all real numbers. Range is set of positive numbers. No x-intercepts; y-intercept is 1. The x-axis (y=0) is a horizontal asymptote as a>1, is an increasing function and is one-to-one. The graph contains the points (0,1); (1,a), and (-1, 1/a). The graph is smooth continuous with no corners or gaps.
 is a horizontal asymptote as. a>1, is an increasing function and is one-to-one. The graph contains the points (0,1); (1,a), and (-1, 1/a). The graph is smooth continuous with no corners or gaps.")
130
(-1, 6) (-1, 3) (0, 1) (1, 1/3) (1, 1/6)
 (-1, 3) (0, 1) (1, 1/3) (1, 1/6)")
131
Summary of the characteristics of the graph of
The domain is all real numbers. Range is set of positive numbers. No x-intercepts; y-intercept is 1. The x-axis (y=0) is a horizontal asymptote as 0<a<1, is a decreasing function and is one-to-one. The graph contains the points (0,1); (1,a), and (-1, 1/a). The graph is smooth continuous with no corners or gaps.
 is a horizontal asymptote as. 0<a<1, is a decreasing function and is one-to-one. The graph contains the points (0,1); (1,a), and (-1, 1/a). The graph is smooth continuous with no corners or gaps.")
133
(1, 3) (0, 1)
 (0, 1)")
134
(-1, 3) (0, 1)
 (0, 1)")
135
(-1, 5) (0, 3) y = 2
 (0, 3) y = 2")
136
Domain: All real numbers
Range: { y | y >2 } or Horizontal Asymptote: y = 2

137
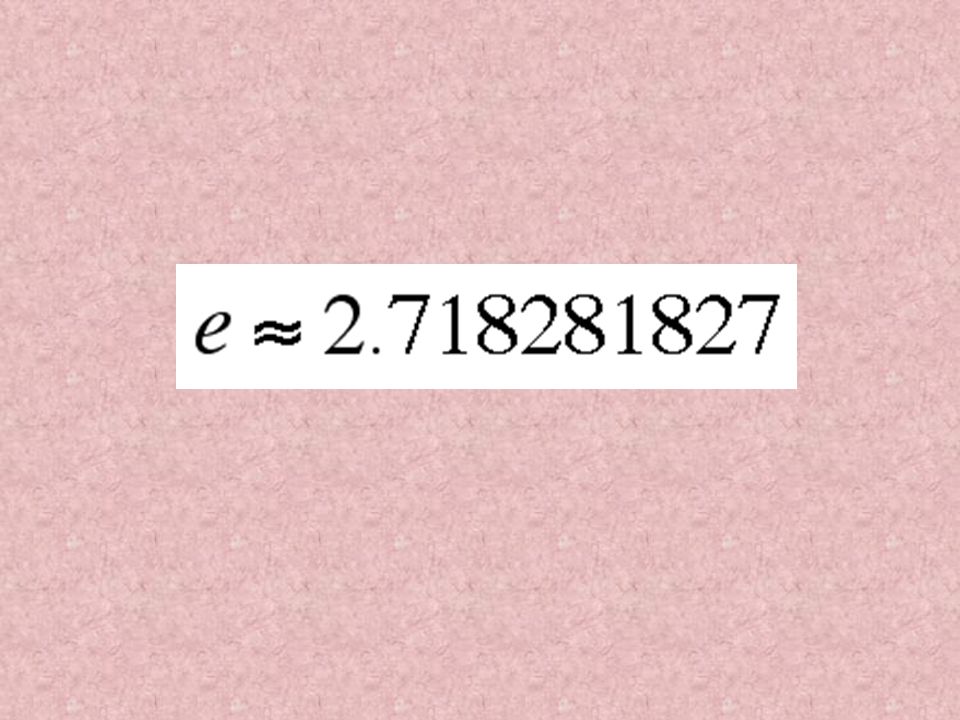
The number e is defined as the number that the expression
In calculus this expression is expressed using limit notation as

140
Exponential Equations

141
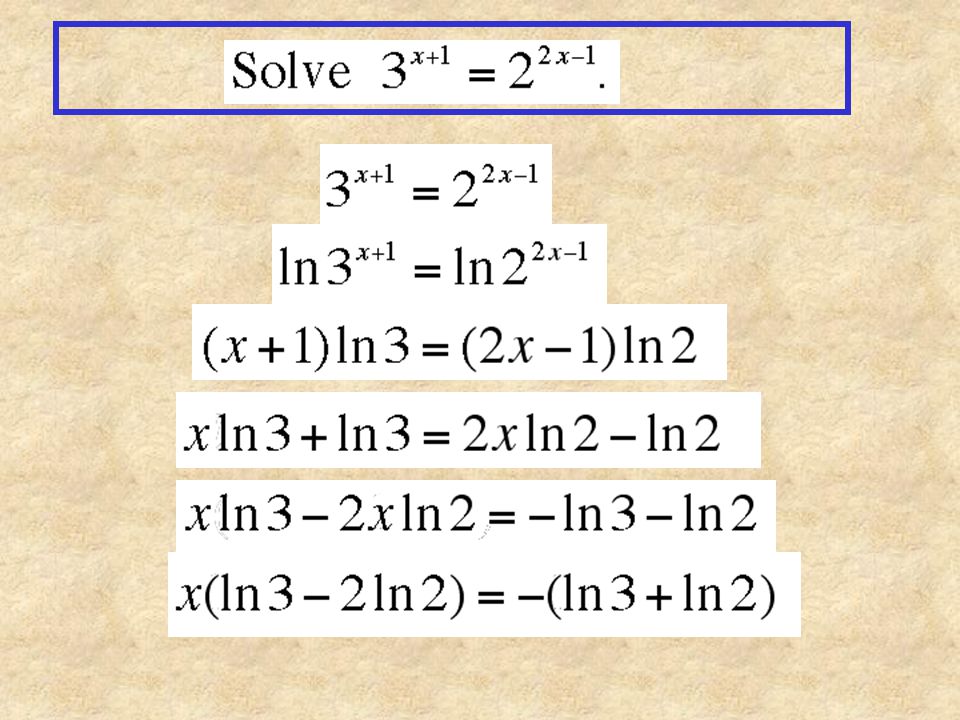
Solve:

142
Logarithmic Functions

144
Change exponential expression into an equivalent logarithmic expression.
Change logarithmic expression into an equivalent exponential expression.

145
Range of Logarithmic and Exponential Functions
Domain of logarithmic function = Range of exponential function = Range of logarithmic function = Domain of exponential function =

146
y = x (0, 1) (1, 0) a < 1
 (1, 0) a < 1")
147
y = x (0, 1) (1, 0) a > 1
 (1, 0) a > 1")
148
1. The x-intercept of the graph is 1. There is no y-intercept.
Properties of the Graph of a Logarithmic Function 1. The x-intercept of the graph is 1. There is no y-intercept. 2. The y-axis is a vertical asymptote of the graph. 3. A logarithmic function is decreasing if < a < 1 and increasing if a > 1. 4. The graph is smooth and continuous, with no corners or gaps.

149
The Natural Logarithm

151
(e, 1) (1, 0)
 (1, 0)")
152
x = 3 (e + 3, 1) (4, 0)
 (4, 0)")
154
The Common Logarithmic Function
(base=10)
")
155
Logarithmic Equations

156
Logarithmic and Exponential Equations

158
Check your answer!

159
Both terms are undefined.
Check x = 3. Solution set {x | x = 3}.

161
Equation of Quadratic Type

162
3 x = -10 3 x = 1 = 3 0 No solution. Solution x = 0.
Solution set {x | x =0}.

164
x

165
x =

166
[STEP FUNCTION]
![[STEP FUNCTION]](http://slideplayer.com/slide/2330227/8/images/166/%5BSTEP+FUNCTION%5D.jpg "[STEP FUNCTION]")
167
The greatest integer function (or floor function or step function) will round any number down to the nearest integer. It is the greatest integer less than or equal to x and is denoted by [x]. For example, [2.001] =2, [2.998] = 2 and [-2.567] = -3

168
The domain of y = [x] is R and range is Z
Graph of y = [x]
![The domain of y = [x] is R and range is Z](http://slideplayer.com/slide/2330227/8/images/168/The+domain+of+y+%3D+%5Bx%5D+is+R+and+range+is+Z.jpg "Graph of y = [x]")
169
Polynomial and Rational Inequalities

170
Steps for Solving Polynomial and Rational Inequalities Algebraically
Write the inequality in one of the following forms: where f(x) is written as a single quotient. Determine the numbers at which f(x) equals zero and also those numbers at which it is undefined.
 is written as a single quotient. Determine the numbers at which f(x) equals zero and also those numbers at which it is undefined.")
171
Use these numbers to separate the real line into intervals.
Select a test number from each interval and evaluate f at the test number. If the value of f is positive, then f(x)> 0 for all numbers x in the interval. If the value of f is negative, then f(x)<0 for all numbers x in the interval. If the inequality is not strict, include the solutions of f(x)=0 in the solution set, but do not include those where f is undefined.
> 0 for all numbers x in the interval. If the value of f is negative, then f(x)<0 for all numbers x in the interval. If the inequality is not strict, include the solutions of f(x)=0 in the solution set, but do not include those where f is undefined.")
172
Undefined for Solve the inequality:
The inequality is in lowest terms, so we will first find where f(x)=0. And where is it undefined. Undefined for x=-2
=0. And where is it undefined. Undefined for. x=-2.")
173
The real line is split into:

174
The solution is all numbers x for which
Pick x = - 3 Pick x = 0 Pick x = 2 Pick x = -3/2 f(-3) = -8 f(-3/2) = 5/2 f(0) = -1/2 f(2) = 3/4 POSITIVE NEGATIVE POSITIVE NEGATIVE The solution is all numbers x for which or
 = -8. f(-3/2) = 5/2. f(0) = -1/2. f(2) = 3/4. POSITIVE. NEGATIVE. POSITIVE. NEGATIVE. The solution is all numbers x for which. or.")
175
Operations on Functions

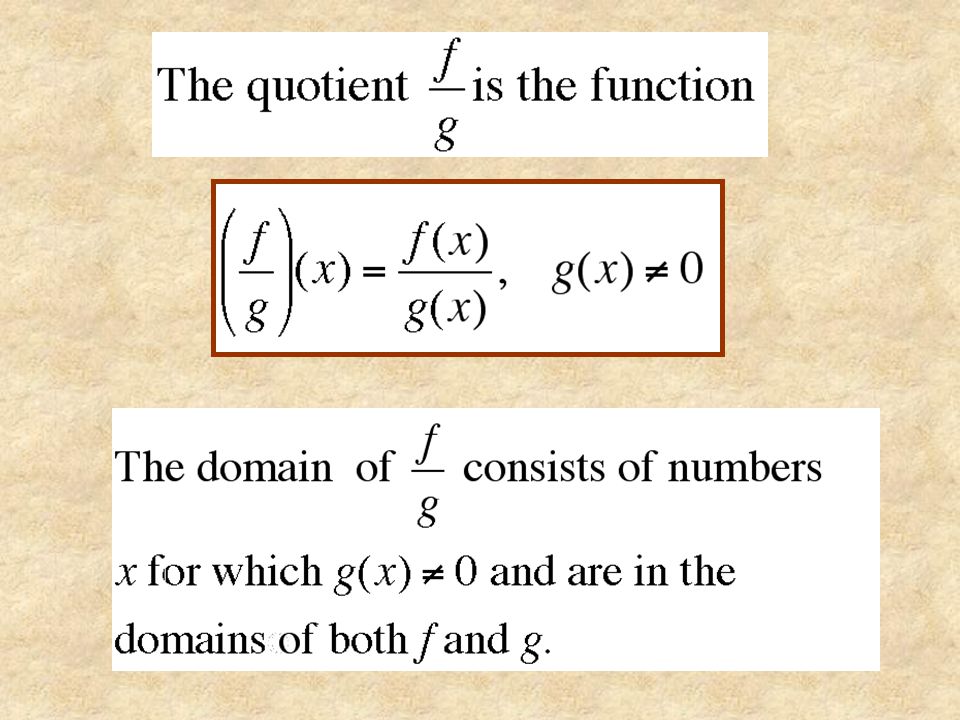
176
The sum f + g is the function defined by
(f + g)(x) = f(x) + g(x) The domain of f+g consists of numbers x that are in the domain of both f and g.
(x) = f(x) + g(x) The domain of f+g consists of numbers x that are in the domain of both f and g.")
177
The difference f - g is the function defined by
(f - g)(x) = f(x) - g(x) The domain of f - g consists of numbers x that are in the domain of both f and g.
(x) = f(x) - g(x) The domain of f - g consists of numbers x that are in the domain of both f and g.")
178
The product f *g is the function defined by
(f * g)(x) = f(x) * g(x) The domain of f *g consists of numbers x that are in the domain of both f and g.
(x) = f(x) * g(x) The domain of f *g consists of numbers x that are in the domain of both f and g.")
180
Given two functions f and g, the composite function is defined by

181
Domain of g Range of g Range of f x g(x) Domain of f g(x) x f(g(x)) g f Range of f(g) f(g)
 Domain of f g(x) x f(g(x)) g f Range of f(g) f(g)")
182
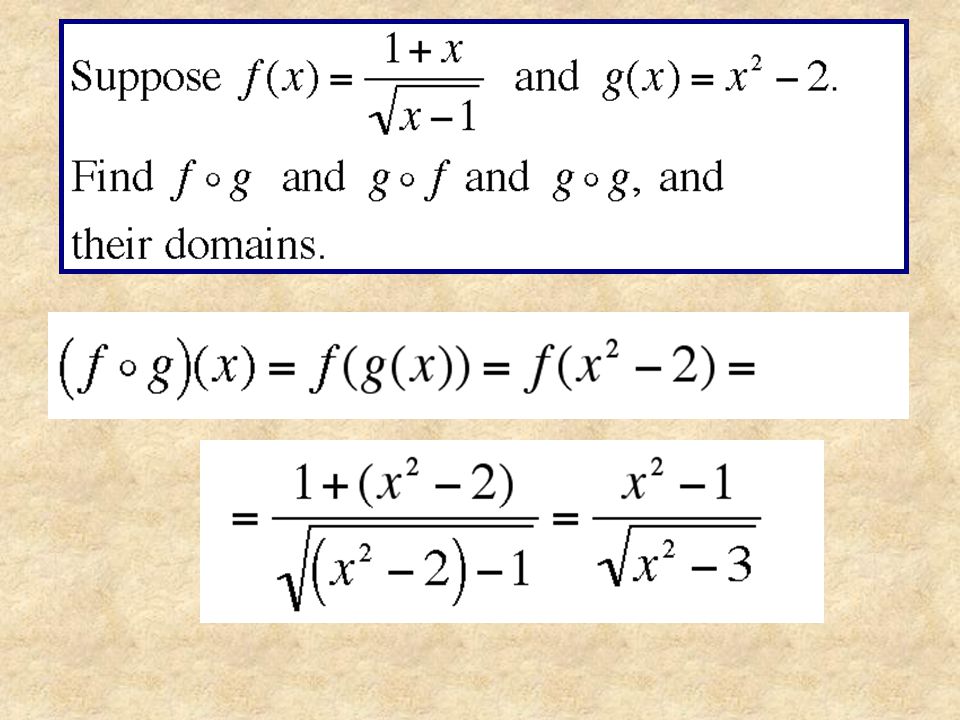
In general

186
Domain: x > 1

188
Symmetry; Graphing Key Equations

189
Symmetry A graph is said to be symmetric with respect to the x-axis
if for every point (x,y) on the graph, the point (x,-y) is on the graph.
 on the graph, the point (x,-y) is on the graph.")
190
symmetric with respect to the y-axis
A graph is said to be symmetric with respect to the y-axis if for every point (x,y) on the graph, the point (-x,y) is on the graph.
 on the graph, the point (-x,y) is on the graph.")
191
symmetric with respect to the origin
A graph is said to be symmetric with respect to the origin if for every point (x,y) on the graph, the point (-x,-y) is on the graph.
 on the graph, the point (-x,-y) is on the graph.")
192
Tests for Symmetry x-axis Replace y by -y in the equation. If an equivalent equation results, the graph is symmetric with respect to the x-axis. y-axis Replace x by -x in the equation. If an equivalent equation results, the graph is symmetric with respect to the y-axis. origin Replace x by -x and y by -y in the equation. If an equivalent equation results, the graph is symmetric with respect to the origin.

193
Not symmetric with respect to the x-axis.

194
Symmetric with respect to the y-axis.

195
Not symmetric with respect to the origin.

196
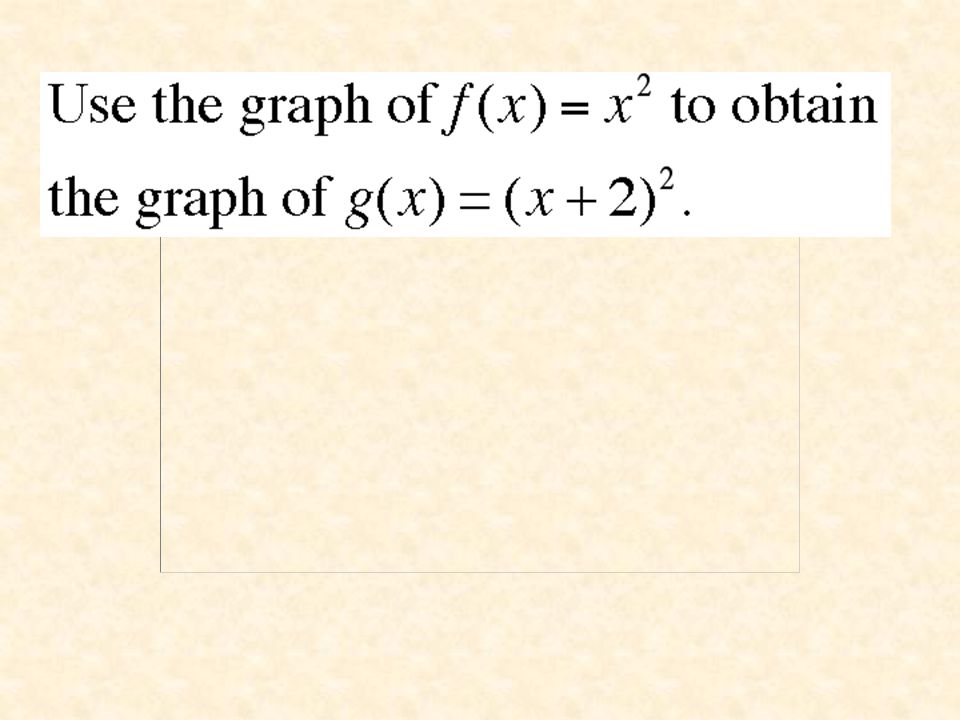
Graphing Techniques; Transformations

198
(2, 6) (1, 3) (2, 4) (1, 1) (0, 2) (0, 0)
 (1, 3) (2, 4) (1, 1) (0, 2) (0, 0)")
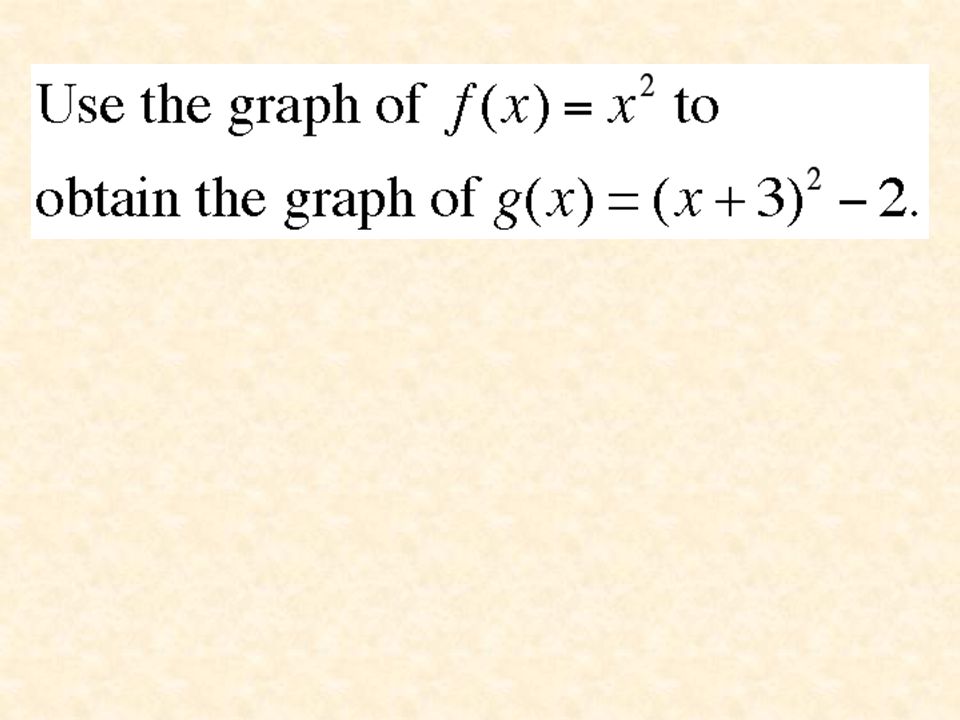
200
(2, 4) (0, 0) (1, 1) (2, 1) (1, -2) (0, -3)
 (0, 0) (1, 1) (2, 1) (1, -2) (0, -3)")
201
Vertical Shifts c> The graph of f(x) + c is the same as the graph of f(x) but shifted UP by c. For example: c = 2 then f(x) + 2 shifts f(x) up by 2. c< The graph of f(x) + c is the same as the graph of f(x) but shifted DOWN by c. For example: c = -3 then f(x) + (-3) = f(x) - 3 shifts f(x) down by 3.
 + 2 shifts f(x) up by 2. c<0 The graph of f(x) + c is the same as the graph of f(x) but shifted DOWN by c. For example: c = -3 then f(x) + (-3) = f(x) - 3 shifts f(x) down by 3.")
204
Horizontal Shifts If the argument x of a function f is replaced by
x - h, h a real number, the graph of the new function y = f( x - h ) is the graph of f shifted horizontally left (if h < 0) or right (if h > 0).
 is the graph of f shifted horizontally left (if h < 0) or right (if h > 0).")
207
Reflections about the x-Axis and the y-Axis
The graph of g= - f(x) is the same as graph of f(x) but reflected about the x-axis. The graph of g= f(-x) is the same as graph of f(x) but reflected about the y-axis.
 is the same as graph of f(x) but reflected about the x-axis. The graph of g= f(-x) is the same as graph of f(x) but reflected about the y-axis.")
214
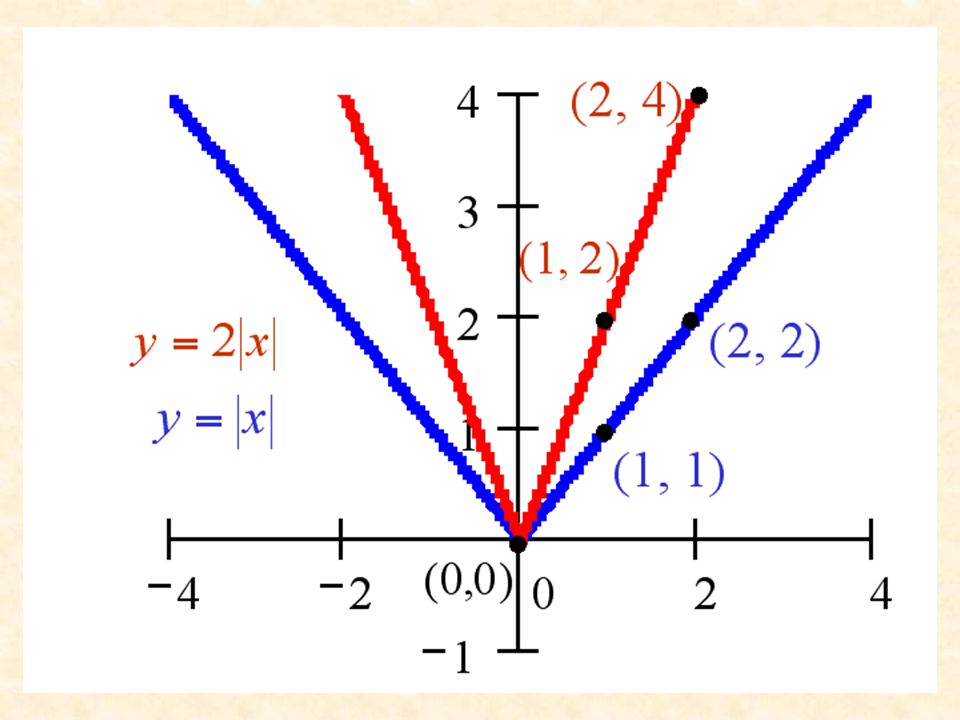
Compression and Stretches
The graph of y = af(x) is obtained from the graph of y = f(x) by vertically stretching the graph if a > 1 or vertically compressing the graph if 0 < a < 1. The graph of y= f(ax) is obtained from the graph of y = f(x) by horizontally compressing the graph if a > 1 or horizontally stretching the graph if 0 < a < 1.
 is obtained from the graph of y = f(x) by vertically stretching the graph if a > 1 or vertically compressing the graph if 0 < a < 1. The graph of y= f(ax) is obtained from the graph of y = f(x) by horizontally compressing the graph if a > 1 or horizontally stretching the graph if 0 < a < 1.")
216
GRAPHS OF TRIGONOMETRIC FUNCTIONS

217
The function y = sin x has period 2π, because sin (x + 2π) = sin x.
Here is the graph of y = sin x: The function y = sin x has period 2π, because sin (x + 2π) = sin x.
 = sin x.")
218
The graph of y = sin ax When a function has this form, y = sin ax, then the constant a indicates the number of periods in an interval of length 2π. For example, if a = 2, then, y = sin 2x -- that means there are 2 periods in an interval of length 2π. If a = 3 , then y = sin 3x -- there are 3 periods in that interval:

219
The graph of y = cos x The graph of y = tan x

220
Students are advised to draw the graphs of other
Trigonometric functions

Similar presentations


 = x2 -1>")


