Download presentation
Presentation is loading. Please wait.

1
Functions, Graphs, and Limits
CALCULUS I Chapter 1 Functions, Graphs, and Limits Mr. Saâd BELKOUCH

2
Functions Graph of a Function Linear Functions Limits One-Sided Limits and Continuity

3
Section 1: Functions A function is a rule that assigns to each object in a set A exactly one object in a set B. The set A is called the domain of the function, and the set of assigned objects in B is called the range. A function is denoted by a letter such as f, g, h…etc The value that the function f assigns to the number x in the domain is then denoted by f(x) f(x) = 2x3 + 7
 f(x) = 2x")
4
It may help to think of such a function as a "mapping" from numbers in A to numbers in B, or as a "machine" that takes a given number from A and converts it into a number in B through a process indicated by the functional rule. it is important to remember that a function assigns one and only one number in the range (output) to each number in the domain (input)
 to each number in the domain (input)")
5
A functional relationship may be represented by an equation y = f(x)
Example: Find f(3) if f(x) = x2 + 4 Solution: f(3) = = 13 A function assigns one and only one number in the range to each number in the domain. A functional relationship may be represented by an equation y = f(x) y is called the dependent variable and x the indepedent variable since the value of y depends on that of x
 if f(x) = x Solution: f(3) = = 13. A function assigns one and only one number in the range to each number in the domain. A functional relationship may be represented by an equation y = f(x) y is called the dependent variable and x the indepedent variable since the value of y depends on that of x.")
6
Domain of a function If a formula is used to define a function f, then we assume the domain of f to be the set of all numbers for which f(x) is defined. We refer to this as the natural domain of f Example: f (x) = 1 / ( x - 1) x can take any real number except 1 since x = 1 would make the denominator equal to zero and the division by zero is not allowed in mathematics. Hence the domain in interval notation is given by: (-infinity , 1) U (1 , +infinity)
 is defined. We refer to this as the natural domain of f. Example: f (x) = 1 / ( x - 1) x can take any real number except 1 since x = 1 would make the denominator equal to zero and the division by zero is not allowed in mathematics. Hence the domain in interval notation is given by: (-infinity , 1) U (1 , +infinity)")
7
Find the domain and range of each of these functions. f(x) = Solution
Example: Find the domain and range of each of these functions. f(x) = Solution Since division by any number other than 0 is possible, the domain of f is the set of all numbers x such that x - 3 ≠0; that is, x ≠3. The range of f is the set of all numbers y except 0, since for any y≠ 0, there is an x such that y = 1/x-3 in particular, x= 3+
 = Solution. Since division by any number other than 0 is possible, the domain of f is the set of all numbers x such that x - 3 ≠0; that is, x ≠3. The range of f is the set of all numbers y except 0, since for any y≠ 0, there is an x such that. y = 1/x-3 in particular, x= 3+")
8
Example: Find the domain and range of this function. g(x) = Solution
Since negative numbers do not have real square roots, g(t) can be evaluated only when t- 2 ≥0, so the domain of g is the set of all numbers t such that t≥2 . The range of g is the set of all nonnegative numbers, if y≥0, there is a t such that y = ; namely, t =
 can be evaluated only when t- 2 ≥0, so the domain of g is the set of all numbers t such that t≥2 . The range of g is the set of all nonnegative numbers, if y≥0, there is a t such that y = ; namely, t = +2.")
9
Composition of functions
Given functions f(u) and g(x), the composition f(g(x)) is the function of x formed by substituting u = g(x) for u in the formula for f(u). In other words, it is a combination of two functions, where you apply the first function, get an answer, and then fill that answer into the second function. Note that the composite function f(g(x)) "makes sense" only if the domain of f contains the range of g
 and g(x), the composition f(g(x)) is the function of x formed by substituting u = g(x) for u in the formula for f(u). In other words, it is a combination of two functions, where you apply the first function, get an answer, and then fill that answer into the second function. Note that the composite function f(g(x)) makes sense only if the domain of f contains the range of g.")
10
Here are two simple functions, which we'll label f and g: f(x) = 4x2 - 1 g(x) = 3x The composite function value we want is f( g(2) ) First work out g(2) = 3(2) + 2 = 8 Then work out f(8) = 4(8)2 - 1 = 4(64) - 1 = 255 So f( g(2) ) = 255 Notice that you do the inside function first. Then you fill that answer into the outside function.
 = 3(2) + 2 = 8 Then work out f(8) = 4(8)2 - 1 = 4(64) - 1 = 255 So f( g(2) ) = 255. Notice that you do the inside function first. Then you fill that answer into the outside function.")
11
The Difference Quotient
A difference quotient is an expression of the general form where f is a given function of x and h is a number The difference quotient is used in the definition of the derivative

12
Section 2: The graph of a function
The graph of a function is a diagram that exhibits a relationship between two sets of numbers as a set of points (or plot) having coordinates determined by the function. Graphs have visual impact. They also reveal information that may not be evident from verbal or algebraic descriptions.
 having coordinates determined by the function. Graphs have visual impact. They also reveal information that may not be evident from verbal or algebraic descriptions.")
13
Rectangular coordinate system
A rectangular coordinate system (or Cartesian coordinate system) is defined by an ordered pair of perpendicular lines (coordinate axes), generally a single unit of length for both axes, and an orientation for each axis. The coordinate axes separate the plane into four parts called quadrants Any point P in the plane can be associated with a unique ordered pair of numbers (a, b) called the coordinates of P. a is the x coordinate (or abscissa) and b is called the y coordinate (or ordinate).
 is defined by an ordered pair of perpendicular lines (coordinate axes), generally a single unit of length for both axes, and an orientation for each axis. The coordinate axes separate the plane into four parts called quadrants. Any point P in the plane can be associated with a unique ordered pair of numbers (a, b) called the coordinates of P. a is the x coordinate (or abscissa) and b is called the y coordinate (or ordinate).")
15
The distance formula The distance between the points P(Xl, Yl) and Q(X2, Y2) is given by To represent a function Y = f(x) geometrically as a graph, we plot values of the independent variable X on the (horizontal) X axis and values of the dependent variable Y on the (vertical) y axis.
 geometrically as a graph, we plot values of the independent variable X on the (horizontal) X axis and values of the dependent variable Y on the (vertical) y axis.")
16
Example: Find the distance between the points P(-2, 5) and Q(4, -1).
Solution In the distance formula, we have Xl = -2, Y1 = 5, X2 = 4, and Y2 = -1, so the distance between P and Q may be found as follows: D = =

17
The graph of a function The graph of a function f consists of all points (x, y) where x is in the domain of f and y = f(x); that is, all points of the form (x,f(x)).
 where x is in the domain of f and y = f(x); that is, all points of the form (x,f(x)).")
18
Example of a graph of a function

19
Y and x intercepts The points (if any) where a graph crosses the x axis are called x intercepts, and similarly, a y intercept is a point where the graph crosses the y axis. To find any x intercept, set y = 0 and solve for x. To find any Y intercept, set x = 0 and solve for y.
 where a graph crosses the x axis are called x intercepts, and similarly, a y intercept is a point where the graph crosses the y axis. To find any x intercept, set y = 0 and solve for x. To find any Y intercept, set x = 0 and solve for y.")
20
Y and x intercepts Solution
Graph the function f(x) = - x2 + x + 2. Include all x and y intercepts. Solution The y intercept is f(O) = 2. To find the x intercepts, solve the equation: f(x) = O. Factoring, we find that - x2 + x + 2 = factor -(x + 1)(x - 2) = 0 Note that: uv = 0, if and only if u = 0 or v = 0 x = -1 and x = 2, thus, the x intercepts are: (-1, 0) and (2, 0). Next, make a table of values and plot the corresponding points (x, f(x)). 4 3 2 1 -1 -2 -3 x -10 -4 f(x)
 = - x2 + x + 2. Include all x and y intercepts. Solution. The y intercept is f(O) = 2. To find the x intercepts, solve the equation: f(x) = O. Factoring, we find that. - x2 + x + 2 = 0 factor -(x + 1)(x - 2) = 0. Note that: uv = 0, if and only if u = 0 or v = 0. x = -1 and x = 2, thus, the x intercepts are: (-1, 0) and (2, 0). Next, make a table of values and plot the corresponding points (x, f(x)) x f(x)")
21
Here is the graph of the function f(x) = - x2 + x + 2 with the intercepts
 = - x2 + x + 2 with the intercepts")
22
Graphing Parabolas In general, the graph of y = Ax2 + Bx + C is a parabola as long as A #0. All parabolas have a "U shape," and the parabola y = Ax2 + Bx + C opens up if A > 0 and down if A < O. The "peak". To graph a reasonable parabola, we should know: The location of the vertex ( where x = -B/2A ) Whether the parabola opens up (A > 0) or down (A < 0) Any intercepts Example: y = -x2 + x + 2
 Whether the parabola opens up (A > 0) or down (A < 0) Any intercepts. Example: y = -x2 + x + 2.")
23
Intersection of Graphs
The values of x for 'which two functions f(x) and g(x) are equal', are the x coordinates of the points where their graphs intersect.
 and g(x) are equal , are the x coordinates of the points where their graphs intersect.")
24
Example: Find all points of intersection of the graphs of f(x) = x and g(x) = x2 Solution You must solve the equation x2 = x. Rewrite the equation as x2 - x = 0 which leads to x(x - 1), so the solutions are 0 and 1
, so the solutions are 0 and 1.")
25
Power Functions, Polynomials, and Rational Functions
A polynomial is a function of the form p(x) = an.xn" + an-1xx-1 +…………+ alx + ao where n is a nonnegative integer and ao, a1, ……….., an are constants. The integer n (when not equal to zero) is called the degree of the polynomial A quotient of two polynomials p(x) and q(x) is called a rational function.
 = an.xn + an-1xx-1 +…………+ alx + ao. where n is a nonnegative integer and ao, a1, ……….., an are constants. The integer n (when not equal to zero) is called the degree of the polynomial. A quotient of two polynomials p(x) and q(x) is called a rational function.")
26
Power Functions, Polynomials, and Rational Functions
Explanation Example Polynomial Since all of the variables have integer exponents that are positive this is a polynomial. x2 + 2x +5 (x7 + 2x4 - 5) * 3x Not a polynomial because a term has a negative exponent 5x-2 +1 Not a polynomial because a term has a fraction exponent 3x½ +2 Not a polynomial because of the division (5x +1) ÷ (3x) Is actually a polynomial because it's possible to simplify this to 2x + 3, which of course satisfies the requirements of a polynomial. (2x2 +3x) ÷ (x)
 * 3x. Not a polynomial because a term has a negative exponent. 5x Not a polynomial because a term has a fraction exponent. 3x½ +2. Not a polynomial because of the division. (5x +1) ÷ (3x) Is actually a polynomial because it s possible to simplify this to 2x + 3, which of course satisfies the requirements of a polynomial. (2x2 +3x) ÷ (x)")
27
Vertical line test A curve is the graph of a function if and only if no vertical line intersects the curve more than once.

28
Section 3: Linear Functions
A linear function is a function that changes at a constant rate with respect to its independent variable. The graph of a linear function is a straight line. The equation of a linear function can be written in the form y = mx+b where m and b are constants.

29
The Slope of a Line The slope of the nonvertical line passing through the points (Xl, YI) and (X2, Y2) is given by the formula Slope = (Y2 – Y1) / (X2 – X1) Since the graph of a linear function (Y = mx + b) is represented by a line it has only one Y intercept which is b We say that y=mx+b is the equation of the line whose slope is m and whose Y intercept is (0, b).
 / (X2 – X1) Since the graph of a linear function (Y = mx + b) is represented by a line it has only one Y intercept which is b. We say that y=mx+b is the equation of the line whose slope is m and whose Y intercept is (0, b).")
30
The Slope of a Line Find the slope of the line joining the points (-2, 5) and (3, -1). Solution: Slope = = =

31
The Point-Slope Form The equation y - yo = m(x - xo)
is an equation of the line that passes through the point (xo,yo) and that has slope equal to m.
 and that has slope equal to m.")
32
The Point-Slope Form Find the equation of the line that passes through the point (5,1) with a slope of ½ Solution Use the formula y-y0=m(x-x0) with (x0,y0)=(5,1) and m = ½ to get y - 1 = ½(x - 5) which you can rewrite as y = x -
 with (x0,y0)=(5,1) and m = ½ to get y - 1 = ½(x - 5) which you can rewrite as y = x -")
33
Parallel, perpendicular lines
Let m1and m2 be the slopes of the nonvertical lines L1, and L2. Then L1 and L2 are parallel if and only if m1 =m2 L1 and L2 are perpendicular if and only if m2 = -1/ m1

34
Example: Let L be the line 4x + 3y = 3.
1) Find the equation of a line L, parallel to L through P(-1, 4). 2) Find the equation of a line L2 perpendicular to L through Q(2, -3). Solution By rewriting the equation 4x + 3y = 3 in the slope-intercept form we get: y = -4/3 x + 1 we can deduct that the slope of L is -4/3 1) Any line parallel to L must also have slope m = - 4/3 and the required line L1 contains P(-1, 4), so y-4 = -4/3 (x + 1) thus : y = - x + 2 ) A line perpendicular to L must have slope m = , Since the required line L2, contains Q(2, -3), we have y + 3 = 3/4*(x-2) Which means: y = x -
 Find the equation of a line L, parallel to L through P(-1, 4). 2) Find the equation of a line L2 perpendicular to L through Q(2, -3). Solution. By rewriting the equation 4x + 3y = 3 in the slope-intercept form we get: y = -4/3 x + 1 we can deduct that the slope of L is -4/3. 1) Any line parallel to L must also have slope m = - 4/3 and the required line L1 contains P(-1, 4), so y-4 = -4/3 (x + 1) thus : y = - x + 2 ) A line perpendicular to L must have slope m = - , Since the required line L2, contains Q(2, -3), we have y + 3 = 3/4*(x-2) Which means: y = x -")
35
Section 4: Limits Let f(x) = 2 x + 2 and compute f(x) as x takes values closer to 1. We first consider values of x approaching 1 from the left (x < 1), then we consider x approaching 1 from the right (x > 1). In both cases as x approaches 1, f(x) approaches 4. Intuitively, we say that limx→1 f(x) = 4.
 = 2 x + 2 and compute f(x) as x takes values closer to 1. We first consider values of x approaching 1 from the left (x < 1), then we consider x approaching 1 from the right (x > 1). In both cases as x approaches 1, f(x) approaches 4. Intuitively, we say that limx→1 f(x) = 4.")
36
The limit of a Function If f(x) gets closer and closer to a number L as x gets closer and closer to c from both sides, then L is the limit of f(x) as x approaches c. The behavior is expressed by writing Lim f(x) = L XC Note: the limit of a constant is the constant itself, and the limit of f(x) = x as x approaches c is c.
 gets closer and closer to a number L as x gets closer and closer to c from both sides, then L is the limit of f(x) as x approaches c. The behavior is expressed by writing. Lim f(x) = L. XC. Note: the limit of a constant is the constant itself, and the limit of f(x) = x as x approaches c is c.")
37
Algebraic Properties of Limits

38
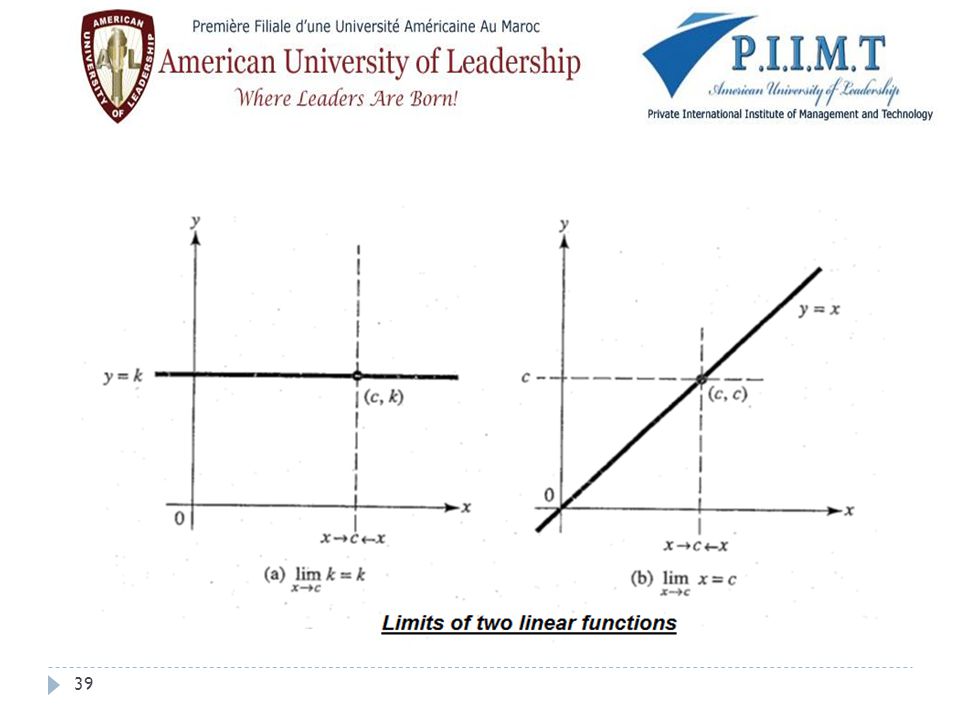
Limits of Two linear Functions
For any constant k, = k and That is, the limit of a constant is the constant itself, and the limit of f(x) = x as x approaches c is c.
 = x as x approaches c is c.")
40
Limits of Polynomials and Rational Functions
If p(x) and q(x) are polynomials, then lim(x→c) p(x) = p(c) And = Note: q( c ) must be different from zero
 and q(x) are polynomials, then. lim(x→c) p(x) = p(c) And. = Note: q( c ) must be different from zero.")
41
Limits at infinity If the values of the function f(x) approach the number L as x increases without bound, we write Similarly, we write when the functional values f(x) approach the number M as x decreases without bound.
 approach the number M as x decreases without bound.")
43
Reciprocal Power Rules
If A and k are constants with k > 0 and xk is defined for all x, then:

44
We say that is an infinite limit if f(x) increases or decreases without bound as X C.
We write if f(x) increases without bound as X C if f(x) decreases without bound as X C
 increases without bound as X C. if f(x) decreases without bound as X C.")
45
Section 5: One-Sided Limits and Continuity
The graph of a continuous function can be drawn without lifting the pencil from the paper A function is not continuous where its graph has a "hole or gap"

46
One-Sided Limits If f(x) approaches L as x tends toward c from the left (x < c), we write Likewise, if f(x) approaches M as x tends toward c from the right (c < x), then
 approaches M as x tends toward c from the right (c < x), then.")
47
= Existence of a limit The two-sided limit exists if and only if the two one-sided limits and both exist and are equal, and then =

48
Continuity A function is said to be continuous at c if all three of these conditions are satisfied: a is defined. b exists. c = If f(x) is not continuous at c, it is said to have a discontinuity there
 is not continuous at c, it is said to have a discontinuity there.")
49
Continuity on an interval
A function f(x) is said to be continuous on an open interval a < x < b if it is continuous at each point x = c in that interval. Moreover, f is continuous on the closed interval a ≤ x ≤ b if it is continuous on the open interval a < x < b and: and
 is said to be continuous on an open interval a < x < b if it is continuous at each point x = c in that interval. Moreover, f is continuous on the closed interval a ≤ x ≤ b if it is continuous on the open interval a < x < b and: and.")
50
END OF CHAPTER I

Similar presentations