Download presentation
Presentation is loading. Please wait.

1
Sequence comparison: Significance of similarity scores Genome 559: Introduction to Statistical and Computational Genomics Prof. James H. Thomas

2
Review How to compute and use a score matrix. log-odds of sum-of-pair counts vs. expected counts. Why gap scores should be affine.

3
Are these proteins related? SEQ 1: RVVNLVPS--FWVLDATYKNYAINYNCDVTYKLY L P W L Y N Y C L SEQ 2: QFFPLMPPAPYWILATDYENLPLVYSCTTFFWLF SEQ 1: RVVNLVPS--FWVLDATYKNYAINYNCDVTYKLY L P W LDATYKNYA Y C L SEQ 2: QFFPLMPPAPYWILDATYKNYALVYSCTTFFWLF SEQ 1: RVVNLVPS--FWVLDATYKNYAINYNCDVTYKLY RVV L PS W LDATYKNYA Y CDVTYKL SEQ 2: RVVPLMPSAPYWILDATYKNYALVYSCDVTYKLF YES (score = 24) PROBABLY (score = 15) NO (score = 9)
 PROBABLY (score = 15) NO (score = 9).")
4
Significance of scores Alignment algorithm HPDKKAHSIHAWILSKSKVLEGNTKEVVDNVLKT LENENQGKCTIAEYKYDGKKASVYNSFVSNGVKE 45 Low score = unrelated High score = related How high is high enough?

5
The null hypothesis We are interested in characterizing the distribution of scores from pairwise sequence alignments. We measure how surprising a given score is, assuming that the two sequences are not related. This assumption is called the null hypothesis. The purpose of most statistical tests is to determine whether the observed result(s) provide a reason to reject the null hypothesis.
 provide a reason to reject the null hypothesis..")
6
Sequence similarity score distribution Search a randomly generated database of sequences using a given query sequence. What will be the form of the resulting distribution of pairwise sequence comparison scores? Sequence comparison score Frequency ?

7
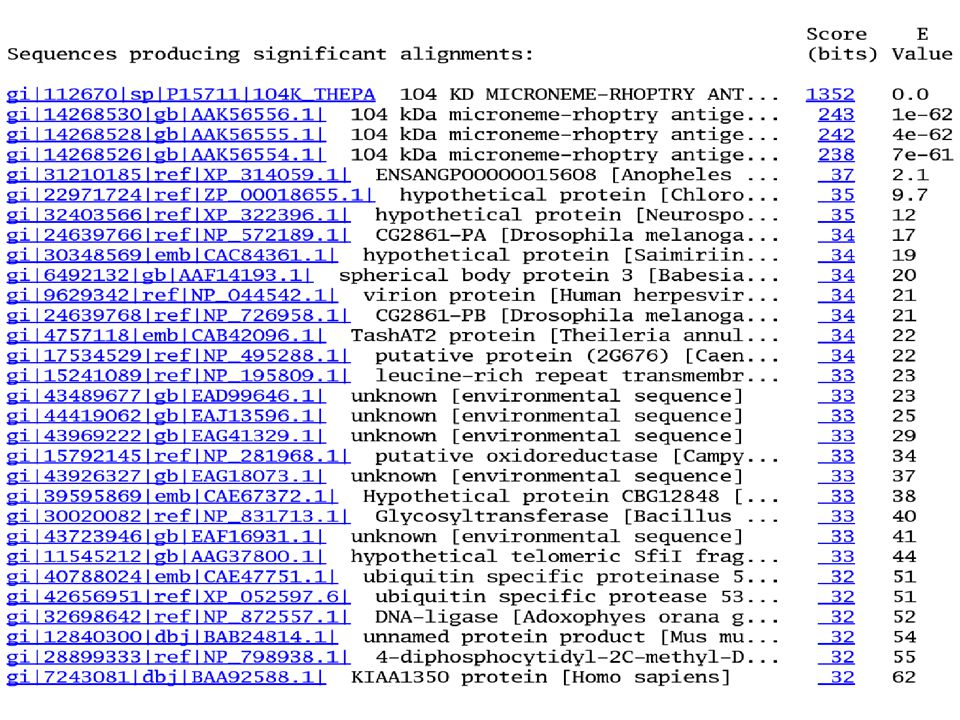
Empirical score distribution This shows the distribution of scores from a real database search using BLAST. This distribution contains scores from related and unrelated pair alignments. High scores from related sequences

8
Empirical null score distribution This distribution is similar to the previous one, but generated using a randomized sequence database (each sequence shuffled). (notice the scale is shorter here) 1,685 scores
 1,685 scores.")
9
Computing a p-value The probability of observing a score >=X is the area under the curve to the right of X. This probability is called a p-value. p-value = Pr(data|null) (read as probability of data given a null hypothesis) e.g. out of 1,685 scores, 28 received a score of 20 or better. Thus, the p-value associated with a score of 20 is approximately 28/1685 = 0.0166.
 (read as probability of data given a null hypothesis) e.g. out of 1,685 scores, 28 received a score of 20 or better. Thus, the p-value associated with a score of 20 is approximately 28/1685 =")
10
Problems with empirical distributions We are interested in very small probabilities. These are computed from the tail of the null distribution. Estimating a distribution with an accurate tail is feasible but computationally very expensive because we have to compute a very large number of scores.

11
A solution Solution: Characterize the form of the distribution mathematically. Fit the parameters of the distribution empirically, or compute them analytically. Use the resulting distribution to compute accurate p-values. First solved by Karlin and Altschul.

12
Extreme value distribution This distribution is roughly normal near the peak, but characterized by a larger tail on the right.

13
Computing a p-value The probability of observing a score >=4 is the area under the curve to the right of 4. p-value = Pr(data|null)
.")
14
Unscaled EVD equation Compute this value for x=4.

15
Computing a p-value

17
Scaling the EVD An EVD derived from, e.g., the Smith-Waterman algorithm with BLOSUM62 matrix and a given gap penalty has a characteristic mode μ and scale parameter λ. and depend on the size of the query, the size of the target database, the substitution matrix and the gap penalties. scaled:

18
An example You run BLAST and get a score of 45. You then run BLAST on a shuffled version of the database, and fit an extreme value distribution to the resulting empirical distribution. The parameters of the EVD are = 25 and = 0.693. What is the p-value associated with 45? BLAST has precomputed values of and for all common matrices and gap penalties (and the run scales them for the size of the query and database)
.")
19
What p-value is significant? The most common thresholds are 0.01 and 0.05. A threshold of 0.05 means you are 95% sure that the result is significant. Is 95% enough? It depends upon the cost associated with making a mistake. Examples of costs: –Doing extensive wet lab validation (expensive) –Making clinical treatment decisions (very expensive) –Misleading the scientific community (very expensive) –Doing further simple computational tests (cheap) –Telling your grandmother (very cheap)
 –Making clinical treatment decisions (very expensive) –Misleading the scientific community (very expensive) –Doing further simple computational tests (cheap) –Telling your grandmother (very cheap).")
20
Multiple testing Say that you perform a statistical test with a 0.05 threshold, but you repeat the test on twenty different observations (e.g. 20 different blast runs) Assume that all of the observations are explainable by the null hypothesis. What is the chance that at least one of the observations will receive a p-value less than 0.05?
 Assume that all of the observations are explainable by the null hypothesis. What is the chance that at least one of the observations will receive a p-value less than")
21
Bonferroni correction Assume that individual tests are independent. Divide the desired p-value threshold by the number of tests performed.

22
Database searching Say that you search the non-redundant protein database at NCBI, containing roughly one million sequences (i.e. you are doing 10 6 pairwise tests). What p-value threshold should you use? Say that you want to use a conservative p-value of 0.001. Recall that you would observe such a p-value by chance approximately every 1000 times in a random database. A Bonferroni correction would suggest using a p-value threshold of 0.001 / 10 6 = 10 -9.
. What p-value threshold should you use. Say that you want to use a conservative p-value of Recall that you would observe such a p-value by chance approximately every 1000 times in a random database. A Bonferroni correction would suggest using a p-value threshold of / 10 6 =")
23
E-values A p-value is the probability of making a mistake. An E-value is the expected number of times that the given score would appear in a random database of the given size. One simple way to compute the E-value is to multiply the p-value times the size of the database. Thus, for a p-value of 0.001 and a database of 1,000,000 sequences, the corresponding E-value is 0.001 × 1,000,000 = 1,000. (BLAST actually calculates E-values in a more complex way, but they mean the same thing)
.")
26
Summary A distribution plots the frequencies of types of observation. The area under the distribution curve is 1. Most statistical tests compare observed data to the expected result according to a null hypothesis. Sequence similarity scores follow an extreme value distribution, which is characterized by a long tail. The p-value associated with a score is the area under the curve to the right of that score. Selecting a significance threshold requires evaluating the cost of making a mistake. Bonferroni correction: Divide the desired p-value threshold by the number of statistical tests performed. The E-value is the expected number of times that a given score would appear in a random database of the given size.

Similar presentations


 A2 is online We considered the basics of sequence alignment –Opt score.>")


 713 348 5255>")


 Heuristic Only parts of protein are frequently subject to mutations. For example, active sites (that one.>")