Download presentation
Presentation is loading. Please wait.

1
Chemistry 2100 Lecture 9

2
Carbohydrates Molecular formula (CH2O)n
Carbohydrate: A polyhydroxyaldehyde or polyhydroxyketone, or a substance that gives these compounds on hydrolysis. Monosaccharide: A carbohydrate that cannot be hydrolyzed to a simpler carbohydrate. Aldose: A monosaccharide containing an aldehyde group. Ketose: A monosaccharide containing a ketone group.

3
FIGURE 7-2 (part 3) Three ways to represent the two enantiomers of glyceraldehyde. The enantiomers are mirror images of each other. Ball-and-stick models show the actual configuration of molecules. Recall (see Figure 1-17) that in perspective formulas, solid wedge-shaped bonds point toward the reader, dashed wedges point away. 3

4
FIGURE 7-1a Representative monosaccharides
FIGURE 7-1a Representative monosaccharides. (a)Two trioses, an aldose and a ketose. The carbonyl group in each is shaded. 4
Two trioses, an aldose and a ketose. The carbonyl group in each is shaded. 4.")
5
Enantiomers FIGURE 7-2 (part 1) Three ways to represent the two enantiomers of glyceraldehyde. The enantiomers are mirror images of each other. Ball-and-stick models show the actual configuration of molecules. Recall (see Figure 1-17) that in perspective formulas, solid wedge-shaped bonds point toward the reader, dashed wedges point away. 5
 Three ways to represent the two enantiomers of glyceraldehyde. The enantiomers are mirror images of each other. Ball-and-stick models show the actual configuration of molecules. Recall (see Figure 1-17) that in perspective formulas, solid wedge-shaped bonds point toward the reader, dashed wedges point away. 5.")
6
Monosacharides In 1891, Emil Fischer made the arbitrary assignments of D- and L- to the enantiomers of glyceraldehyde. D-monosaccharide: the -OH on its penultimate carbon is on the right in a Fischer projection. L-monosaccharide: the -OH on its penultimate carbon is on the left in a Fischer projection.

7
Epimers FIGURE 7-4 Epimers. D-Glucose and two of its epimers are shown as projection formulas. Each epimer differs from D-glucose in the configuration at one chiral center (shaded pink). 7
. 7.")
8
FIGURE 7-3a (part 1) Aldoses and ketoses
FIGURE 7-3a (part 1) Aldoses and ketoses. The series of (a) D-aldoses and (b) D-ketoses having from three to six carbon atoms, shown as projection formulas. The carbon atoms in red are chiral centers. In all these D isomers, the chiral carbon most distant from the carbonyl carbon has the same configuration as the chiral carbon in D-glyceraldehyde. The sugars named in boxes are the most common in nature; you will encounter these again in this and later chapters. 8
 Aldoses and ketoses. The series of (a) D-aldoses and (b) D-ketoses having from three to six carbon atoms, shown as projection formulas. The carbon atoms in red are chiral centers. In all these D isomers, the chiral carbon most distant from the carbonyl carbon has the same configuration as the chiral carbon in D-glyceraldehyde. The sugars named in boxes are the most common in nature; you will encounter these again in this and later chapters. 8.")
9
FIGURE 7-3a (part 2) Aldoses and ketoses
FIGURE 7-3a (part 2) Aldoses and ketoses. The series of (a) D-aldoses and (b) D-ketoses having from three to six carbon atoms, shown as projection formulas. The carbon atoms in red are chiral centers. In all these D isomers, the chiral carbon most distant from the carbonyl carbon has the same configuration as the chiral carbon in D-glyceraldehyde. The sugars named in boxes are the most common in nature; you will encounter these again in this and later chapters. 9
 Aldoses and ketoses. The series of (a) D-aldoses and (b) D-ketoses having from three to six carbon atoms, shown as projection formulas. The carbon atoms in red are chiral centers. In all these D isomers, the chiral carbon most distant from the carbonyl carbon has the same configuration as the chiral carbon in D-glyceraldehyde. The sugars named in boxes are the most common in nature; you will encounter these again in this and later chapters. 9.")
10
FIGURE 7-3a (part 3) Aldoses and ketoses
FIGURE 7-3a (part 3) Aldoses and ketoses. The series of (a) D-aldoses and (b) D-ketoses having from three to six carbon atoms, shown as projection formulas. The carbon atoms in red are chiral centers. In all these D isomers, the chiral carbon most distant from the carbonyl carbon has the same configuration as the chiral carbon in D-glyceraldehyde. The sugars named in boxes are the most common in nature; you will encounter these again in this and later chapters. 10
 Aldoses and ketoses. The series of (a) D-aldoses and (b) D-ketoses having from three to six carbon atoms, shown as projection formulas. The carbon atoms in red are chiral centers. In all these D isomers, the chiral carbon most distant from the carbonyl carbon has the same configuration as the chiral carbon in D-glyceraldehyde. The sugars named in boxes are the most common in nature; you will encounter these again in this and later chapters. 10.")
11
FIGURE 7-3b (part 1) Aldoses and ketoses
FIGURE 7-3b (part 1) Aldoses and ketoses. The series of (a) D-aldoses and (b) D-ketoses having from three to six carbon atoms, shown as projection formulas. The carbon atoms in red are chiral centers. In all these D isomers, the chiral carbon most distant from the carbonyl carbon has the same configuration as the chiral carbon in D-glyceraldehyde. The sugars named in boxes are the most common in nature; you will encounter these again in this and later chapters. 11
 Aldoses and ketoses. The series of (a) D-aldoses and (b) D-ketoses having from three to six carbon atoms, shown as projection formulas. The carbon atoms in red are chiral centers. In all these D isomers, the chiral carbon most distant from the carbonyl carbon has the same configuration as the chiral carbon in D-glyceraldehyde. The sugars named in boxes are the most common in nature; you will encounter these again in this and later chapters. 11.")
12
FIGURE 7-3b (part 2) Aldoses and ketoses
FIGURE 7-3b (part 2) Aldoses and ketoses. The series of (a) D-aldoses and (b) D-ketoses having from three to six carbon atoms, shown as projection formulas. The carbon atoms in red are chiral centers. In all these D isomers, the chiral carbon most distant from the carbonyl carbon has the same configuration as the chiral carbon in D-glyceraldehyde. The sugars named in boxes are the most common in nature; you will encounter these again in this and later chapters. 12
 Aldoses and ketoses. The series of (a) D-aldoses and (b) D-ketoses having from three to six carbon atoms, shown as projection formulas. The carbon atoms in red are chiral centers. In all these D isomers, the chiral carbon most distant from the carbonyl carbon has the same configuration as the chiral carbon in D-glyceraldehyde. The sugars named in boxes are the most common in nature; you will encounter these again in this and later chapters. 12.")
13
Hemiacetals and Hemiketals
FIGURE 7-5 Formation of hemiacetals and hemiketals. An aldehyde or ketone can react with an alcohol in a 1:1 ratio to yield a hemiacetal or hemiketal, respectively, creating a new chiral center at the carbonyl carbon. Substitution of a second alcohol molecule produces an acetal or ketal. When the second alcohol is part of another sugar molecule, the bond produced is a glycosidic bond (p. 243). 13
. 13.")
14
Cyclization FIGURE 7-6 Formation of the two cyclic forms of D-glucose. Reaction between the aldehyde group at C-1 and the hydroxyl group at C-5 forms a hemiacetal linkage, producing either of two stereoisomers, the α and β anomers, which differ only in the stereochemistry around the hemiacetal carbon. The interconversion of α and β anomers is called mutarotation. 14

15
1 1 1 2 2 2 3 3 3 4 4 4 5 5 5 6 6 6 -D-glucose D-glucose -D-glucose

16
Pyranoses and Furanoses
FIGURE 7-7 Pyranoses and furanoses. The pyranose forms of D-glucose and the furanose forms of D-fructose are shown here as Haworth perspective formulas. The edges of the ring nearest the reader are represented by bold lines. Hydroxyl groups below the plane of the ring in these Haworth perspectives would appear at the right side of a Fischer projection (compare with Figure 7-6). Pyran and furan are shown for comparison. 16
. Pyran and furan are shown for comparison. 16.")
17
Haworth Projections D-Fructose (a 2-ketohexose) also forms a five-membered cyclic hemiacetal.
 also forms a five-membered cyclic hemiacetal.")
18
-D(–)-fructofuranose
-D(–)-fructopyranose (Honey)
-fructopyranose. (Honey)")
19
Chair Conformations For pyranoses, the six-membered ring is more accurately represented as a chair conformation.

20
Chain-ring Equilibrium and Reducing Sugars
FIGURE 7-10 Sugars as reducing agents. Oxidation of the anomeric carbon (and probably the neighboring carbon) of glucose and other sugars under alkaline conditions is the basis for Fehling's reaction. The cuprous ion (Cu+) produced forms a red cuprous oxide precipitate. In the hemiacetal (ring) form, C-1 of glucose cannot be oxidized by complexed Cu2+. However, the open-chain form is in equilibrium with the ring form, and eventually the oxidation reaction goes to completion. The reaction with Cu2+ is complex, yielding a mixture of products and reducing 3 mol of Cu2+ per mole of glucose. 20
 of glucose and other sugars under alkaline conditions is the basis for Fehling s reaction. The cuprous ion (Cu+) produced forms a red cuprous oxide precipitate. In the hemiacetal (ring) form, C-1 of glucose cannot be oxidized by complexed Cu2+. However, the open-chain form is in equilibrium with the ring form, and eventually the oxidation reaction goes to completion. The reaction with Cu2+ is complex, yielding a mixture of products and reducing 3 mol of Cu2+ per mole of glucose. 20.")
21
The Glycosidic Bond FIGURE 7-11 Formation of maltose. A disaccharide is formed from two monosaccharides (here, two molecules of D-glucose) when an —OH (alcohol) of one glucose molecule (right) condenses with the intramolecular hemiacetal of the other glucose molecule (left), with elimination of H2O and formation of a glycosidic bond. The reversal of this reaction is hydrolysis—attack by H2O on the glycosidic bond. The maltose molecule, shown here as an illustration, retains a reducing hemiacetal at the C-1 not involved in the glycosidic bond. Because mutarotation interconverts the α and β forms of the hemiacetal, the bonds at this position are sometimes depicted with wavy lines, as shown here, to indicate that the structure may be either α or β. 21
 when an —OH (alcohol) of one glucose molecule (right) condenses with the intramolecular hemiacetal of the other glucose molecule (left), with elimination of H2O and formation of a glycosidic bond. The reversal of this reaction is hydrolysis—attack by H2O on the glycosidic bond. The maltose molecule, shown here as an illustration, retains a reducing hemiacetal at the C-1 not involved in the glycosidic bond. Because mutarotation interconverts the α and β forms of the hemiacetal, the bonds at this position are sometimes depicted with wavy lines, as shown here, to indicate that the structure may be either α or β. 21.")
22
Disaccharides FIGURE 7-12 Some common disaccharides. Like maltose in Figure 7-11, these are shown as Haworth perspectives. The common name, full systematic name, and abbreviation are given for each disaccharide. Formal nomenclature for sucrose names glucose as the parent glycoside, although it is typically depicted as shown, with glucose on the left. 22

23
Sweetness Monosaccharides are colorless crystalline solids, very soluble in water, but only slightly soluble in ethanol. Sweetness relative to sucrose:

24
starch

25
starch • amylose • amylopectin • dextrins

26
starch • amylose • amylopectin • dextrins

27
starch (1,4) • amylose • amylopectin • dextrins
 • amylose • amylopectin • dextrins")
28
starch (1,4) • amylose • amylopectin • dextrins
 • amylose • amylopectin • dextrins")
29
starch (1,6) (1,4) • amylose • amylopectin • dextrins
 (1,4) • amylose • amylopectin • dextrins")
30
starch • amylose • amylopectin • dextrins

31
glycogen

32
cellulose β(1,4)
")
33
Other Polymers Agar Chitin Heparin

34
FIGURE 7-35 Roles of oligosaccharides in recognition and adhesion at the cell surface. (a) Oligosaccharides with unique structures (represented as strings of hexagons), components of a variety of glycoproteins or glycolipids on the outer surface of plasma membranes, interact with high specificity and affinity with lectins in the extracellular milieu. (b) Viruses that infect animal cells, such as the influenza virus, bind to cell surface glycoproteins as the first step in infection. (c) Bacterial toxins, such as the cholera and pertussis toxins, bind to a surface glycolipid before entering a cell. (d) Some bacteria, such as H. pylori, adhere to and then colonize or infect animal cells. (e) Selectins (lectins) in the plasma membrane of certain cells mediate cell-cell interactions, such as those of neutrophils with the endothelial cells of the capillary wall at an infection site. (f) The mannose 6-phosphate receptor/lectin of the trans Golgi complex binds to the oligosaccharide of lysosomal enzymes, targeting them for transfer into the lysosome. 34

35
Lipids

36
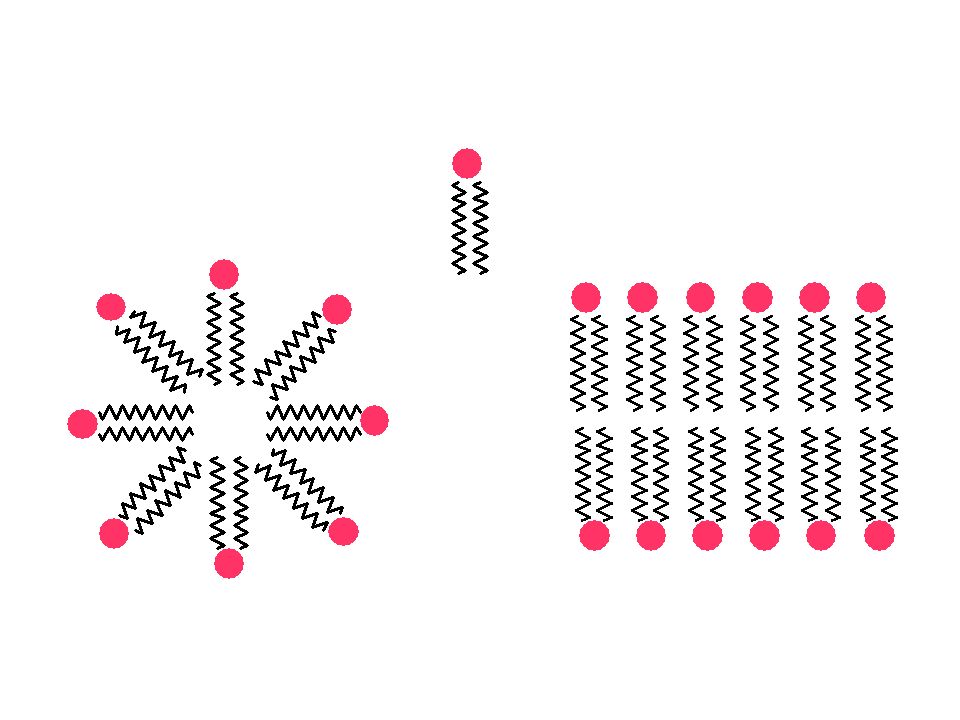
Fatty Acids FIGURE 10-2ab The packing of fatty acids into stable aggregates. The extent of packing depends on the degree of saturation. (a) Two representations of the fully saturated acid stearic acid, 18:0 (stearate at pH 7), in its usual extended conformation. Each line segment of the zigzag represents a single bond between adjacent carbons. (b) The cis double bond (shaded) in oleic acid, 18:1(Δ9) (oleate), restricts rotation and introduces a rigid bend in the hydrocarbon tail. All other bonds in the chain are free to rotate. 36
 Two representations of the fully saturated acid stearic acid, 18:0 (stearate at pH 7), in its usual extended conformation. Each line segment of the zigzag represents a single bond between adjacent carbons. (b) The cis double bond (shaded) in oleic acid, 18:1(Δ9) (oleate), restricts rotation and introduces a rigid bend in the hydrocarbon tail. All other bonds in the chain are free to rotate. 36.")
37
oleic acid (mp 4°C) stearic acid (mp 70°C)
 stearic acid (mp 70°C)")
40
Triacylglycerols FIGURE 10-3 Glycerol and a triacylglycerol. The mixed triacylglycerol shown here has three different fatty acids attached to the glycerol backbone. When glycerol has different fatty acids at C-1 and C-3, C-2 is a chiral center (p. 16). 40
. 40.")
41
Saponification Saponification: the base-promoted hydrolysis of fats and oils in aqueous NaOH and produces glycerol and a mixture of fatty acid salts called soaps.

42
Synthetic Detergents (syndets)
anionic detergents

43
Hydrogenation Hardening: The reduction of some or all of the carbon-carbon double bonds of an unsaturated triglyceride using H2/transition metal catalyst, which converts a liquid triglyceride to a semisolid.

44
• • "partially hydrogenated vegetable oil"

45
Complex Lipids Figure 21.1 Schematic diagram of simple and complex lipids.

46
Membranes: Glycerophoshpolipids
FIGURE 10-9 (part 1) Glycerophospholipids. The common glycerophospholipids are diacylglycerols linked to head-group alcohols through a phosphodiester bond. Phosphatidic acid, a phosphomonoester, is the parent compound. Each derivative is named for the head-group alcohol (X), with the prefix "phosphatidyl-." In cardiolipin, two phosphatidic acids share a single glycerol (R1 and R2 are fatty acyl groups). 46
 Glycerophospholipids. The common glycerophospholipids are diacylglycerols linked to head-group alcohols through a phosphodiester bond. Phosphatidic acid, a phosphomonoester, is the parent compound. Each derivative is named for the head-group alcohol (X), with the prefix phosphatidyl-. In cardiolipin, two phosphatidic acids share a single glycerol (R1 and R2 are fatty acyl groups). 46.")
47
FIGURE (part 1) The similarities in shape and molecular structure of phosphatidylcholine (a glycerophospholipid) and sphingomyelin (a sphingolipid) are clear when their space-filling and structural formulas are drawn as here. 47

50
Fluid Mosaic Model Figure 21.2 The fluid mosaic model of membranes.

51
Other Lipids: Waxes

52
Sterols FIGURE Cholesterol. The stick structure of cholesterol is visible through a transparent surface contour model of the molecule. In the chemical structure, the rings are labeled A through D to simplify reference to derivatives of the steroid nucleus; the carbon atoms are numbered in blue. The C-3 hydroxyl group (pink in both representations) is the polar head group. For storage and transport of the sterol, this hydroxyl group condenses with a fatty acid to form a sterol ester. 52
 is the polar head group. For storage and transport of the sterol, this hydroxyl group condenses with a fatty acid to form a sterol ester. 52.")
53
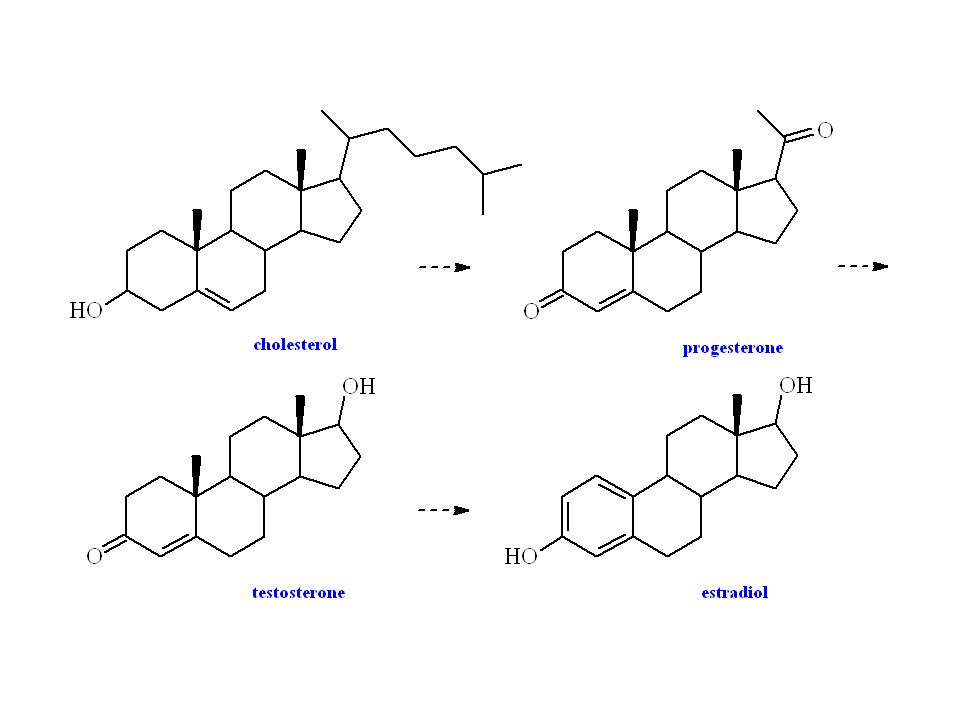
Steroids FIGURE Steroids derived from cholesterol. Testosterone, the male sex hormone, is produced in the testes. Estradiol, one of the female sex hormones, is produced in the ovaries and placenta. Cortisol and aldosterone are hormones synthesized in the cortex of the adrenal gland; they regulate glucose metabolism and salt excretion, respectively. Prednisolone and prednisone are synthetic steroids used as antiinflammatory agents. Brassinolide is a growth regulator found in vascular plants. 53

55
Low-Density Lipoprotein

Similar presentations


>")


 Three long straight chain carboxylic.>")
 Objective: Understand classification and structure of carbohydrates Understand multistep.>")