Download presentation
Presentation is loading. Please wait.

1
…WINTER PREVIEW 2012-13…. EXTREME OR NOT EXTREME THAT IS THE QUESTION !!!!

2
…WINTER 2009-10… 2010-11 featured lots of cold and at times significant cold WINTER 2011-12 the exact opposite 2009-10 … and 2010- 11

3
WHY? NOV 2011 saw development of 2 BIG players 1) huge 500 mb Low or vortex over N slope Alaska e Siberia and 2) deep Large POSITIVE NAO… strongest +NAO ever record !!
 huge 500 mb Low or vortex over N slope Alaska e Siberia and 2) deep Large POSITIVE NAO… strongest +NAO ever record !!.")
4
More detail HERE As you can see some of us saw warning sign that things were developing very differently from what was anticipate now sometimes the PV sitting up there in far nw Canada / N Alaska CAN slide se into central / eastern Canada but even if that were to happen it would take several weeks before it would affect the pattern

5
DEC 2011 dark PURPLE shows EXTREME negative 500 mb height anomalies northeast Canada and Greenland In other words EXTREME +AO and +NAO Both features at or near record levels

6
JAN 8, 2012 NOTE the HUGE intense DARK BLUE & PURLE area over Bering Sea? That is the feature – severe +EPO -- that caused ALASKA to have such prolonged severe winter NOTE super +NAO over Baffin Island in NE Canada In this sort of Pattern No PATH for cold air to get into CONUS

7
FEB 2012 HUGE Vortex over Alaska splits into 2 but with 1 center over western Alaska Pattern over N America could NOT change… Movement of central Asia North LINKED up with Ridge over the UK= SCANDINAVIA RIDGE and brings in severe Europe W Russia CPC nao chart/ plots Viewed the strong Positive Anomaly as -NAO… which a we can see is clearly BS

8
JAN 2011 COMPARE PREVIOUS MAPS TO JAN 2011 ! Bright Orange/ Red over Arctic Region MEAN -AO And over Greenland CLASSIC –NAO… DARK BLUE over Eastern US = Deep trough EXTREME strong SCAN block & -NAO = cold/SNOWY pattern for Europe did you DARK BLUE & PURLE area over Eastern Alaska ? That is NOT the same thing as Bering Sea

11
LATE NOV 2009 the SSTA pattern over nw and N central N Atlantic matched TEXTBOOK idealized ssta pattern for strongly –NAO. This was also the case for NOV 2010 and the winter of 2010-11

12
SUMMARY what did we Learn? The development Huge Vortex over N Alaska/ Bering SEA in early NOV was proverbial Babe Ruth Candy Bar in the Punch Bowl of winter Forecast Unusual SSTA in N Pacific kept PV over Bering Sea Locked in place… and helped to set up the SPRING and SUMMER 2012 pattern SSTA configuration over northern half of N Atlantic strongly favored +NAO and Scandinavia Ridge..which ensured Positive AO.

13
Now compare my explanation to someones else EXPLANATION of what went wrong Last winter Japan Tsunami Debris wave?? Folks that is just plain ol Bravo Sierra (BS) you see WHY looking at Last winter is SOOOO Important ? If you cannot see it..if you explanation is some BS theory.. then how can you get THIS coming winter forecast right ?
 you see WHY looking at Last winter is SOOOO Important . If you cannot see it..if you explanation is some BS theory.. then how can you get THIS coming winter forecast right .")
14
…AUTUMN 2012…..

15
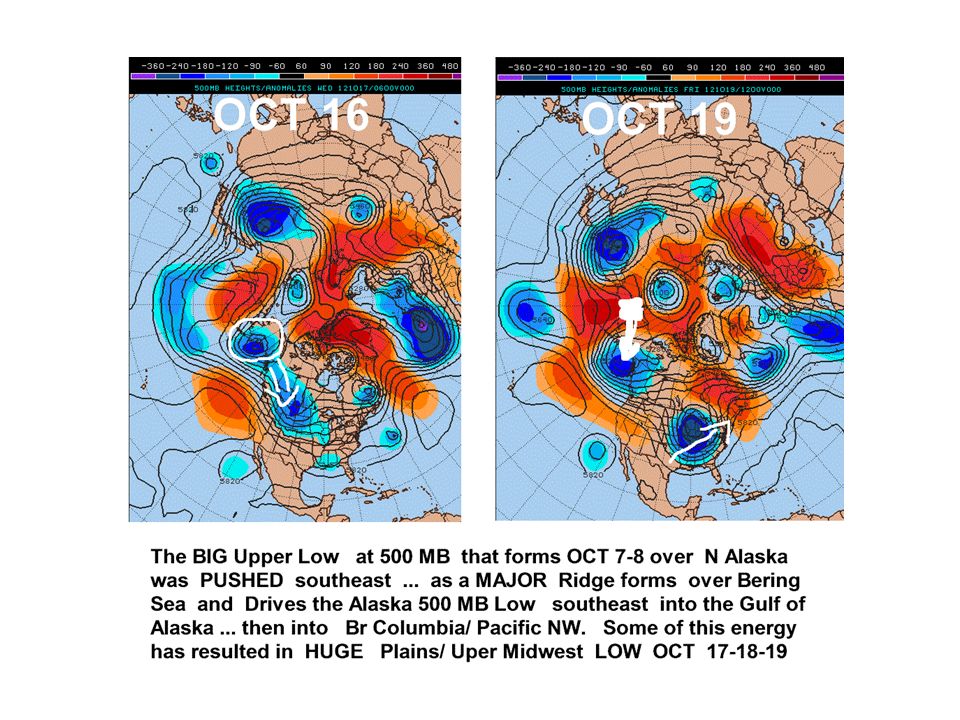
AUTUMN PATTERN 2012 (10/8/12) Very different pattern developing over N hemisphere Instead of Huge 50 Low/ vortex over Alaska & Bering sea … there are strong Positive Height anomalies … And trough over eastern half of the Conus
 Very different pattern developing over N hemisphere Instead of Huge 50 Low/ vortex over Alaska & Bering sea … there are strong Positive Height anomalies … And trough over eastern half of the Conus")
16
14 OCT 2012 (uh oh !!) Strong deep 500 lows appear to forming in GULF OF ALASKA and over N Slope of Alaska … kind of similar to Last year!! BUT NAO is negative AND the SSTA as I showed are VERY different in OCT 2012… LOOK how the pattern EVOLVES in the next slide

19
HEMISPHERIC PATTERN END OF OCT 2012 sure its 15 days out BUT we are not forecasting SPECIFIC track of low or say Hurricane Just the General pattern

20
AO plots in 2 nd half of OCT AO consistently NEGATIVE because of STRONG large areas of positive 500 MB anomalies AND … and.. The LACK..so far of a DEEP massive 500 mb over Arctic region

21
MAJOR increase in cold air build up over western and central and Northern Canada – somethignwe did NOT see in OCT and NOV 2011

22
MOST of the time COLD air outbreaks in OCT and NOV in the Eastern US is a BAD sign for those who want cold/ snowy winters….. WHY?... Because COLD in the east often means Ridge over West N America which means NO snow cover build up No cold air build over western Canada. But Here we see BIG time cold air build up over and EARLY snowfall in western Canada

23
#1 huge OMEGA BLOCK over Bering Sea / Alaska exact opposite of OCT / NOV 2011…#2 ECMWF has western based – NAO over far n central Canada … GFS has classic Text Book case over GREENLAND. #3 Deep early season Trough over Pac NW/ sw Canada means early snow Build up and major expansion of cold air supply in western Canada

24
NAO plots in 2 nd half of OCT NAO consistently

25
PNA plots in 2 nd half of OCT PNA consistently NEGATIVE because of STRONG 500 mb upper LOW over Gulf of Alaska

26
N HEMISPHERE PATTERN OCT 30

27
LETS TALK SNOW COVER

28
SNOW COVER IS SOME WHAT MISUNDERSTOOD 1.Having early season snowfall over Eurasia and far northern Canada FAVORS central & eastern US will see either Normal winter or a colder / snowy 2.But it does not guarantee it 3.Moreover there have plenty of cases of having near Normal snowfall over these areas and MILD / Below Normal snowfall over central and eastern Conus.

29
RED= Below Normal snowfall

30
OCT 15… ORANGE ACTUAL SNOWFALL …Blue = Above Normal Snow

32
http://www.agu.org/pubs/crossref/2012/2012GL051000.shtml SEA ICE

33
SO FAR SEA ICE BELOW NORMAL.. But again it is early

34
EL NINO … dying off fast but MOST Winter forecasts have been based on weak El Nino JULY forecast Plumes from Euro ensemble into the Winter

35
AUG forecast Plumes from Euro ensemble into the Winter SEPT forecast Plumes from Euro ensemble into the Winter

36
ENSO 3.4 now Below Min threshold for even Weak El Nino SOI bounced back to Neutral but -8 to -10 Min threshold for trigger El Nino

37
Here we can watch the El Nino collapse over 60 days from JUNE 12 – SEPT 12

38
LETS TAKE ABOUT THE CFS version 2.0 As a general rule over the last 20 years climate models have been pretty bad and next to useless. But CFSV2.0 is different. WHY? 1.The CFS model in an ensemble of 16 runs AND based on the last 14 days. 2.The MONTHLY Model is based on 10 day time increments. 3.As conditions change so does the CFS Model. Is that a good thing or bad ?

39
At end of APRIL the CFS for JUNE 2012… showing WET and cool over the midwest and hot over pacific NW.

40
At end of APRIL the CFS for JULY 2012… showing WET and cool over the midwest and hot over pacific NW. WHY? The CFS Models runs in the last 10 days of APRIL assumed El Nino for the Summer of 2012

41
But.. once the CFS saw El Nino breaking down.. The SOI stuck at Neutral… and the severe -PDO pattern the CFS did change BIG TIME. The CFS Models runs from last 10 days of MAY show EXTREME HEAT and DROUGHT 20 MAY - 29 MAY 2012

42
The CFS Models runs in the last 10 days of MAY also corrected for JULY 2012… and now showed HEAT and DROUGHT for the Midwest

43
CFS MODEL for DEC JAN FEB seem to be awfully warm This run for DEC 2012 based on the end of AUG AND El Nino still thriving

44
This run for JAN 2013 based on the end of AUG AND El Nino still thriving

45
This run for FEB 2013 based on the end of AUG AND El Nino still thriving

46
WEEKLY CFS Models runs.. Which are run EVERY DAY …so one can see the TRENDS … for the next 4 weeks shows western & central Canada turning VERY cold that moves into the Midwest & NE in week 3.. And more cold air over Western Canada in week 4

47
WEEKLY 500 MB jet Stream map week 3-4 NOTICE very strong Positive Height anomalies over Alaska/ Bering Sea AND over Greenland. This would… IF the model is correct… set up cold/ cool first half of NOV over Midwest and Northeast

48
The CFS Monthly forecast for NOV temps showed the BIG changes since 9 OCT to 17 OCT

49
The CFS Monthly forecast for NOV RAINFALL shows Midwest wet OCT 9 but now looks DRY

50
The CFS Models runs from OCT 6 to OCT 20.. Shows cold air over Canada in NOV and a VERY WARM WINTER Jan Feb March of 2013 !!! But with all the Big changes happening over last 2-3 weeks new runs of CFS Likely to be Much colder

51
WHAT ABOUT ANALOG YEARS For those that do NOT know what we mean by ANALOG years in the weather biz… the term refers to the method of looking at SEVERAL key parameters in the atmospheric then searching past (climate) for similar conditions. The idea here is to give the forecast clues or TRENDS about what the upcoming season will look like. SOMETIMES the analog works.. MOSTLY for stable patterns. For example the Winters of 2009-10 and 2010-11. But there are 2 BIG caveats here.

52
1.You have to Key or focus on the correct parameters. For example to key in on El Nino winters when you have say for example La Nina means you analog season will be worthless 2.ANALOG forecasting only works IF.. and ONLY IF… conditions are STABLE 3.Look at this Past SUMMER… It was ASSUMED by most seasonal forecasters that the El Nino would Kick in at SOME point and turn the pattern wetter and cooler over the Midwest and Plains. But as we know now El Nino pattern never developed WHAT ABOUT ANALOG YEARS

53
As of 15 OCT 2012… EVERYTHING hemispherically is in a state of FLUX. El Nino GONE Negative PDO which was Historically EXTREME DEC 2011 to SEPT 2012.. is almost gone prolonged sustained +AO at times near record Positive Values.. GONE Re-emergence of Strong positive 500 MB anomalies across Arctic & high latitude Since Mid Sept… increasing each week Strong -NAO signatures There is ONE parameter that has NOT changed over the past 2-3 months…… WHAT ABOUT ANALOG YEARS

54
the QBO quasi-biennial oscillation (QBO) is high level wind at the very top of the atmosphere ( 30 mb) that exists over the Equator that oscillates from East (negative QBO) to West ( Positive QBO). A full cycle can take anywhere from 18 to 30 months. The strongest Positive values are usually around +15.00 or so while the strongest Negative values will exceed -25.00 or so. The QBO winds work there way down to into the Lower levels and affect weather patterns. http://en.wikipedia.org/wiki/Quasi-biennial_oscillation LINK FOR ACTUAL QBO DATA http://www.esrl.noaa.gov/psd/data/correlation/qbo.data WHAT ABOUT ANALOG YEARS THE QBO

55
JAN 2012 -16.07 FEB 2012 -15.25 MARCH 2012 -16.74 APRIL 2012… -17.62 MAY 2012… -22.04 JUNE 2012…. -25.89 JULY 2012… -27.82 AUG 2012… -27.93 SEPT 2012… -26.60 QBO is beginning to weaken OCT 2012 ?? Data comes out 11/5/12 NOV 2012 ??? Data comes out 12/5/12 WHAT ABOUT ANALOG YEARS THE QBO strongly POSITIVE QBO values correlate to Non Blocking weather patterns in the Jet stream And strongly Negative QBO values in the cold season Months = +AO and +NAO patterns BUT… QBO values that are weak (-10 to +10) strongly favor Blocking patterns over N Hemisphere in the cold season months ( NDJFM) So… ASSUMING the OCT QBO values ( comes out 11/5/12) will be rising (moving to zero) and that trend continues for NOV values ( comes out 12/5/12) … what will the QBO be like in DJFM??
 strongly favor Blocking patterns over N Hemisphere in the cold season months ( NDJFM) So… ASSUMING the OCT QBO values ( comes out 11/5/12) will be rising (moving to zero) and that trend continues for NOV values ( comes out 12/5/12) … what will the QBO be like in DJFM .")
56
WHAT ABOUT ANALOG YEARS THE QBO HIGH Probability that OCT values will be -20 to -25 and NOV values between -15 to -20.. But again this is FORECAST/ assumption This IMPLIES that QBO will be moving towards ZERO during JAN …FEB MARCH 2013. SOOOOOO.. Lets look at ALL the QBO autumns with strongly - QBO values that rose to -10 or high (towards 0). 2003-04 1996-97 1989-90 1984-85 1979-80 1970-71 but 1997-98 was strong EL NINO winter and we know that is NIT going to happen THIS coming winter so lets drop it QBO ANALOG WINTERS 2003-04 1989-90 1984-85 1979-80 1970-71
 but was strong EL NINO winter and we know that is NIT going to happen THIS coming winter so lets drop it QBO ANALOG WINTERS")
63
SUMMARY OF MY EARLY IDEAS for WINTER 2012-13 ANY and ALL Winter forecast issued by ANYONE or any private weather company before OCT 1.. Now is worthless Bravo Sierra. NOV cold in western Canada a good thing Lack of Sea seems to be helping high latitude Blocking So far this Autumn Upper air patterns looking NOTHING like -PDO weakening fast.. Total collapse OR staying weak? DEC warmest of the 3 months But western third of US DEC will be coldest and snowiest of the DJF Strong signals JAN FEB Much colder than last winter and far MORE active for everyone Noreaster Potential COULD be High

67
STARTING NOV 1… wxrisk.com Will be using the Prof Zielinksi WINTER STORM INDEX SCALE this is a proven well research INDEX that can be used all around the country. I will be posting more about it on the web site soon And S.E.C.S. --(SEX) Significant East Cost Snowstorm newsletter a subscription service… with 2 levels of coverage BASIC and ADVANCED
 Significant East Cost Snowstorm newsletter a subscription service… with 2 levels of coverage BASIC and ADVANCED.")
Similar presentations


 EXTREME OR NOT EXTREME THAT IS THE QUESTION !!!!>")


, Brian Hoskins.>")
 – current and future state ENSO phase composites for upcoming winter temperature precipitation Climate Prediction.>")


 The Arctic Oscillation: Opposing atmospheric pressure patterns in northern middle and high latitudes. “Positive phase in which.>")


 is an index derived from North Pacific sea surface temperature anomalies and it has a high correlation to.>")
 Mean Upper Air Composites From Past Winters.>")
: A 40- to 60-day period of alternately strong or weak trade winds that normally blow west. It.>")