Download presentation
Presentation is loading. Please wait.

1
More Inclusion than Diversion: Expansion, Differentiation, and Market Structure in Higher Education Richard Arum, New York University, USA Adam Gamoran, University of Wisconsin, USA Yossi Shavit, Tel Aviv University, Israel …..with thanks to our colleagues from 15 countries

2
From Chapter 1 and selected chapters in… Available from Stanford University Press and amazon.com

3
Higher Education Expansion The 20 th century: an era of educational expansion More people staying in school longer and longer World-wide expansion, involving developed and developing countries

4
Higher Education Expansion The key question for sociologists: How does expansion affect inequality? Does expansion reduce inequality by providing more opportunities for the disadvantaged? Or does expansion exacerbate inequality by creating more opportunities for the privileged?

5
Higher Education Expansion Expansion of higher education deserves special attention Primary and secondary education are nearly universal in advanced societies Tertiary education continues to expand Higher education is the gateway to professional and management positions

6
Higher Education Expansion Higher education is transformed as it expands Expansion is accompanied by differentiation Development of less selective colleges Much of the growth occurs in the second tier Expansion creates new opportunities, but possibility of diminished value

7
Higher Education Expansion One view: Higher education expansion is a process of diversion Working class are diverted to the second tier Elite institutions remain the bastion of the privileged Another view: Expansion reflects inclusion Working class have a chance for the top tier Even the second tier enhances opportunity

8
The Comparative Project on Stratification in Higher Education How are expansion and stratification linked in 15 countries? Western Europe: France, Italy, Germany, Netherlands, Sweden, Switzerland, UK Eastern Europe: Russia, Czech Republic East Asia: Japan, Korea, Taiwan Others: Israel, US, Australia

9
Expansion and Stratification Educational attainment as a sequence of transitions (Mare, 1980, 1981) Expansion brings many advantages (e.g., economic development), but it does not necessarily reduce inequality Middle class families take advantage of new opportunities Relative differences between classes are preserved
 Expansion brings many advantages (e.g., economic development), but it does not necessarily reduce inequality Middle class families take advantage of new opportunities Relative differences between classes are preserved")
10
Expansion and Stratification Maximally Maintained Inequality (MMI) (Raftery and Hout, 1993) Inequality is preserved until the privileged class reaches saturation That is, virtually all members of the privileged class attain a level of education Only then does inequality in attainment of that level decline
 (Raftery and Hout, 1993) Inequality is preserved until the privileged class reaches saturation That is, virtually all members of the privileged class attain a level of education Only then does inequality in attainment of that level decline")
11
Expansion and Stratification With some exceptions, observed trends are consistent with MMI Persistent Inequality (Shavit and Blossfeld, 1993)
")
12
Expansion and Differentiation Most studies of educational transitions ignore differentiation In fact, educational choices often involve more than two options E.g., drop out of high school, or remain in an academic or a vocational track Or attend 2-year, 4-year, or no college These distinctions have implications for inequality

13
Differentiation and Stratification Organization theory: growth is accompanied by differentiation Educational expansion tends to follow this path Differentiation may be a consequence of expansion, but it may also contribute to expansion

14
Expansion and Differentiation Modes of differentiation Unified: No differentiation Tend to be rigid, controlled by professorial elites who tend not to encourage expansion Italy, Czech Republic Diversified: multiple tiers, e.g. U.S., Japan Binary: two tiers – academic and vocational Most of western Europe

15
Expansion and Differentiation Link between expansion and differentiation suggests a process of diversion But if lower-tier opportunities bring students into higher education who otherwise would not have continued, then it may represent inclusion

16
Expansion and Market Structure Studies of expansion and stratification assume expansion is a result of demand Holds for some cases, e.g. the U.S. But not others Western Europe – state regulation Sweden – quotas Japan – shifting patterns of demand and supply

17
Expansion and Market Structure One view: inequality may be greater in demand than in supply systems Supply systems may limit inequality through state sponsorship Demand systems may exacerbate inequality due to family differences in the ability to pay

18
Expansion and Market Structure Another view: Inequality may be less in demand systems than in supply systems In supply systems, institutions are status-seekers They seek to preserve privileges for the elite In demand systems, institutions are client-seekers, because funding depends on enrollment More emphasis on bringing students into the postsecondary system By this logic, demand-based systems may be increasingly inclusive, while diversion occurs in supply systems

19
Propositions Expansion and stratification 1. Expansion is not associated with inequality, unless saturation is approached (MMI). Expansion and differentiation 2. Tertiary expansion and differentiation are related, with causal effects in both directions. 3. Differentiation of higher education diverts students away from first-tier enrollment.
. Expansion and differentiation 2. Tertiary expansion and differentiation are related, with causal effects in both directions. 3. Differentiation of higher education diverts students away from first-tier enrollment..")
20
Propositions Expansion, differentiation, and market structure 4. Enrollment rates are higher in systems with more funding from private sources. 5. Systems with more funding from private sources are more likely to be diversified. 6. Reliance on private funding is associated with inequality, but the direction of the association cannot be determined a priori.

21
Methods Collaborative comparative method Countries that vary in: Extent of expansion Mode of differentiation Degree of privatization

22
Methods Logit regressions on Eligibility for higher education Entry into higher education Entry into first-tier higher education

23
Methods Independent variables Parents education Fathers occupational class Sex Supplementary analyses with additional predictors as appropriate

24
Methods Comparative analyses Mode of differentiation: Taken from country- specific chapters

25
Country Mode of Differentiation BritainBinary FranceBinary GermanyBinary NetherlandsBinary RussiaBinary SwitzerlandBinary IsraelDiversified JapanDiversified KoreaDiversified SwedenDiversified TaiwanDiversified United StatesDiversified AustraliaMixed/Other Czech RepublicUnified ItalyUnified

26
Methods Comparative analyses Mode of differentiation: Taken from country-specific chapters Extent of privatization: From OECD reports and supplementary reports Measures of inequality: average logit coefficients Fathers occupation: classes I/II vs. V/VI Parents education: Higher education vs. secondary education We focus on changes over the last two cohorts

27
Results Expansion occurred at all levels Eligible for higher ed, entered higher ed, attended higher ed All countries experienced expansion, except Russia in the post-Soviet era

29
See chapter 7, Roksa, Grodsky, Arum, and Gamoran, Changes…U.S.

30
See chapter 8, Cheung and Edgerton, Great Britain:…

31
See chapter 6, Tsai and Shavit, Higher education in Taiwan.

32
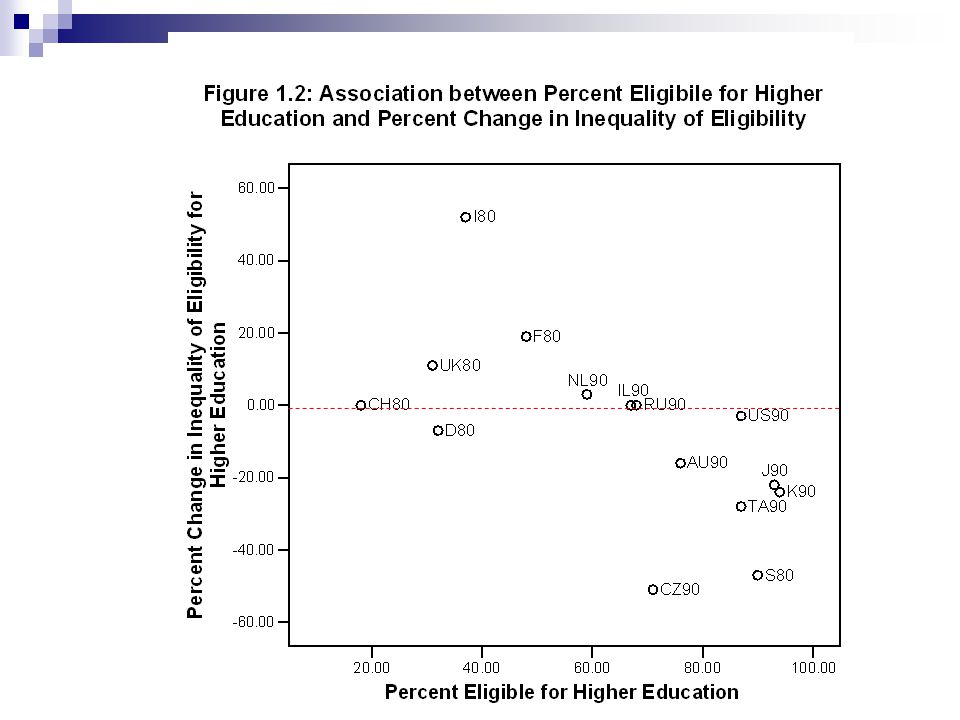
Results Inequality is stable except in the context of saturation Eligibility Inequality declined in 5 countries, of which 4 had eligibility > 80 percent (near saturation) Inequality did not decline in 10 countries; all but one or two had lower enrollment rates
 Inequality did not decline in 10 countries; all but one or two had lower enrollment rates")
35
Results: Expansion and Stratification Inequality is stable except in the context of saturation Attendance at higher education Three cases of saturation, two experienced declining inequality

38
Results: Expansion and Stratification Inequality is stable except in the context of saturation Attendance at higher education Inequality declined in four cases Two were near saturation (Israel and Italy) Japan and Taiwan are exceptions Rapid expansion in the 1990s after a period of retrenchment in the 1980s
 Japan and Taiwan are exceptions Rapid expansion in the 1990s after a period of retrenchment in the 1980s")
40
Results: Expansion and Stratification Inequality is stable except in the context of saturation In general, MMI is supported

41
Results: Expansion and Differentiation Eligibility rates vary by mode of differentiation

42
(1)(2)(3)(4)(5)(6) Mode of Differentiation n Percent Eligible Percent Attend Percent Attend First Tier Inequality in Eligibility Inequality in Higher Education Inequality in First Tier Binary6 Diversified6 Unified2 Total14
(2)(3)(4)(5)(6) Mode of Differentiation n Percent Eligible Percent Attend Percent Attend First Tier Inequality in Eligibility Inequality in Higher Education Inequality in First Tier Binary6 Diversified6 Unified2 Total14")
43
(1)(2)(3)(4)(5)(6) Mode of Differentiation n Percent Eligible Percent Attend Percent Attend First Tier Inequality in Eligibility Inequality in Higher Education Inequality in First Tier Binary6 42.330.712.2 (18.2)(7.6)(5.0) Diversified6 86.351.824.2 (9.9)(10.0)(2.2) Unified2 54.026.5 (24.0)(10.6) Total14 62.839.119.0 (26.0)(14.2)(8.1)
(2)(3)(4)(5)(6) Mode of Differentiation n Percent Eligible Percent Attend Percent Attend First Tier Inequality in Eligibility Inequality in Higher Education Inequality in First Tier Binary (18.2)(7.6)(5.0) Diversified (9.9)(10.0)(2.2) Unified (24.0)(10.6) Total (26.0)(14.2)(8.1)")
44
(1)(2)(3)(4)(5)(6) Mode of Differentiation n Percent Eligible Percent Attend Percent Attend First Tier Inequality in Eligibility Inequality in Higher Education Inequality in First Tier Binary6 42.330.712.2 (18.2)(7.6)(5.0) Diversified6 86.351.824.2 (9.9)(10.0)(2.2) Unified2 54.026.5 (24.0)(10.6) Total14 62.839.119.0 (26.0)(14.2)(8.1)
(2)(3)(4)(5)(6) Mode of Differentiation n Percent Eligible Percent Attend Percent Attend First Tier Inequality in Eligibility Inequality in Higher Education Inequality in First Tier Binary (18.2)(7.6)(5.0) Diversified (9.9)(10.0)(2.2) Unified (24.0)(10.6) Total (26.0)(14.2)(8.1)")
45
(1)(2)(3)(4)(5)(6) Mode of Differentiation n Percent Eligible Percent Attend Percent Attend First Tier Inequality in Eligibility Inequality in Higher Education Inequality in First Tier Binary6 42.330.712.2 (18.2)(7.6)(5.0) Diversified6 86.351.824.2 (9.9)(10.0)(2.2) Unified2 54.026.5 (24.0)(10.6) Total14 62.839.119.0 (26.0)(14.2)(8.1)
(2)(3)(4)(5)(6) Mode of Differentiation n Percent Eligible Percent Attend Percent Attend First Tier Inequality in Eligibility Inequality in Higher Education Inequality in First Tier Binary (18.2)(7.6)(5.0) Diversified (9.9)(10.0)(2.2) Unified (24.0)(10.6) Total (26.0)(14.2)(8.1)")
46
(1)(2)(3)(4)(5)(6) Mode of Differentiation n Percent Eligible Percent Attend Percent Attend First Tier Inequality in Eligibility Inequality in Higher Education Inequality in First Tier Binary6 42.330.712.21.0 (18.2)(7.6)(5.0)(.49) Diversified6 86.351.824.2.77 (9.9)(10.0)(2.2)(.29) Unified2 54.026.5.92 (24.0)(10.6) (.71) Total14 62.839.119.0.90 (26.0)(14.2)(8.1)(.43)
(2)(3)(4)(5)(6) Mode of Differentiation n Percent Eligible Percent Attend Percent Attend First Tier Inequality in Eligibility Inequality in Higher Education Inequality in First Tier Binary (18.2)(7.6)(5.0)(.49) Diversified (9.9)(10.0)(2.2)(.29) Unified (24.0)(10.6) (.71) Total (26.0)(14.2)(8.1)(.43)")
47
(1)(2)(3)(4)(5)(6) Mode of Differentiation n Percent Eligible Percent Attend Percent Attend First Tier Inequality in Eligibility Inequality in Higher Education Inequality in First Tier Binary6 42.330.712.21.0 (18.2)(7.6)(5.0)(.49) Diversified6 86.351.824.2.77 (9.9)(10.0)(2.2)(.29) Unified2 54.026.5.92 (24.0)(10.6) (.71) Total14 62.839.119.0.90 (26.0)(14.2)(8.1)(.43)
(2)(3)(4)(5)(6) Mode of Differentiation n Percent Eligible Percent Attend Percent Attend First Tier Inequality in Eligibility Inequality in Higher Education Inequality in First Tier Binary (18.2)(7.6)(5.0)(.49) Diversified (9.9)(10.0)(2.2)(.29) Unified (24.0)(10.6) (.71) Total (26.0)(14.2)(8.1)(.43)")
48
(1)(2)(3)(4)(5)(6) Mode of Differentiation n Percent Eligible Percent Attend Percent Attend First Tier Inequality in Eligibility Inequality in Higher Education Inequality in First Tier Binary6 42.330.712.21.00.99 (18.2)(7.6)(5.0)(.49)(.30) Diversified6 86.351.824.2.77.80 (9.9)(10.0)(2.2)(.29)(.26) Unified2 54.026.5.92.85 (24.0)(10.6) (.71)(.33) Total14 62.839.119.0.90.88 (26.0)(14.2)(8.1)(.43)(.28)
(2)(3)(4)(5)(6) Mode of Differentiation n Percent Eligible Percent Attend Percent Attend First Tier Inequality in Eligibility Inequality in Higher Education Inequality in First Tier Binary (18.2)(7.6)(5.0)(.49)(.30) Diversified (9.9)(10.0)(2.2)(.29)(.26) Unified (24.0)(10.6) (.71)(.33) Total (26.0)(14.2)(8.1)(.43)(.28)")
49
(1)(2)(3)(4)(5)(6) Mode of Differentiation n Percent Eligible Percent Attend Percent Attend First Tier Inequality in Eligibility Inequality in Higher Education Inequality in First Tier Binary6 42.330.712.21.00.991.6 (18.2)(7.6)(5.0)(.49)(.30)(1.21) Diversified6 86.351.824.2.77.801.3 (9.9)(10.0)(2.2)(.29)(.26)(.99) Unified2 54.026.5.92.85 (24.0)(10.6) (.71)(.33) Total14 62.839.119.0.90.881.4 (26.0)(14.2)(8.1)(.43)(.28)(1.01)
(2)(3)(4)(5)(6) Mode of Differentiation n Percent Eligible Percent Attend Percent Attend First Tier Inequality in Eligibility Inequality in Higher Education Inequality in First Tier Binary (18.2)(7.6)(5.0)(.49)(.30)(1.21) Diversified (9.9)(10.0)(2.2)(.29)(.26)(.99) Unified (24.0)(10.6) (.71)(.33) Total (26.0)(14.2)(8.1)(.43)(.28)(1.01)")
50
(1)(2)(3)(4)(5)(6) Mode of Differentiation n Percent Eligible Percent Attend Percent Attend First Tier Inequality in Eligibility Inequality in Higher Education Inequality in First Tier U.S. 87.058.025.01.161.291.23 Diversified6 86.351.824.2.77.801.3 (9.9)(10.0)(2.2)(.29)(.26)(.99) Total14 62.839.119.0.90.881.4 (26.0)(14.2)(8.1)(.43)(.28)(1.01)
(10.0)(2.2)(.29)(.26)(.99) Total (26.0)(14.2)(8.1)(.43)(.28)(1.01).")
51
(1)(2)(3)(4)(5)(6) Mode of Differentiation n Percent Eligible Percent Attend Percent Attend First Tier Inequality in Eligibility Inequality in Higher Education Inequality in First Tier U.K. 31.121.114.91.08.951.15 Binary6 42.330.712.21.00.991.6 (18.2)(7.6)(5.0)(.49)(.30)(1.21) Total14 62.839.119.0.90.881.4 (26.0)(14.2)(8.1)(.43)(.28)(1.01)
(7.6)(5.0)(.49)(.30)(1.21) Total (26.0)(14.2)(8.1)(.43)(.28)(1.01).")
52
(1)(2)(3)(4)(5)(6) Mode of Differentiation n Percent Eligible Percent Attend Percent Attend First Tier Inequality in Eligibility Inequality in Higher Education Inequality in First Tier U.S. 87.058.025.01.161.291.23 Diversified6 86.351.824.2.77.801.3 (9.9)(10.0)(2.2)(.29)(.26)(.99) U.K. 31.121.114.91.08.951.15 Binary6 42.330.712.21.00.991.6 (18.2)(7.6)(5.0)(.49)(.30)(1.21) Total14 62.839.119.0.90.881.4 (26.0)(14.2)(8.1)(.43)(.28)(1.01)
(10.0)(2.2)(.29)(.26)(.99) U.K Binary (18.2)(7.6)(5.0)(.49)(.30)(1.21) Total (26.0)(14.2)(8.1)(.43)(.28)(1.01).")
53
Results: Expansion and Differentiation Eligibility rates vary by mode of differentiation Proposition 2 is supported: Differentiation and expansion are related Proposition 3 is largely refuted: Differentiation does not necessarily lead to diversion

54
Results: Expansion and Market Structure Countries with larger private sectors have higher levels of enrollment Consistent with Proposition 4

56
Results: Expansion and Market Structure Market structure is also related to differentiation More privatized systems tend to be more differentiated Consistent with Proposition 5

57
Mode Of Differentiation Tertiary Education Reliance On Private Sector Funding LowModerateHigh UnifiedItaly Czech Republic BinaryGermany Russia Switzerland Britain Netherlands France Diversified SwedenIsrael Taiwan Japan Korea United States

58
Results: Expansion and Market Structure How does privatization relate to inequality? Proposition 6: We could not predict the direction of association Zero-order correlation =.03 Absence of correlation masks contradictory patterns of association

59
Percent Private Sector Funding Percent Higher Education Attendance Inequality in Higher Education Attendance.67

60
Percent Private Sector Funding Percent Higher Education Attendance Inequality in Higher Education Attendance.67.31

61
Percent Private Sector Funding Percent Higher Education Attendance Inequality in Higher Education Attendance.67 -.43.31

62
Results: Expansion and Market Structure So the direct effects of privatization are to increase inequality, presumably due to family differences in the ability to pay But this is mitigated because privatization also stimulates growth, which is associated with lower levels of inequality

63
Summary of Results Proposition 1 (MMI): Supported Proposition 2 (Expansion and differentiation): Supported Proposition 3 (Differentiation and diversion): Supported for binary systems but not for diversified systems.
: Supported Proposition 2 (Expansion and differentiation): Supported Proposition 3 (Differentiation and diversion): Supported for binary systems but not for diversified systems.")
64
Summary of Results Proposition 4 (Privatization and expansion): Supported Proposition 5 (Privatization and differentiation): Supported Proposition 6: Privatization and inequality: The relationship is complex
: Supported Proposition 5 (Privatization and differentiation): Supported Proposition 6: Privatization and inequality: The relationship is complex")
65
Summary of Results Overall: We find more evidence of inclusion than diversion Expansion leads to declining inequality when saturation is approached Differentiation can be inclusive, without a corresponding increase in inequality Expansion is itself a form of inclusion, even when odds ratios are stable

66
Inclusion and persistent inequality The claim that expansion is inclusive even with stable odds ratios gives a new interpretation to familiar findings Not just persistent inequality Other things being equal, expansion should result in greater inequality due to increased heterogeneity In this sense, stable odds ratios are inclusive

67
Inclusion and persistent inequality Empirically, our findings generally mirror those of Persistent Inequality Only post-Soviet Russia exhibited increasing inequality Of four cases of declining odds ratios, two may be explained by saturation (Israel and Italy) and two by rapid expansion following consolidation (Taiwan and Japan) These findings post-date Persistent Inequality
 and two by rapid expansion following consolidation (Taiwan and Japan) These findings post-date Persistent Inequality")
68
Inclusion and persistent inequality Education is not merely a positional good, whose value depends on relative allocation Value also lies in human capital, civic participation And in absolute level relative to other countries Educational expansion increasingly offers those from disadvantaged backgrounds national and global citizenship

69
Key References Mare, R. D. (1980). Social background and school continuation decisions. Journal of the American Statistical Association, 75, 295-305. Mare, R. D. (1981). Change and stability in educational stratification. American Sociological Review, 46, 72-87. Raftery, A. E., and Hout, M. (1993). Maximally maintained inequality: Expansion, reform, and opportunity in Irish education, 1921-1975. Sociology of Education, 66, 41-62. Shavit, Y., and Blossfeld, H.-P. (1993). Persistent inequality: Changing educational attainment in 13 countries. Boulder, CO: Westview Press. Shavit, Y., Arum, R., and Gamoran, A., with Menahem, G. (2007). Stratification in higher education: A comparative study. Stanford, CA: Stanford University Press.
. Change and stability in educational stratification. American Sociological Review, 46, Raftery, A. E., and Hout, M. (1993). Maximally maintained inequality: Expansion, reform, and opportunity in Irish education, Sociology of Education, 66, Shavit, Y., and Blossfeld, H.-P. (1993). Persistent inequality: Changing educational attainment in 13 countries. Boulder, CO: Westview Press. Shavit, Y., Arum, R., and Gamoran, A., with Menahem, G. (2007). Stratification in higher education: A comparative study. Stanford, CA: Stanford University Press..")
Similar presentations


 Grants Chapter 6.>")