Download presentation
Presentation is loading. Please wait.

1
The Social Value of Education Robert Topel University of Chicago

2
Economists (and others) have generally had little success in estimating the social effects of different investments, and, unfortunately, education is no exception. Becker, Human Capital (1975)
.")
3
Social vs. Private Returns The private, monetary return to education is one of the most widely studied empirical magnitudes in economics –Consensus: returns are substantial –Appx. 8-15% per year of schooling –4 years of college raises earnings by about 65%, or a return of over 13%/year Why is public funding virtually universal?

4
Externalities When education of one individual confers external benefits (costs) on others, there is a positive economic case for encouraging (discouraging) education Private return to schooling may understate the full social benefit of education
 on others, there is a positive economic case for encouraging (discouraging) education Private return to schooling may understate the full social benefit of education")
5
A Taxonomy Private = Social –Education benefits only the individual –No compelling case for public participation Private < Social –Individuals education benefits others –Public expenditure can enhance efficiency Private > Social –Education merely redistributes from poor to rich

6
Elements of Private Returns Increased individual market productivity Improved non-market productivity –Home productivity –Consumption decisions –Production of childrens human capital Improved health & longevity Education as consumption –Enables consumption of HK goods (ideas) –Matching & assortive mating
 –Matching & assortive mating")
7
Elements of Social Returns Private < Social Social network externalities in production –Education raises the level of economic activity by more than its private return Education & economic growth –The level of education raises economic growth because educated people produce ideas External benefits through social programs –Health –Other income transfers –Equity as a public good

8
Private < Social (Cont) Crime Network externalities in consumption Voting Other 2 nd best considerations –Distorted incentives to invest –Progressive taxes –Artificial compression of skill differentials
 Crime Network externalities in consumption Voting Other 2 nd best considerations –Distorted incentives to invest –Progressive taxes –Artificial compression of skill differentials")
9
Elements of Social Returns Private > Social Signaling value of education –Education as a screening device –Private value as a signal, even if no impact on productivity –No social gain

10
Measuring Private Returns: A Primer To calibrate social returns, we need a benchmark estimate of the size of private returns Micro-data on wages, schooling, experience Assume: – only cost is foregone earnings – % increase constant over lifetime Rate of return is % increase in earnings

11
Measuring Private Returns (cont) lnW i = X i β + S i ρ + ε i –S i is years of schooling for person i –ρ is private monetary rate of return Versions estimated world-wide –Returns 5-15% –Comparable to returns on other risky assets –Sources of bias empirically unimportant
 lnW i = X i β + S i ρ + ε i –S i is years of schooling for person i –ρ is private monetary rate of return Versions estimated world-wide –Returns 5-15% –Comparable to returns on other risky assets –Sources of bias empirically unimportant")
12
Difference in Log Average Wages: College and High School Graduates, 1963-2000

13
Changes in the Price of Skill

14
Rising Returns: Implications for Social Policy Rising returns => increased scarcity of skills Social policies that combat inequality may exacerbate the problem –Artificial compression of wage distribution –Tax policies –Income redistribution Paradox: Public expenditure as 2 nd Best solution to encourage investment –Sweden –Australia

15
Sweden: Reduced Returns & Reduced Investment

16
Response of Investment

17
Educational Externalities Private returns as a benchmark –E.g. if private (Mincerian) return to a year of schooling is 10%, does the social return exceed 10%? What are the sources of social returns? How could we measure them? Focus here: productivity and income
 return to a year of schooling is 10%, does the social return exceed 10%. What are the sources of social returns. How could we measure them. Focus here: productivity and income.")
18
Sources of Externalities Higher level of productivity –E.g. Lucas (1988)productive ideas from social interactions –Productivity of cities –Growth of education leads to growth in output –Growth effect exceeds private return Higher growth of productivity –Education as producer of ideas –Level of education leads to growth of output
productive ideas from social interactions –Productivity of cities –Growth of education leads to growth in output –Growth effect exceeds private return Higher growth of productivity –Education as producer of ideas –Level of education leads to growth of output.")
19
Growth Accounting and Social Returns Output per worker in country j With CRS

20
Schooling and Growth Tractable model of schooling and growth is the social return to schooling: private plus external benefits Is the impact of schooling on national output larger than its impact on individual?

23
Alternative Approach: States and Cities Does greater average education in an area raise individual earnings, after controlling for individual education? Is ? If yes, then taken as evidence of external benefits from education Estimates are all over the map

24
StudyData Geogr. Unit InstrumentβEβE Rauch (1993) Census 1980 SMSAOLS2.8- 5.1% Acemoglu and Angrist (2000) Census 1950-1990 State Compulsory Schooling Laws, Quarter of Birth 0.4% Moretti (various) NLSY 1979, Census 1980-1990 SMSA Age Structure, Land Grant College, Plant opening 20- 25% *
 Census 1980 SMSAOLS % Acemoglu and Angrist (2000) Census State Compulsory Schooling Laws, Quarter of Birth 0.4% Moretti (various) NLSY 1979, Census SMSA Age Structure, Land Grant College, Plant opening % *.")
25
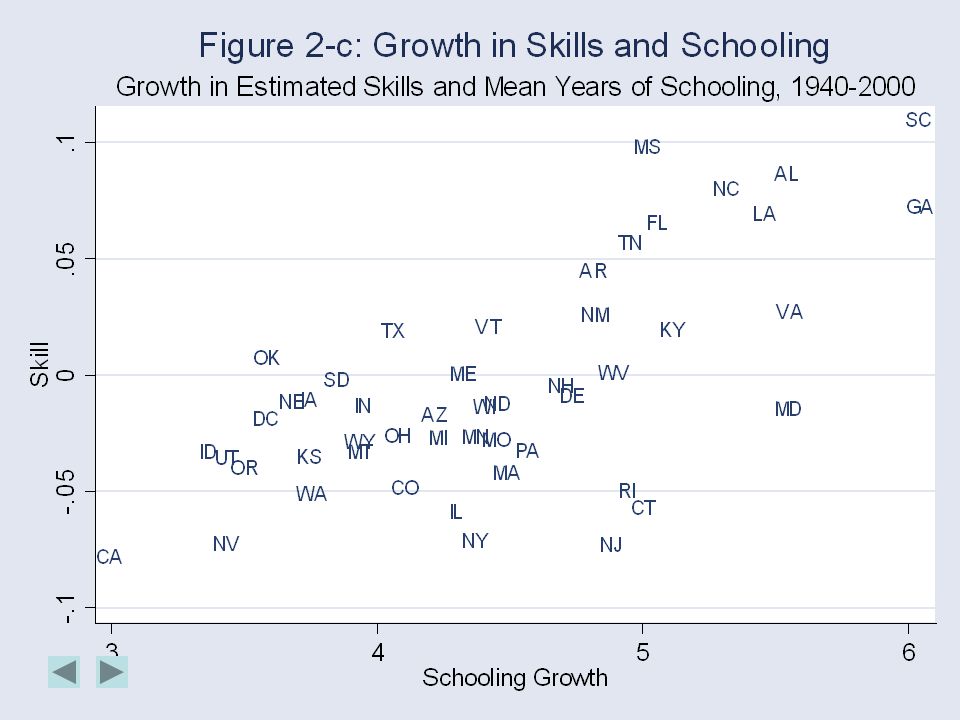
Education and Growth of States Relative growth of U.S. statespattern of convergence Two issues –Has growth in education contributed to economic growth of states? (Yes) –Has growth of education produced spillovers that raised total productivity by more than the private returns to schooling? (Maybe)
 –Has growth of education produced spillovers that raised total productivity by more than the private returns to schooling. (Maybe).")
27
IV: (1950-2000, using 1940 values) -0.62 (0.08)
 (0.08)")
28
IV: (1950-2000, using 1940 values) -0.83 (0.05)
 (0.05)")
30
OLS: 0.22 (0.03)
")
32
Interpretation of the Evidence Data suggest that education drives growth, and that social return substantially exceeds the private return Yet growth in education may be correlated with other, unmeasured, factors that contribute to productivity –Unobserved talent –Changes in demand for skills –Quality of education

33
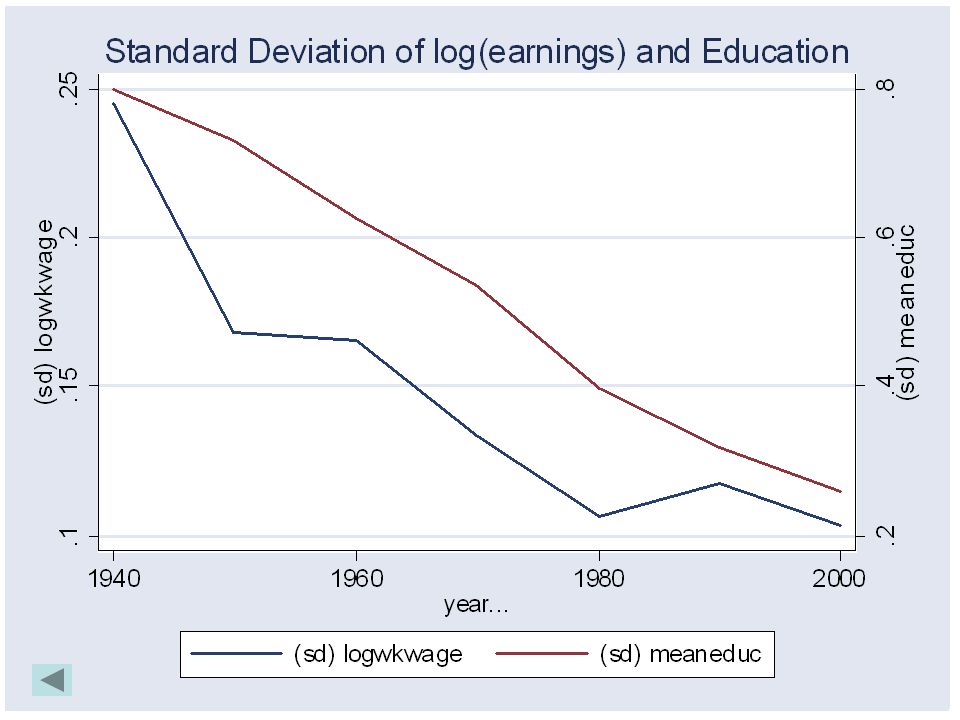
Deeper Look at the Data Isolate Total Factor Productivity as local effect on wages Control for environmental factors affecting skills of workers using state of birth –Controls for differences in skills or quality by birth state and cohort

34
2-Stage Analysis First Stage: (X= Education and Experience Indicators) Second Stage:
 Second Stage:")
37
Education and Productivity Growth: U.S. States 1940-2000 10 yr growth20 yr growth30 yr growth60 yr growth.046 (.017).026 (.018).068 (.019).040 (.021).067 (.017).036 (.020).081 (.021).023 (.024) 1.23 (0.44) 1.08 (0.40) 1.01 (0.34) 1.35 (0.38) R2R2.894.897.952.954.978.980.248.415 Includes Year FE. No overlapping periods. Figures
.026 (.018).068 (.019).040 (.021).067 (.017).036 (.020).081 (.021).023 (.024) 1.23 (0.44) 1.08 (0.40) 1.01 (0.34) 1.35 (0.38) R2R Includes Year FE. No overlapping periods. Figures.")
38
Social Returns to Schooling: Where Do We Stand Evidence for excess social returns is, at best, mixed –Impact of education on TFP is greatly reduced when growth of other skills is accounted for But evidence does indicate that social returns in economic growth are at least as large as private ones –Important contributor to convergence in incomes and welfare

39
Other Issues Local investments in higher education Empirical evidence on the signaling hypothesis

Similar presentations