Download presentation
Presentation is loading. Please wait.

1
Update on Smoke and Air Quality Issues Kara Paintner – March 2008

2
Exceptional Events Rule – use by North Carolina EPA Rule and Policy Changes related to fire Fire Air Coordination Team – who are they and what are they doing Questions

3
Ways that Smoke is Regulated Nuisance Visibility – Regional Haze Rule Health – National Ambient Air Quality Standards (NAAQS)
")
4
Interim Policy for Air Quality from Prescribed and Wildland Fire (1998) Defines what a Smoke Management Program (SMP) looks like Two levels – Basic and Enhanced
 Defines what a Smoke Management Program (SMP) looks like Two levels – Basic and Enhanced")
5
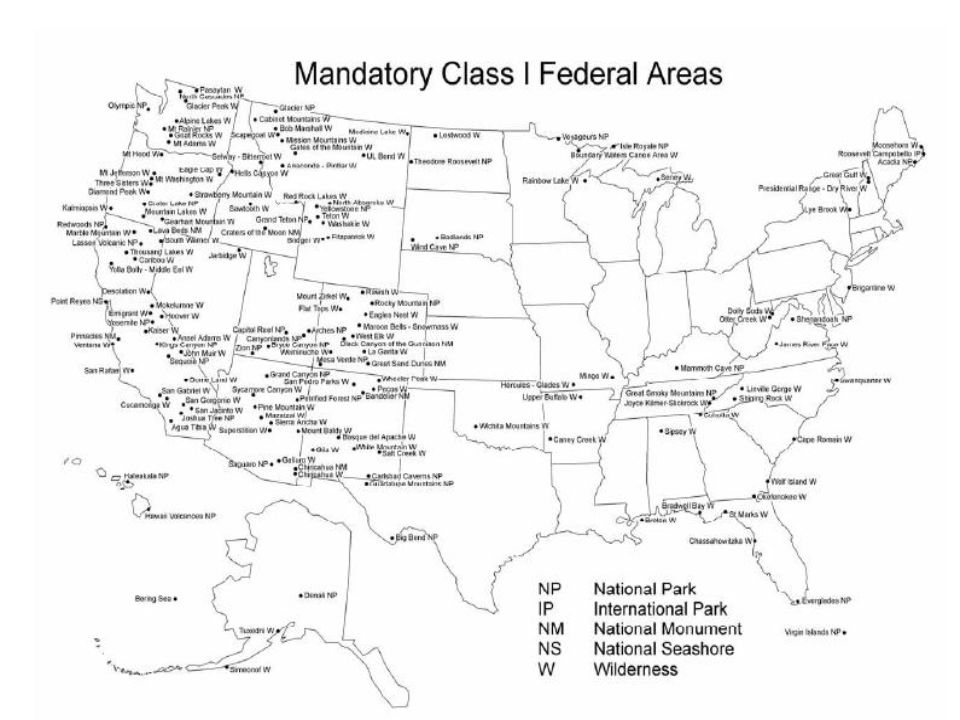
Visibility - Regional Haze Rule In 1977 Congress designated certain National Parks and Wildernesses as Class I. For these areas they declared as a national visibility goal …the prevention of any future, and the remedying of any existing, impairment of visibility…which impairment results from manmade air pollution. NPS, USFS and USF&W manage these lands

7
Exceptional Events Rule Section 319 of the Clean Air Act allows states to flag and exclude certain monitoring data affected by emissions from natural and exceptional events when determining attainment of the National Ambient Air Quality Standards (NAAQS).
.")
8
EER Procedures State, Tribe or Local air regulatory agency: –Must submit air quality monitoring data to EPA within 90 days –May flag specific data as affected by exceptional event for EPA within 6 months of measurement –May submit documentation of proof of exceptional event effects to EPA within 3 years of flagging –EPA concurs or rejects proof State and EPA Processes are Discretionary

9
North Carolina example Stonewall Prescribed Fire on March 27, 2007 Chattahoochee/Oconee National Forests Basic information on the fire that will assist in showing the influence of prescribed fire emissions on air quality monitors Document why prescribed burning was selected over other land management alternatives Document the role of fire in restoring ecological processes and how prescribed fire is being used to mimic natural fire regimes Document the Smoke Management Practices that were followed for the prescribed fire. The primary goal of smoke management is to protect public health and safety, and your smoke management practices should demonstrate this

10
Will you have the information requested up to 3 years after a prescribed fire? Fire Management Plan Burn Plan Postfire documentation

11
EPA Rule and Policy Changes Revision of Interim Policy - July 2008 Air Quality Index – any day now Emergency Episode Rule – April 2008 Revision of Ozone NAAQS – March 2008 Streamlining of General Conformity – Fall 2008

12
Interim Policy for Air Quality from Prescribed and Wildland Fire (1998) Air quality and visibility impacts from fires managed for resource benefits should be treated equitably with other source impacts.
 Air quality and visibility impacts from fires managed for resource benefits should be treated equitably with other source impacts.")
13
Interim Policy is currently being revised by EPA Phone call with Federal Land Managers – Dec 6 Draft Final – February 2008 Final – July 2008 Will include agricultural burning, will not overlap with Exceptional Events Rule

14
Air Quality Index - AQI http://www.airnow.gov/ An index for reporting daily air quality. Focuses on health effects experienced within a few hours or days after breathing polluted air. EPA calculates the AQI for five major air pollutants regulated by the Clean Air Act: ground- level ozone, particle pollution (also known as particulate matter), carbon monoxide, sulfur dioxide, and nitrogen dioxide. Air Quality Index (AQI) Values Levels of Health Concern Colors When the AQI is in this range:...air quality conditions are:...as symbolized by this color: 0 to 50GoodGreen 51 to 100ModerateYellow 101 to 150Unhealthy for Sensitive Groups Orange 151 to 200UnhealthyRed 201 to 300Very UnhealthyPurple 301 to 500HazardousMaroon
, carbon monoxide, sulfur dioxide, and nitrogen dioxide. Air Quality Index (AQI) Values Levels of Health Concern Colors When the AQI is in this range:...air quality conditions are:...as symbolized by this color: 0 to 50GoodGreen 51 to 100ModerateYellow 101 to 150Unhealthy for Sensitive Groups Orange 151 to 200UnhealthyRed 201 to 300Very UnhealthyPurple 301 to 500HazardousMaroon.")
15
EPAs PM Standards: Old and New 1997 Standards2006 Standards Annual24-hourAnnual24-hour PM 2.5 (Fine Particles) 15 µg/m 3 Annual arithmetic mean, averaged over 3 years 65 µg/m 3 24- hour average, 98 th percentile, averaged over 3 years 15 µg/m 3 Annual arithmetic mean, averaged over 3 years 35 µg/m 3 24- hour average, 98 th percentile, averaged over 3 years PM 10 (Coarse Particles) 50 µg/m 3 Annual average 150 µg/m 3 24-hr average, not to be exceeded more than once per year on average over a three year period Revoked150 µg/m 3 24-hr average, not to be exceeded more than once per year on average over a three year period
 15 µg/m 3 Annual arithmetic mean, averaged over 3 years 65 µg/m hour average, 98 th percentile, averaged over 3 years 15 µg/m 3 Annual arithmetic mean, averaged over 3 years 35 µg/m hour average, 98 th percentile, averaged over 3 years PM 10 (Coarse Particles) 50 µg/m 3 Annual average 150 µg/m 3 24-hr average, not to be exceeded more than once per year on average over a three year period Revoked150 µg/m 3 24-hr average, not to be exceeded more than once per year on average over a three year period")
16
Air Quality Index (AQI) CategoryIndex ValuesCurrent PM2.5 Levels (ug/m3, 24-hr average) PM2.5 Levels Under Consideration (ug/m3, 24-hr average) Good 0 - 500.0 - 15.4 Moderate 51 - 10015.5 - 40.415.5 - 35.4 Unhealthy for Sensitive Groups 101 - 15040.5 - 65.435.5 - 55.4 Unhealthy 150 - 20065.5 - 150.455.5 - 140.4 Very Unhealthy 201 - 300150.5 - 250.4140.5 - 210.4 Hazardous 301 - 400250.5 - 350.4210.5 - 280.4 401 - 500350.5 - 500.4280.5 - 350
 CategoryIndex ValuesCurrent PM2.5 Levels (ug/m3, 24-hr average) PM2.5 Levels Under Consideration (ug/m3, 24-hr average) Good Moderate Unhealthy for Sensitive Groups Unhealthy Very Unhealthy Hazardous")
17
Air Quality Index Categories Index Values Good0 – 50 Moderate51 – 100 Unhealthy for Sensitive Groups 101 – 150 Unhealthy151 – 200 Very Unhealthy201 – 300 Hazardous301 – 400 401 – 500 Emergency Episode Plans Alert Level Warning Level Emergency Level Significant Harm Level (SHL) Upper End of AQI Range
 Upper End of AQI Range")
18
Differences in AQI Categories between Current and Possible AQI October 2003-October 2006 Values reflect total number of days over three year period Possible AQI Current AQI

19
Due to fires

22
What Is General Conformity? The intent of the General Conformity requirement of the Clean Air Act is to insure that air quality impacts from Federal actions do not cause or contribute to a violation of the national ambient air quality standards (NAAQS) or interfere with the purpose of State (SIP), Tribal (TIP), or Federal (FIP) Implementation Plans. Only actions in designated nonattainment and maintenance areas are subject to the conformity regulations.
 or interfere with the purpose of State (SIP), Tribal (TIP), or Federal (FIP) Implementation Plans. Only actions in designated nonattainment and maintenance areas are subject to the conformity regulations..")
23
To provide coordination and collaboration between the fire and air resource management programs on fire- related air quality issues. To facilitate a framework for collaborative approaches in addressing fire and air issues at the local, state, Tribal, and national level. To establish consistent and cost-effective air quality planning, documentation, and emission reporting processes in implementing the National Fire Plan.

24
USFS – Anne Acheson and Pete Lahm BLM – Paul Schlobohm USF&W – Dennis Haddow and David Brownlie BIA – Ron Sherron and Mary Taber NPS – Kara Paintner and Mike George State Foresters – Darrell Johnston – WA, Gary Curcio – NC NRCS – Susan ONeill

25
GOAL – Establish Interagency Smoke Cadres Members – BLM, BIA, USFWS, USFS – fire and air, NPS – fire and air, TNC, NRCS, State Forestry agencies, others When – ASAP due to current and looming regulatory deadlines National Strategy for Fire Involvement in Smoke Management Regulation

26
Cadres needed in many but not all states Incorporate existing groups (CA, MT/ID, etc) Maintain for the long-term due to science & regulatory changes Cadres updated and supported by FACT Cadres communicate with 1.State 2.EPA Region as needed 3.Regional Planning Organization as needed How would cadres work?
 Maintain for the long-term due to science & regulatory changes Cadres updated and supported by FACT Cadres communicate with 1.State 2.EPA Region as needed 3.Regional Planning Organization as needed How would cadres work")
27
Cadres needed Georgia Mississippi Texas Missouri Alabama Louisiana Tennessee South Dakota Oklahoma Kansas Michigan

28
Coordinate and Collaborate States with Existing Groups California Utah New Mexico Florida Oregon Alaska Arkansas North Carolina Colorado Washington Arizona Minnesota South Carolina Montana Idaho Wyoming

29
Monitor for Change North Dakota Hawaii Indiana Kentucky West Virginia Virginia Iowa Wisconsin Nebraska Maryland Illinois Nevada

30
Develop details and process for cadre formation – April 2008 Provide cadres with general direction, objectives and oversight Provide policy and technical support Provide training to cadres – one East and on West workshop – 3 days training with Monday/Friday travel – Fall 2008, Winter 2009 What would FACT do?

31
Proactive rather than reactive Recognizes the scale a which regulations are made Builds relationships with local regulators More work Is it really necessary? Whats wrong with what were doing now? Isnt the NPS air program handling it? Pros and Cons

32
What happens next? Training Development with University of Idaho and FACT Online line officer training – April 2008 In person workshops for cadre that would also becomes online training course

33
Smoke Management Programs that have been made in a stakeholder process are best Difficult to change SMPs Relationships are important Why do this….

34
Questions?

35
Christie Neill – NPS fire lead on smoke related issues for CA kara_paintner@ nps.gov 970-267-2121

Similar presentations


 Arkansas Michigan CALIFORNIA MINNESOTA COLORADO NEVADA CONNECTICUT New Hampshire.>")


 Non-Attainment Areas – Visibility Protection.>")


44% b)53%>")


