Download presentation
Presentation is loading. Please wait.

1
Nutritional Status of Older Persons Presenting in a Primary Care Clinic in Nigeria ADEBUSOYE Lawrence University College Hospital Ibadan, Nigeria

2
BACKGROUND Good nutrition is especially important in older persons because of the physiological changes that occur in the body as people age. 1 Challenging experiences before 60 years – a life of continuing poverty – Deprivation – poor access to health care – a diet poor in quality and quantity. 1, 2

3
BACKGROUND- 2 ASSUMPTIONS Undernutrition - a rare occurrence in old age Overweight - invariable consequence of ageing. 2, 3 BMI is the most commonly available tool to assess nutrition in older persons.

4
OBJECTIVES 1.Determine the prevalence of nutritional problems (undernutrition & overweight). 2.Describe the risk factors contributing to the development of nutritional problems. 3.Determine the association between nutritional problems and morbidities.

5
THE STUDY SITE University College Hospital, Ibadan, Nigeria. Largest and oldest Tertiary hospital in Nigeria.

6
METHODS Study design: Cross-sectional study (Family Medicine Department). Study Population: 500 newly registered male and female older persons (60 years) Study period: September 1 st to October 30 th, 2009.
 Study period: September 1 st to October 30 th,")
7
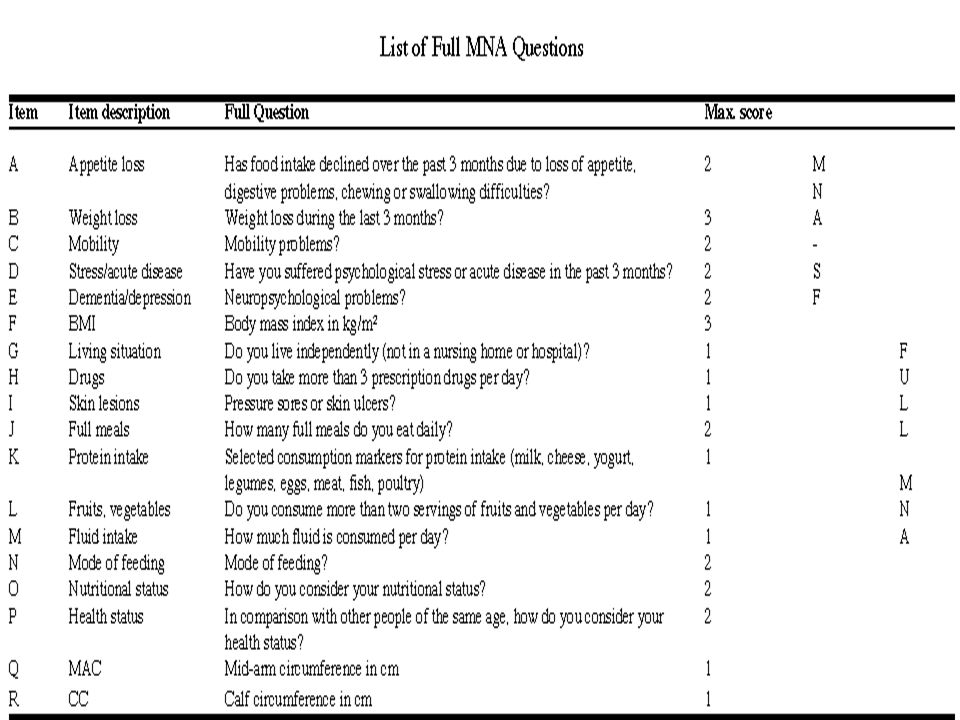
METHODS- TOOLS Mini-Nutritional Assessment (MNA R ) tool. 5 – 18 questions on dietary history, clinical evaluation and anthropometric measures. – Used to measure undernutrition – Sensitivity = 96% – Specificity = 98% – PPV = 97% MNA score (10 – 30) – Undernutrition- 17.0 – At risk of undernutrition-17.0 – 23.5 – Normal -23.6 – 30.0
 – Undernutrition – At risk of undernutrition-17.0 – 23.5 – Normal –")
8
METHODS- TOOLS contd Body Mass Index (BMI) {weight (kg)/height (m) 2 }. – Used to measure overweight BMI (WHO anthropometric classification) – Underweight< 18.5 kg/m 2 – Normal 18.5 - 25.0 kg/m 2 – Overweight>25.0 kg/m 2
 – Underweight< 18.5 kg/m 2 – Normal kg/m 2 – Overweight>25.0 kg/m 2.")
9
RESULTS 324 (64.8%) females and 176 (35.2%) males. Female : Male = 1.8 : 1 Mean age (SD) = 66.7 (6.6) years; range = 60 to 90 years. Median income = U.S. $1.56 daily; range = $0.22 to $24.44 Average OPD hospital visits in the last one year = 3 (range 1 - 13)
 = 66.7 (6.6) years; range = 60 to 90 years. Median income = U.S. $1.56 daily; range = $0.22 to $24.44 Average OPD hospital visits in the last one year = 3 (range ).")
10
FIGURE 1: UNDERNUTRITION USING MNA TOOL

11
Table 1: Significant risk factors for undernutrition RESPONDENTS n = 39(%) Undernutrition n = 59(%) At Risk of Undernutrition n= 402(%) Normal N=500(%) Total EMPLOYMENT STATUS Engaged in occupation38(8.5) 369(83.0)445 (100.0) Not engaged in occupation1(1.8)21(38.2)33(60.0)55 (100.0) χ 2 = 42.484 df = 2 p < 0.0001* FINANCIAL SUPPORT Self16(16.7)10(10.4)70(72.9)96(100.0) Others23 (5.7)49 (12.1)332 (82.2)404(100.0) χ 2 = 2.400 df = 2 p = 0.002* MARITAL STATUS Married14(4.6)35(11.6)253(83.8)302(100.0) Not married25(12.6)24(12.1)149(75.3)198(100.0) χ 2 = 10.898 df=2 p < 0.004* PREVIOUS HOSPITAL ADMISSION Never18(4.8)45(11.9)314(83.3)377(100.0) < 60 years2(4.5)4(9.1)38(86.4)44(100.0) 60 years 17(26.6)9(14.1)38(59.3)64(100.0) Cant remember2(13.3)1(6.7)12(80.0)15(100.0) χ 2 = 39.492 df = 6 p < 0.001*
 Undernutrition n = 59(%) At Risk of Undernutrition n= 402(%) Normal N=500(%) Total EMPLOYMENT STATUS Engaged in occupation38(8.5) 369(83.0)445 (100.0) Not engaged in occupation1(1.8)21(38.2)33(60.0)55 (100.0) χ 2 = df = 2 p < * FINANCIAL SUPPORT Self16(16.7)10(10.4)70(72.9)96(100.0) Others23 (5.7)49 (12.1)332 (82.2)404(100.0) χ 2 = df = 2 p = 0.002* MARITAL STATUS Married14(4.6)35(11.6)253(83.8)302(100.0) Not married25(12.6)24(12.1)149(75.3)198(100.0) χ 2 = df=2 p < 0.004* PREVIOUS HOSPITAL ADMISSION Never18(4.8)45(11.9)314(83.3)377(100.0) < 60 years2(4.5)4(9.1)38(86.4)44(100.0) 60 years 17(26.6)9(14.1)38(59.3)64(100.0) Cant remember2(13.3)1(6.7)12(80.0)15(100.0) χ 2 = df = 6 p < 0.001*")
12
Table 2: Prevalence of undernutrition and the morbidities Morbiditiesn = 39(%) Undernutrition n = 59(%) At Risk of Undernutrition n=402(%) Normal p-value Hypertension6(2.2)29(10.4)243(87.4)<0.001* Osteoarthritis0(0.0)7(50.0) <0.001* Psychosomatic disease 0(0.0)4(66.7)2(33.3)<0.001*
 Undernutrition n = 59(%) At Risk of Undernutrition n=402(%) Normal p-value Hypertension6(2.2)29(10.4)243(87.4)<0.001* Osteoarthritis0(0.0)7(50.0) <0.001* Psychosomatic disease 0(0.0)4(66.7)2(33.3)<0.001*")
13
Table 3: significant risk factors for overweight RESPONDENTS n = 24(%) Underweight n = 219(%) Normal n = 257(%) Overweight N=500 Total AGE (YEARS) 60 – 649(4.0)85(37.9)130(58.1)224(100.0) 65 – 695(5.1)50(50.5)44(44.4)99(100.0) 70 –744(3.7)52(44.7)53(48.6)109(100.0) 75 – 793(8.1)13(35.1)21(56.8)37(100.0) 803(9.7)19(61.3)9(29.0)31(100.0) χ 2 = 15.154 df = 8 p = 0.050* GENDER Male7(4.0)93(52.8)76(43.2)176(100.0) Female17(5.2)126(38.9)181(55.9)324(100.0) χ 2 = 9.020 df = 2 p = 0.011*
 Underweight n = 219(%) Normal n = 257(%) Overweight N=500 Total AGE (YEARS) 60 – 649(4.0)85(37.9)130(58.1)224(100.0) 65 – 695(5.1)50(50.5)44(44.4)99(100.0) 70 –744(3.7)52(44.7)53(48.6)109(100.0) 75 – 793(8.1)13(35.1)21(56.8)37(100.0) 803(9.7)19(61.3)9(29.0)31(100.0) χ 2 = df = 8 p = 0.050* GENDER Male7(4.0)93(52.8)76(43.2)176(100.0) Female17(5.2)126(38.9)181(55.9)324(100.0) χ 2 = df = 2 p = 0.011*")
14
LOGISTIC REGRESSION ANALYSIS (Undernutrition): Hospital admission after the age of 60 years – (OR=2.105, CI=1.479-2.996) Having hypertension – (OR=8.197, CI=3.270-20.833). Not being in marriage – (OR=1.355, CI=1.075–1.708) CORRELATION ANALYSIS (PEARSONS): Positive association between BMI and MNA scores (r=0.152, p <0.0001).
 CORRELATION ANALYSIS (PEARSONS): Positive association between BMI and MNA scores (r=0.152, p <0.0001)..")
15
MNA categories across care settings

16
CONCLUSION 1.High prevalence of nutritional problems in this study underscores the need for intervention in the older population. 2.The MNA R tool is an easy, simple and fast tool that could assess the nutritional status of older persons especially in primary care setting at first-contact. 3.Older persons need to be comprehensively examined as most of the predisposing factors to nutritional problems can be easily identified and treated.

17
THANK YOU

18
REFERENCES 1.Charlton KE, Rose D. Nutrition among older adults in Africa: the situation at the beginning of the millennium. J Nutr. 2001; 131:2424S–8S. 2.Evans C. Malnutrition in the elderly: a multifactorial failure to thrive. The Permanente Journal. 2005; 9:3. 3.Hajjar RR, Karmel HK, Denson K. Malnutrition in aging. The Internet J Geriatr Gerontol. 2004; 1:1. 4.National Population Commission of Nigeria. National and states population and housing tables. 2006 population and housing census of the Federal Republic of Nigeria. 2009. Accessed at www.population.gov.ng on 14 February 2011.

19
REFERENCES- 2 5.Nestle nutrition institute. Mini Nutritional Assessment (MNA). Nestle´, 1994, Revision 2006. N67200 12=99 10M. Accessed at http://www.mna-elderly.com/ forms/MNA_english.pdf on 13 April 2009.http://www.mna-elderly.com/ 6.World Health Organization expert committee on physical status 1995: the use and interpretation of anthropometry physical status. Technical Report Series no. 854. Geneva: World Health Organization. 7.Vellas B, Sieber C. The MNA revisited : what does the data tell us? Scientific Symposium Proceeding XIXth IAGG World Congress of Gerontology and Geriatrics. Monday, 6 July 2009 Paris, France.

21
TABLE 1: Demographic characteristics and undernutrition RESPONDENTS n = 39(%) Undernutrition n = 59(%) At Risk of Undernutrition n= 402(%) Normal N=500(%) Total AGE GROUP (YEARS) < 7537 (8.5)50 (11.6)345 (79.9)432 (100.0) 752 (2.9)9 (13.2)57 (83.9)68 (100.0) χ 2 = 2.634 df=2 p = 0.268 GENDER Female25(7.7)36(11.1)263(81.2)324(100.0) Male14(8.0)23(13.0)139(79.0)176(100.0) χ 2 = 0.447 df=2 p = 0.800 MARITAL STATUS Married14(4.6)35(11.6)253(83.8)302(100.0) Not married25(12.6)24(12.1)149(75.3)198(100.0) χ 2 = 10.898 df=2 p < 0.004* NUMBER OF CHILDREN < 413 (11.3)14 (12.2)88 (76.5)115 (100.0) 426 (6.8)45 (11.7)314 (81.5)385 (100.0) χ 2 = 2.648 df=2 p = 0.266
 Undernutrition n = 59(%) At Risk of Undernutrition n= 402(%) Normal N=500(%) Total AGE GROUP (YEARS) < 7537 (8.5)50 (11.6)345 (79.9)432 (100.0) 752 (2.9)9 (13.2)57 (83.9)68 (100.0) χ 2 = df=2 p = GENDER Female25(7.7)36(11.1)263(81.2)324(100.0) Male14(8.0)23(13.0)139(79.0)176(100.0) χ 2 = df=2 p = MARITAL STATUS Married14(4.6)35(11.6)253(83.8)302(100.0) Not married25(12.6)24(12.1)149(75.3)198(100.0) χ 2 = df=2 p < 0.004* NUMBER OF CHILDREN < 413 (11.3)14 (12.2)88 (76.5)115 (100.0) 426 (6.8)45 (11.7)314 (81.5)385 (100.0) χ 2 = df=2 p = 0.266")
22
TABLE 2: Economic status and undernutrition RESPONDENTS n = 39(%) Undernutrition n = 59(%) At Risk of Undernutrition n= 402(%) Normal N=500(%) Total EMPLOYMENT STATUS Engaged in occupation38(8.5) 369(83.0)445 (100.0) Not engaged in occupation1(1.8)21(38.2)33(60.0)55 (100.0) χ 2 = 42.484 df = 2 p < 0.0001* INCOME Above the poverty line 10(3.4)35(11.9)248(84.7)293(100.0) Below the poverty line 29(16.4)20(11.3)128(72.3)177(100.0) Dont Know0(0.0)4(13.3)26(86.7)30(100.0) χ 2 = 6.968 df = 4 p = 0.138 FINANCIAL SUPPORT Self16(16.7)10(10.4)70(72.9)96(100.0) Others23 (5.7)49 (12.1)332 (82.2)404(100.0) χ 2 = 2.400 df = 2 p = 0.002*
 Undernutrition n = 59(%) At Risk of Undernutrition n= 402(%) Normal N=500(%) Total EMPLOYMENT STATUS Engaged in occupation38(8.5) 369(83.0)445 (100.0) Not engaged in occupation1(1.8)21(38.2)33(60.0)55 (100.0) χ 2 = df = 2 p < * INCOME Above the poverty line 10(3.4)35(11.9)248(84.7)293(100.0) Below the poverty line 29(16.4)20(11.3)128(72.3)177(100.0) Dont Know0(0.0)4(13.3)26(86.7)30(100.0) χ 2 = df = 4 p = FINANCIAL SUPPORT Self16(16.7)10(10.4)70(72.9)96(100.0) Others23 (5.7)49 (12.1)332 (82.2)404(100.0) χ 2 = df = 2 p = 0.002*")
23
TABLE 3: Social characteristics and undernutrition RESPONDENTS n = 39(%) Undernutrition n = 59(%) At Risk of Undernutrition n= 402(%) Normal N=500(%) Total LIVING ARRANGEMENT Alone2(4.0)4(8.0)44(88.0)50(100.0) With others37(8.2)55(12.2)358(79.6)450(100.0) χ 2 = 2.107 df = 2 p = 0.349 SOCIAL SUPPORT Children/ grandchildren18(7.4)24(9.9)200(82.6)242(100.0) Self14(9.5)21(14.3)112(76.2)147(100.0) Spouse5(6.4)9(11.5)64(82.1)78(100.0) Other relatives2(6.1)5(15.2)26(78.8)33(100.0) χ 2 = 3.250 df = 6 p = 0.777 WHO PREPARES YOUR MEALS? Self26(13.5) 140(73.0)192(100.0) Children/ grandchildren7(4.2)17(10.2)142(85.6)166(100.0) Spouse5(3.9)14(11.0)108(85.1)127(100.0) Other relatives1(6.7)2(13.3)12(80.0)15(100.0) χ 2 = 3.758 df = 6 p = 0.709
 140(73.0)192(100.0) Children/ grandchildren7(4.2)17(10.2)142(85.6)166(100.0) Spouse5(3.9)14(11.0)108(85.1)127(100.0) Other relatives1(6.7)2(13.3)12(80.0)15(100.0) χ 2 = df = 6 p =")
24
Table 4: Hospital care utilization and undernutrition RESPONDENTS n = 39(%) Undernutrition n = 59(%) At risk of Undernutrition n= 402(%) Normal N=500(%) Total PREVIOUS HOSPITAL ADMISSION Never18(4.8)45(11.9)314(83.3)377(100.0) < 60 years2(4.5)4(9.1)38(86.4)44(100.0) 60 years 17(26.6)9(14.1)38(59.3)64(100.0) Cant remember2(13.3)1(6.7)12(80.0)15(100.0) χ 2 = 39.492 df = 6 p < 0.001* NUMBER OF OUTPATIENTS HOSPITAL VISITS IN THE PREVIOUS YEAR 1 – 331(9.0)38(11.0)276(80.0)345(100.0) 48(5.2)21(13.5)126(81.3)155(100.0) χ 2 = 2.609 df = 2 p = 0.271
 Undernutrition n = 59(%) At risk of Undernutrition n= 402(%) Normal N=500(%) Total PREVIOUS HOSPITAL ADMISSION Never18(4.8)45(11.9)314(83.3)377(100.0) < 60 years2(4.5)4(9.1)38(86.4)44(100.0) 60 years 17(26.6)9(14.1)38(59.3)64(100.0) Cant remember2(13.3)1(6.7)12(80.0)15(100.0) χ 2 = df = 6 p < 0.001* NUMBER OF OUTPATIENTS HOSPITAL VISITS IN THE PREVIOUS YEAR 1 – 331(9.0)38(11.0)276(80.0)345(100.0) 48(5.2)21(13.5)126(81.3)155(100.0) χ 2 = df = 2 p = 0.271")
25
Table 5: presenting complaints and undernutrition Presenting complaintsUndernutrition n = 39(%)Total N = 500 (%) Digestive domain Problem with mouth, teeth and tongue34(9.9)345(100.0) Constipation5(4.0)125(100.0) Swallowing problems7(6.9)102(100.0) Abdominal pain/discomfort7(13.0)54(100.0) Diarrhoea6(11.5)52(100.0) Vomiting4(11.1)36(100.0) Bleeding from the Anus2(7.7)26(100.0) Mental Domain Forgetfulness31(8.7)357(100.0) Feeling of anxiety/ Nervousness18(6.0)299(100.0) Insomnia23(8.1)284(100.0) Depression16(7.8)205(100.0) Alcohol abuse1(11.1)9(100.0) Social Domain Financial problems25(7.5)334(100.0) Welfare problems8(5.5)145(100.0) Housing problems10(7.4)136(100.0) Socio-cultural problems5(10.4)48(100.0) Access to health care facility problems1(10.0)10(100.0)
Total N = 500 (%) Digestive domain Problem with mouth, teeth and tongue34(9.9)345(100.0) Constipation5(4.0)125(100.0) Swallowing problems7(6.9)102(100.0) Abdominal pain/discomfort7(13.0)54(100.0) Diarrhoea6(11.5)52(100.0) Vomiting4(11.1)36(100.0) Bleeding from the Anus2(7.7)26(100.0) Mental Domain Forgetfulness31(8.7)357(100.0) Feeling of anxiety/ Nervousness18(6.0)299(100.0) Insomnia23(8.1)284(100.0) Depression16(7.8)205(100.0) Alcohol abuse1(11.1)9(100.0) Social Domain Financial problems25(7.5)334(100.0) Welfare problems8(5.5)145(100.0) Housing problems10(7.4)136(100.0) Socio-cultural problems5(10.4)48(100.0) Access to health care facility problems1(10.0)10(100.0)")
Similar presentations


 pantry survey found that.>")


