Download presentation
Presentation is loading. Please wait.

1
Thromboelastometry- The New Coagulation Measurement
Andrew Bernard, MD Associate Professor of Surgery Trauma Center Medical Director UK Healthcare

2
Objectives Understand how thromboelastometry works
Describe the published literature on efficacy of TEM/TEG 3. Interpret typical thromboelastograms

3
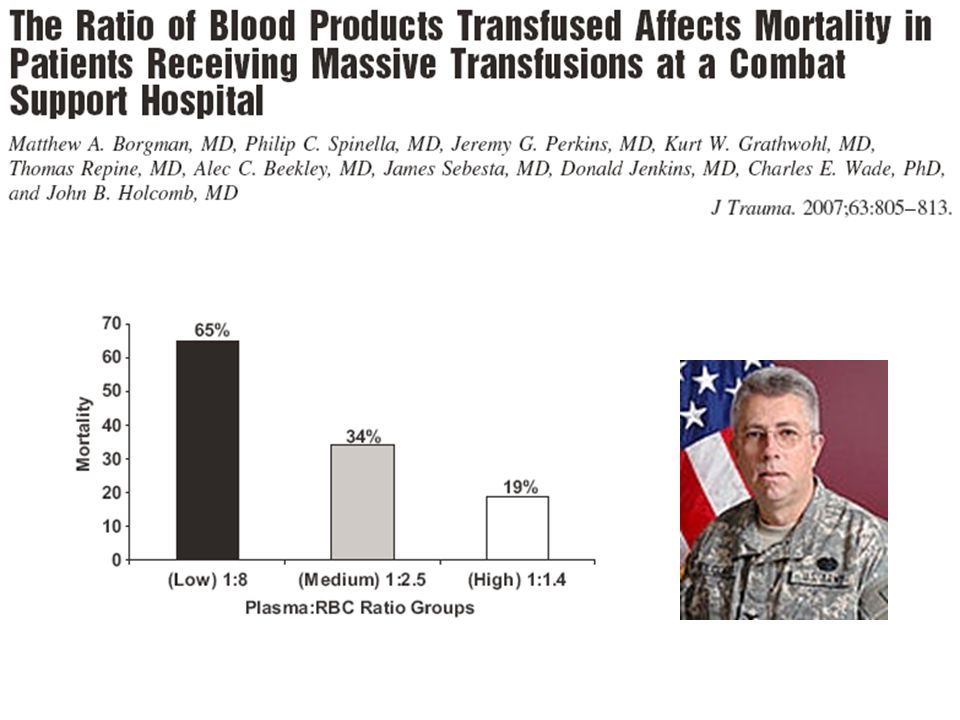
Hypothesis: Pre-ICU MTP (FFP after 6 units PRBC) is inadequate for correcting coagulopathy.
 is inadequate for correcting coagulopathy.")
6
J Trauma. 2011;70:97-102

7
Coagulopathy of Trauma
Pro-thrombotic State DVT / PE (Majority) Hemorrhagic State Bleeding Ongoing hypotension Integral to limiting hemorrhage and subsequent survival is one’s ability to form a fibrin clot at the site of injury. However, the same hemostatic process required to limit hemorrhage can also be life threatening when venothromboembolic (VTE) complications occur. Hence, a delicate balance exists between pro-coagulant and anticoagulant activities in vivo. It is important to be able to accurately evaluate the hemostatic status after injury so we adequately restore clotting factors in a bleeding patient or assess the efficacy of pharmacologic therapy in prothrombotic patients. Coagulopathy of trauma is dynamic.
 Hemorrhagic State. Bleeding. Ongoing hypotension. Integral to limiting hemorrhage and subsequent survival is one’s ability to form a fibrin clot at the site of injury. However, the same hemostatic process required to limit hemorrhage can also be life threatening when venothromboembolic (VTE) complications occur. Hence, a delicate balance exists between pro-coagulant and anticoagulant activities in vivo. It is important to be able to accurately evaluate the hemostatic status after injury so we adequately restore clotting factors in a bleeding patient or assess the efficacy of pharmacologic therapy in prothrombotic patients. Coagulopathy of trauma is dynamic.")
8
CONTACT TISSUE COMMON PATHWAY THROMBIN / FIBRINOGEN
The hypercoagulable state resulting from tissue injury has been attributed mainly to extrinsic (TF)-dependent thrombin generation. The contact pathway (TF-independent) can also lead to thrombin generation in vitro but the physiologic significance of this pathway in vivo has been less well understood. (20-21) In cardiac patients, contact pathway enzyme, FXIa, was significantly higher in those with acute coronary syndrome (ACS) than in those with stable angina pectoris (SAP) pointing to its role in vascular thrombosis. Hence both the intrinsic and extrinsic pathways may both have a role in maintaining hemostasis after injury. THROMBIN / FIBRINOGEN
-dependent thrombin generation. The contact pathway (TF-independent) can also lead to thrombin generation in vitro but the physiologic significance of this pathway in vivo has been less well understood. (20-21) In cardiac patients, contact pathway enzyme, FXIa, was significantly higher in those with acute coronary syndrome (ACS) than in those with stable angina pectoris (SAP) pointing to its role in vascular thrombosis. Hence both the intrinsic and extrinsic pathways may both have a role in maintaining hemostasis after injury. THROMBIN / FIBRINOGEN.")
9
Thromboelastography Functional assay Factor Deficiencies
Global assessment (from initiation of protein coagulation through clot lysis) Factor Deficiencies Fibrinogen Function Platelet Function Clot Strength Lysis Standard coagulation tests, termed the plasma clotting assays, include the prothrombin time (PT) and activated partial thromboplastin time (aPTT), provide general measures of the extrinsic and intrinsic clotting pathway integrity, respectively. These tests are performed on platelet-poor plasma and are unable to assess the true rate of clot formation, overall strength of the clot and the degree of clot lysis (fibrinolysis) as TEG can. (4)
 Factor Deficiencies. Fibrinogen Function. Platelet Function. Clot Strength. Lysis. Standard coagulation tests, termed the plasma clotting assays, include the prothrombin time (PT) and activated partial thromboplastin time (aPTT), provide general measures of the extrinsic and intrinsic clotting pathway integrity, respectively. These tests are performed on platelet-poor plasma and are unable to assess the true rate of clot formation, overall strength of the clot and the degree of clot lysis (fibrinolysis) as TEG can. (4)")
10
Thromboelastography Technology
TEG ROTEM Delta Pin suspended into a blood sample cup that oscillates, leads to a rotation torque as blood clots, which is converted to electric signals that are recorded.

11
Thromboelastography Technology
ROTEM Delta TEG Pin suspended into a blood sample cup that oscillates, leads to a rotation torque as blood clots, which is converted to electric signals that are recorded.

12
Hemostasis profile: R time Angle MA LY
Selected parameters will be discussed here. R time – time to first fibrin strand formation; this is the point at which all other plasma clotting assays (e.g., PT/aPTT) stop measuring. Its value will increase with coagulation factor deficiency or its value will decrease when the coagulation factors involved in thrombin generation is increased as when FVIIa is administered. α-angle measures the angle between the tangent line drawn from the curve to the split point and the tracing's horizontal line, in degrees. It is reflective of kinetic interaction of fibrin/fibrinogen with platelets. Maximum Amplitude – Reflects ultimate clot strength due to fibrin/fibrinogen interaction with GPIIb/IIIa receptor on functioning platelets. Lysis 30 – Rate of amplitude reduction (clot break down) and is an indication of clot stability Hemostasis profile: R time Angle MA LY Fibrin strands clot kinetics strength/elasticity dissolution
 stop measuring. Its value will increase with coagulation factor deficiency or its value will decrease when the coagulation factors involved in thrombin generation is increased as when FVIIa is administered. α-angle measures the angle between the tangent line drawn from the curve to the split point and the tracing s horizontal line, in degrees. It is reflective of kinetic interaction of fibrin/fibrinogen with platelets. Maximum Amplitude – Reflects ultimate clot strength due to fibrin/fibrinogen interaction with GPIIb/IIIa receptor on functioning platelets. Lysis 30 – Rate of amplitude reduction (clot break down) and is an indication of clot stability. Hemostasis profile: R time Angle MA LY. Fibrin strands clot kinetics strength/elasticity dissolution.")
13
Maximal Amplitude (MA) Lysis 30/60 (LY30/60)
TEG Components R (reaction) time Coagulation factors K (clotting) time Interaction of factors, fibrin & platelets Alpha angle Fibrin & platelets Maximal Amplitude (MA) Platelet function Lysis 30/60 (LY30/60) Fibrinolysis Developed by H. Hartert in Germany in 1948 as a research tool First used clinically in liver transplantation by Kang in Pennsylvania more than 25 years later Widest use in cardiopulmonary bypass (CPB) and liver transplantation Other uses: Trauma / Obstetrics / Surgery / ICU / Hypercoagulable states etc. 2 studies only TEG predicts blood product usage in trauma patients J Trauma. 1997;42(4):716-22 TEG accurately measures coagulopathy in trauma patients Anesth Analg. 1998;86(2S):88S Utility under investigation at Balad LTC Donald Jenkins and Maj Steve Abbate
 time. Coagulation factors. K (clotting) time. Interaction of factors, fibrin & platelets. Alpha angle. Fibrin & platelets. Maximal Amplitude (MA) Platelet function. Lysis 30/60 (LY30/60) Fibrinolysis. Developed by H. Hartert in Germany in 1948 as a research tool. First used clinically in liver transplantation by Kang in Pennsylvania more than 25 years later. Widest use in cardiopulmonary bypass (CPB) and liver transplantation. Other uses: Trauma / Obstetrics / Surgery / ICU / Hypercoagulable states etc. 2 studies only. TEG predicts blood product usage in trauma patients J Trauma. 1997;42(4): TEG accurately measures coagulopathy in trauma patients Anesth Analg. 1998;86(2S):88S. Utility under investigation at Balad LTC Donald Jenkins and Maj Steve Abbate.")
14
Typical TEG Tracings

15
Graphic Result

16
R time Sample placement to amplitude of 2mm Clotting factor activity

17
K time R time → amplitude of 20 mm
Time to reach level of clot strength Clotting factors, fibrinogen, and platelet function

18
a-Angle Slope from R-time to K-time Speed of clot strengthening
Clotting factors, fibrinogen, and platelet function

19
Maximum Amplitude (MA)
Greatest vertical amplitude of tracing Clot strength Platelet number and function

20
LY30 Rate of amplitude reduction @ 30 min after MA
Measure of clot stability Increased rate indicates hyperfibrinolysis

21
GSW to Pelvis & RLE Rectal, Small Bowel, Sacral, & Open Femur Fx
Arrived in Class IV Shock

22
Same Patient Intra-op after 11 PRBC, 2 Plt, 4 Cryo, 6 FFP, 3 WB, & 1 Factor VIIa Post-op after 19 PRBC, 2 Plt, 4 Cryo, 6 FFP, 6 WB, & 1 Factor VIIa

23
Patient 2 POD 1 : Hypercoagulable
L parietal GSW requiring emergent craniotomy POD 1 : Hypercoagulable

24
GSW to Left Flank Sigmoid Colon, Small Bowel, and Abdominal Wall Injury 2 PRBC given intra-op

25
GSW to Left Flank Post-op TEG shows early fibrinolysis
TEG after Amicar infusion

26
Clinical Randomisation of an Antifibrinolytic in Significant Haemorrhage

29
Guideline for Blood Product Use
Abnormal TEG Prolonged R time Prolonged K time or Decrease a-Angle Transfuse 4 units FFP Transfuse 4 units FFP then 4 units Cryoprecipitate Consider rVIIa if abnml after above Decrease Maximum Amplitude Increase LY30 Transfuse 2-4 units Whole Blood Amicar 5gm IV load over 1 hour then 1 gm/hr until LY normal

31
Summary Hemorrhage is the enemy (early)
Hypercoagulability is the enemy (late) Diagnosis: time consuming and confusing ROTEM Delta and TEG “Whole blood coagulation measurement” Fast One test Easily repeatable It’s what you want-clot measurement
 Diagnosis: time consuming and confusing. ROTEM Delta and TEG. Whole blood coagulation measurement Fast. One test. Easily repeatable. It’s what you want-clot measurement.")
33
ROTEM delta Proven technology clinical units 50 countries publications Integrated system on-board computer, Touchscreen & LIS protocols Electronic programmed Pipette & on screen step by step directions LQC once a week, EQC automatic, CLIA Option 2 Remote viewing in real time Global Intrinsic & Extrinsic with specific Fibrinogen test

34
Surgical Hemostasis Webinar
4pm EDT Oct 20 Dr. Klaus Goerlinger

35
Schochl, Cotton et al. Unpublished data.

36
“Turnaround time” 2) “Obviation of other coag tests” 3) “Opportunity to return to POC (that we used to have with TEG in OR but had to abandon because of difficulty with instrumentation maintenance and QC)” 4) “Opportunity to use fewer units of clotting factors, thus improving outcome while saving money” 5) “As above, especially for platelet function (in future) so that not every patient on anti-platelet drugs has to get empiric platelets” 6) “Cost vs TEG”
 Opportunity to return to POC (that we used to have with TEG in OR but had to abandon because of difficulty with instrumentation maintenance and QC) 4) Opportunity to use fewer units of clotting factors, thus improving outcome while saving money 5) As above, especially for platelet function (in future) so that not every patient on anti-platelet drugs has to get empiric platelets 6) Cost vs TEG")
37
Why United States last launch for Rotem?
FDA Lawyers Rotem had to be Significantly better

38
Why Thromboelastometry. Why Thromboelastometry
Why Thromboelastometry ? Why Thromboelastometry? Target directed Transfusions Rapid reaction to coagulopathies Reduce Transfusion Costs… both Economic & Adverse Effects Next 6 slides illustrate global concerns of transfusions and cost savings in LvTX, and Cardiac Surgery

44
“An audit of red cell and blood product use after the institution
ORIGINAL ARTICLE “An audit of red cell and blood product use after the institution of thromboelastometry in a cardiac intensive care unit” L. Anderson,* I. Quasim,* R. Soutar,† M. Steven,* A. Macfie* and W. Korte‡ *Department of Anaesthesia, †Department of Haematology, Western Infirmary, Glasgow, UK, and ‡Institute for Clinical Chemistry and Haematology, Kantonsspital, St Gallen, Switzerland Received 7 July 2005; accepted for publication 31 August 2005

45
A retrospective analysis of data from 990 patients was performed which covered a period
6 months prior to the introduction of ROTEM thromboelastometry and 6 months after its introduction.

46
In the 6 months prior red cells were used in 60% of patients and fresh frozen plasma (FFP) and platelets used in 17 and 16% of patients, respectively. In the following 6 months red cell use had fallen to 53% and FFP and platelets to 12 and 11%, respectively (P < 005). Introduction of thromboelastometry has significantly decreased our use of red cells and blood products.
 and platelets used in 17 and 16% of patients, respectively. In the following 6 months. red cell use had fallen to 53% and. FFP and platelets to 12 and 11%, respectively (P < 005). Introduction of thromboelastometry has significantly. decreased our use of red cells and blood products.")
47
Annual treatment costs of all cardio surgical patients were analyzed
before 729 patients after 693 patients implementation of ‘bedside’ ROTEM.

48
Cost reduction of perioperative coagulation management in cardiac surgery: value of ‘bedside’ thrombelastography (ROTEM) Grit J. Spalding a, Martin Hartrumpf a, Tobias Sierig b, Nils Oesberg b, Christian Gu¨nther Kirschke b, Johannes M. Albes a,* Department of Cardiovascular Surgery, Heart Center Brandenburg, Bernau/Berlin, Germany Department of Anesthesiology, Heart Center Brandenburg, Bernau/Berlin, Germany Received 27 September 2006; received in revised form 26 February 2007; accepted 27 February 2007 Please cite this article in press as: Spalding GJ, et al., Cost reduction of perioperative coagulation management in cardiac surgery: value of ‘bedside’ thrombelastography (ROTEM), Eur J Cardio-thorac Surg (2007), doi: /j.ejcts
, Eur J Cardio-thorac Surg (2007), doi: /j.ejcts")
49
After Rotem Red Blood Cell Units < 25 %
Platelet Concentrates < 50% FFP unchanged Pooled coagulation concentrates & Factor XIII < 80% Factor VIIA omitted Fibrinogen > two fold Avg. Monthly costs all blood products < 32% Coagulation factor monthly costs 50% Combined Savings 44%

50
ROTEM vs. TEG – Tests ROTEM® TEG® IN-tem (intrinsic)
HEP-tem (heparinase) Extem (extrinsic) FIBtem (Fibrinogen ) Aptem (Hyperfibrinolysis) TEG® Koalin (intrinsic) Heparinase cup
 Extem (extrinsic) FIBtem (Fibrinogen ) Aptem (Hyperfibrinolysis) TEG® Koalin (intrinsic) Heparinase cup.")
51
ROTEM® Parameters TEG® Parameters
CT – Clotting Time (seconds) R – Reaction Time (minutes) CFT – Clot Formation Time K – Coagulation Time (minutes) α Alpha Angle (°) A (x) – Amplitude at a time point. 10/15/20/25/30 mm (minutes) No equivalent parameter MCF – Maximum Clot Firmness (mm) MA – Maximum Amplitude (mm)
 R – Reaction Time (minutes) CFT – Clot Formation Time. K – Coagulation Time (minutes) α Alpha Angle (°) A (x) – Amplitude at a time point. 10/15/20/25/30 mm (minutes) No equivalent parameter. MCF – Maximum Clot Firmness (mm) MA – Maximum Amplitude (mm)")
52
Thromboelastometry: Based on whole blood analysis
Typical reaction curves Numerical data for many phases of hemostasis Abnormal results clearly indicated Clot firmness = Quality of clot α - angle (°) Maximum Lysis (%) MCF = Maximum Clot Firmness (mm) Explain basics of CT, CFT, Angle, MCF, Maximum Lysis, with this graph and the following 8 slides. è Clot Quality CT = Clotting Time (sec) CFT = Clot Formation Time (Sec)
 Maximum. Lysis. (%) MCF = Maximum Clot Firmness (mm) Explain basics of CT, CFT, Angle, MCF, Maximum Lysis, with this graph and the following 8 slides. è. Clot Quality. CT = Clotting Time (sec) CFT = Clot Formation Time (Sec)")
53
TEG – Pin suspended by gravity on torsion wire
TEG detection by Professor Hartert (1948) pin cup Motion of the pin Continuous registration Torsion wire 4.75° Thromboelastogram Blood clot Cuvette rotated Pin suspended freely from a thin wire and does not move until a clot firms *Because of the free suspension of the pin this method is susceptible to vibrations and mechanical shocks
 pin. cup. Motion of the pin. Continuous registration. Torsion. wire. 4.75° Thromboelastogram. Blood. clot. Cuvette rotated. Pin suspended freely from a thin wire and does not move until a clot firms. *Because of the free suspension of the pin this method is susceptible to vibrations and mechanical shocks.")
54
Stable Function Principle of ROTEM® III
The rotating axis, stabilized and guided by a high precision ball bearing, carries the sensor. The cuvette is stationary. Clotting or lysis leads to a change of torque which is detected by a CCD chip. The patent protected opto-mechanical detection system is very robust and less susceptible to mechanical shocks or vibrations. Slide / 13

55
Rotem advantages vs TEG
Eliminates Vibration/Stability issues Greatly Improves ease of use Significantly easier to stay in compliance Advanced targeted diagnostics for Coagulopathy Test data in about 15 minutes 24/7/365 – TEG - $60,000 Rotem - $11,000

56
Ease of Use Integrated touch screen – step by step directions
Electronic preprogrammed push button pipette – “pipetting for dummies” Mobile – No balancing issues, “put it where you need it”, Rotem is Whole Hospital Near patient Blood Management System. Citrated samples used immediately or up to 6 hours, (no need to wait 30 mins, like TEG) Rotem = 4 testing channels vs TEG’s 2 testing channels
 Rotem = 4 testing channels vs TEG’s 2 testing channels.")
57
Easier Compliance for Laboratory & Less Costs
Operator ID required Pt ID required Sample ID required Automatic daily EQC – Daily verification in menu. Automatic Channel shut down if out of spec Once a week LQC – CLIA option 2 Rotem 24/7/365 LQC = $11,000 per year TEG 24/7/365 LQC = $60,000 per year

58
Rotem Differential Guided Diagnosis
INTEM – Intrinsic Pathway activator – Ellagic Acic HEPTEM – Heparinase – Run with Intem EXTEM –Extrinsic pathway activator – Tissue factor FIBTEM – Platelet inhibitor, Fibrinogen graph, excludes platelet contribution to clot formation (Cytochalasin D) APTEM – Antifibrynolitic, Hyperfibrinolysis confirmation (aprotonin)
 APTEM – Antifibrynolitic, Hyperfibrinolysis confirmation (aprotonin)")
59
FIBTEM as a Indicator for Fibrinogen Substitution II
Cryoprecipitate msc

60
Advantages of Rotem in Trauma
Transfusion in trauma: why and how should we change our current practice? O.M. Theusinger, D.R Spahn and M.T. Ganter Institute of Anesthesiology, University Hospital and University of Zurich, Zurich, Switzerland Correspondence to Oliver M. Theusinger, MD, Resident, Institute of Anesthesiology, University Hospital and University of Zurich, Ra¨ mistrasse 100. Current Opinion in Anaesthesiology 2009,22:305–312

61
Trauma, Hemorrhage, Mortality Theusinger
“Hemorrhage is known to be a major cause of early death after injury and has been shown to be responsible for 30–40% of trauma mortalities.” [1–3]. “Furthermore, hemorrhage with consecutive multiple transfusions has been shown to significantly worsen clinical outcomes” [4,5].

62
Transfusion in trauma: why and how should we change our current practice? O.M. Theusinger, D.R Spahn and M.T. Ganter “Traditionally, acute traumatic coagulopathy has been thought to be due to consumption of coagulation factors, dilution from intravenous fluid therapy, hypothermia and metabolic acidosis.” “It has recently been shown, however, that none of these factors is initially responsible for the acute traumatic coagulopathy. These factors become significant only in the later phase of traumatic coagulopathy.” [Brohi,12, 13]

63
Referenced in Theursinger
12 Brohi K, Cohen MJ, Ganter MT, et al. Acute coagulopathy of trauma: hypoperfusion induces systemic anticoagulation and hyperfibrinolysis. J Trauma 2008; 64:1211–1217. This study confirms that acute coagulopathy of trauma is associated with systemic hypoperfusion and is characterized by anticoagulation and hyperfibrinolysis. Thrombin binding to thrombomodulin activates protein C thereby inhibiting factor Va/VIIIa and consuming PAI-1 (derepression of fibrinolysis). Brohi K, Cohen MJ, Davenport RA. Acute coagulopathy of trauma: mechanism, identification and effect. Curr Opin Crit Care 2007; 13:680–685. The pathogenesis and problems of acute trauma bleeding including transfusion requirements, organ dysfunction and mortality are reviewed. Early treatment and recognition of coagulopathy has implications for the care of shocked patients and the management of massive transfusion.
. Brohi K, Cohen MJ, Davenport RA. Acute coagulopathy of trauma: mechanism, identification and effect. Curr Opin Crit Care 2007; 13:680–685. The pathogenesis and problems of acute trauma bleeding including transfusion. requirements, organ dysfunction and mortality are reviewed. Early treatment and. recognition of coagulopathy has implications for the care of shocked patients and. the management of massive transfusion.")
64
Transfusion in trauma: why and how should we change our current practice? O.M. Theusinger, D.R Spahn and M.T. Ganter Studies by Brohi et al. [11–14] have described an early and previously unknown acute traumatic coagulopathy before any of the above-mentioned traditional causes of traumatic coagulopathy were present. It has been shown that tissue injury and hypoperfusion followed by the activation of the anticoagulation thrombomodulin protein C pathway plays the central role in the pathogenesis of acute traumatic coagulopathy. As a result of overt activation of protein C, acute traumatic coagulopathy is characterized by coagulopathy in conjunction with hyperfibrinolysis

65
Referenced in Thuersinger
Brohi K, Cohen MJ, Ganter MT, et al. Acute traumatic coagulopathy: initiated by hypoperfusion: modulated through the protein C pathway? Ann Surg 2007; 245:812–818. This study shows for the first time that tissue injury and hypoperfusion followed by the activation of the anticoagulation thrombomodulin protein C pathway plays the central role in the pathogenesis of acute traumatic coagulopathy. 14 Cohen MJ, Brohi K, Ganter MT, et al. Early coagulopathy after traumatic brain injury: the role of hypoperfusion and the protein C pathway. J Trauma 2007; 63:1254–1261. The study shows that TBI alone does not cause early coagulopathy, but must be coupled with hypoperfusion to lead to coagulation derangements, associated with the activation of the protein C pathway. This finding has implications for the treatment of coagulopathy after severe TBI.

66
Trauma – aPC Clinically Significant Theusinger
“The activation of the thrombomodulin protein C pathway has clinical significance; high thrombomodulin and low protein C plasma levels were associated with increased mortality, blood transfusion requirements, acute renal injury, and reduced ventilator-free days early after trauma” [11–14].

67
Factor XIII & Maximum Clot Firmness - Theusinger
“Factor XIII is the key coagulation factor to stabilize the clot. Schroeder et al. [54] and Nielsen et al. [55,56] have proven a relation between decreased factor XIII activity and reduced clot firmness” (maximal amplitude [TEG]/ maximum clot firmness [Rotem]) by computerized TEG. “Trauma and major hemorrhage is known to be a cause of acquired factor XIII deficiency [57]. It seems reasonable to substitute factor XIII early, thereby improving clot firmness, reducing bleeding and minimizing the use of blood products [58–60].”
 by computerized TEG. Trauma and major hemorrhage is known to be a cause of acquired factor XIII deficiency [57]. It seems reasonable to substitute factor XIII early, thereby improving clot firmness, reducing bleeding and minimizing the use of blood products [58–60].")
68
Prothrombin Complex Concentrate - Theusinger
“Bruce and Nokes [66] recently demonstrated that the use of PCCs in trauma patients leads to a considerable reduction in the use of blood products (FFP, RBCs and cryoprecipitate) and that survival improved and bleeding stopped earlier.” “Therefore, PCCs might have a place in control of trauma related bleeding, although this indication is currently off label.”
 and that survival improved and bleeding stopped earlier. Therefore, PCCs might have a place in control of trauma related bleeding, although this indication is currently off label.")
69
Referenced in Theusinger
Bruce D, Nokes TJ. Prothrombin complex concentrate (Beriplex P/N) in severe bleeding: experience in a large tertiary hospital. Crit Care 2008; 12:R105. This study emphasizes the value of PCC in reversing the effects of oral anticoagulant therapy in bleeding patients. It also demonstrates the potential value of PCC in controlling the bleeding in patients undergoing cardiac and other surgical procedures.
 in severe bleeding: experience in a large tertiary hospital. Crit Care 2008; 12:R105. This study emphasizes the value of PCC in reversing the effects of oral anticoagulant therapy in bleeding patients. It also demonstrates the potential value of PCC in controlling the bleeding in patients undergoing cardiac and other surgical. procedures.")
70
Algorithms – reduce blood products
“algorithm incorporates information obtained from the patient’s history, clinical presentation and routine coagulation laboratory and bedside viscoelastic coagulation tests.” “in the first 6 months after implementation of the algorithm, the use of FFP dropped by approximately 50% and RBCs as well as platelet administration decreased by approximately20% each.”

71
Conclusion - Theusinger
“Modern and future transfusion strategies are based on online bedside coagulation monitoring with specific goal-directed administration of antifibrinolytics, coagulation factors, RBCs, FFP and platelets to optimize coagulation early. This improves the patient’s outcome, minimizes the patient’s exposure to blood products and reduces costs.”

72
Current Opinion in Anaesthesiology 2009, 22:267–274
Purpose of Review: “New insights TIC - POC devices – New concepts Managing Massive Blood Loss” Time for changing coagulation management in trauma-related massive bleeding Dietmar Friesa, Petra Innerhoferb and Wolfgang Schobersbergerc Current Opinion in Anaesthesiology 2009, 22:267–274 Department of General and Surgical Critical Care Medicine, Innsbruck Medical University, Department of Anaesthesiology and Critical Care Medicine, Medical University Innsbruck and cInstitute for Sports Medicine, Alpine Medicine and Health Tourism (ISAG), Innsbruck and Hall, Innsbruck, Austria
, Innsbruck and Hall, Innsbruck, Austria.")
73
Recent Findings Trauma – aPC Pathway leads to Fibrinolytic Potential
Widespread use of Viscoelastic devices, (Rotem) highlights importance of Fibrinogen contribution to Clot Firmness Clot Firmness a precondition to cessation of bleeding Growing evidence – Targeted therapy, coagulation factor concentrates, guided by Viscoelastic measurements, (Rotem) Enables effective correction of Severe Coagulopathy
 highlights importance of Fibrinogen contribution to Clot Firmness. Clot Firmness a precondition to cessation of bleeding. Growing evidence – Targeted therapy, coagulation factor concentrates, guided by Viscoelastic measurements, (Rotem) Enables effective correction of Severe Coagulopathy.")
74
Dietmar Fries “In simple terms, to achieve clot formation and thus stop bleeding, sufficient amounts of thrombin and substrate are required.” In addition to activated platelets, on whose surface most of the thrombin is formed during propagation and amplification of coagulation, fibrinogen can be regarded as the primary substrate of coagulation [5,6].

75
Dietmar Fries (Traditional Lab), “tests have never been validated for the prediction of hemorrhagic tendency, as they reflect only the small amount of thrombin formed during initiation of coagulation and are unable to show the activity of factor XIII or TAFI.: [Thrombin-Activable Fibrinolysis Inhibitor] “In severely injured patients, impaired tissue perfusion triggers increased expression of thrombomodulin and thus activity of protein C, resulting in systemic anticoagulation and increased fibrinolysis through consumption of plasminogen activator inhibitor and low concentrations of TAFI [17–19].”
, tests have never been validated for the prediction of hemorrhagic tendency, as they reflect only the small amount of thrombin formed during initiation of coagulation and are unable to show the activity of factor XIII or TAFI.: [Thrombin-Activable Fibrinolysis Inhibitor] In severely injured patients, impaired tissue perfusion triggers increased expression of thrombomodulin and thus activity of protein C, resulting in systemic anticoagulation and increased fibrinolysis through consumption of plasminogen activator inhibitor and low concentrations of TAFI [17–19].")
76
Detmar Fries “The gold standard for reliable detection of acute hyperfibrinolysis is TEG/ROTEM [8–10], and their increasing use might expand our knowledge about the frequency of and conditions favoring hyperfibrinolysis.”

77
Dietmar Fries “ROTEM/TEG measurements of clot firmness in relation to fibrinogen polymerization can provide valuable information, as strong fibrin polymerization can compensate for the decrease in platelet contribution to clot firmness [51].”

78
Dietmar Fries “Clinical data from gynecology, neurology and cardiac surgery show that blood loss is increased when fibrinogen levels are below 150–200 mg/dl [61,62,63,64]. Because of the methodological shortcomings and the unavoidable time delay in plasma fibrinogen measurements, authors prefer to rely on functional thresholds (FIBTEM 7–10mm refers to fibrinogen concentration of about 150–200 mg/dl) for substituting fibrinogen.
 for substituting fibrinogen.")
79
Dietmar Fries “Until now data have been limited to small case series findings from experimental studies and in-vitro studies, whereas large randomized, placebo-controlled studies have been claimed to show clear benefit. Because of the ethical and methodological difficulties in conducting such studies in severely injured patients, it seems questionable whether such results will be available in the near future. However, available data indicate that it might be time to change coagulation management in trauma patients.”

80
Coagulation management in trauma patients
Dietmar Fries, Petra Innerhofer and Wolfgang Schobersberger Department of Anesthesia and Intensive Care Medicine, University of Innsbruck, Austria Correspondence to Dietmar Fries, MD, Department of Anesthesia and Intensive Care Medicine, University of Innsbruck, Anichstrasse 35, 6020 Innsbruck, Austria Tel: ; fax: ; Current Opinion in Anaesthesiology 2002, 15:217±223

81
“The critical concentration of 1
“The critical concentration of 1.0 g/l was reached in a study by Hiippala et al., when blood loss exceeded 142% of the calculated blood volume despite substitution of FFP [50]. However, it is impossible to determine the definitive critical level of Fibrinogen, because clinical circumstances vary and coinciding deficits of other hemostatic factors may also alter hemostatic competence. To increase the plasma fibrinogen level in a 70-kg subject by 100 mg/dl, a bolus of 3 g fibrinogen is needed, equivalent to 900 ml FFP.

82
Parameter: Clotting Time
CT - Clotting Time (seconds) – The time from the start of the test until first significant levels of a clot are detected. This measurement is initiated by adding a clot activator until an amplitude of 2 mm is reached. Description: CT - Clotting Time (seconds) – The CT describes how rapid fibrin formation starts. This parameter is related to, but not identical to the clotting time in a standard coagulation test for plasma. CT (clotting time): => initiation of clotting, thrombin formation, start of clot polymerization Clinical Application: The CT parameter facilitates the decision to substitute clotting factors (e.g. FFP, Thawed Plasma or Anticoagulant antidotes such as Protamine) In Thromboelastographic methods, more fibrin has to be formed and stabilized to connect the two moving parts of the cuvette compared to the optical endpoint coagulation tests. CT (clotting time): time from start of measurement until initiation of clotting => initiation of clotting, thrombin formation, start of clot polymerization CFT (clot formation time): time from initiation of clotting until a clot firmness of 20mm is detected => fibrin polymerization, stabilisation of the clot with thrombocytes and F XIII α Angle - (°) - The angle between the baseline and a tangent to the clotting curve through the 2mm CT point. MCF (maximum clot firmness): firmness of the clot => increasing stabilization of the clot by the polymerised fibrin, thrombocytes as well as F XIIIr ML (maximum lysis): reduction of the clot firmness after MCF in relation to MCF => stability of the clot (ML < 15%) or fibrinolysis (ML > 15% within 1h)
 – The time from the start of the test until first significant levels of a clot are detected. This measurement is initiated by adding a clot activator until an amplitude of 2 mm is reached. Description: CT - Clotting Time (seconds) – The CT describes how rapid fibrin formation starts. This parameter is related to, but not identical to the clotting time in a standard coagulation test for plasma. CT (clotting time): => initiation of clotting, thrombin formation, start of clot polymerization. Clinical Application: The CT parameter facilitates the decision to substitute clotting factors (e.g. FFP, Thawed Plasma or Anticoagulant antidotes such as Protamine) In Thromboelastographic methods, more fibrin has to be formed and stabilized to connect the two moving parts of the cuvette compared to the optical endpoint coagulation tests. CT (clotting time): time from start of measurement until initiation of clotting => initiation of clotting, thrombin formation, start of clot polymerization. CFT (clot formation time): time from initiation of clotting until a clot firmness of 20mm is detected => fibrin polymerization, stabilisation of the clot with thrombocytes and F XIII. α Angle - (°) - The angle between the baseline and a tangent to the clotting curve through the 2mm CT point. MCF (maximum clot firmness): firmness of the clot => increasing stabilization of the clot by the polymerised fibrin, thrombocytes as well as F XIIIr. ML (maximum lysis): reduction of the clot firmness after MCF in relation to MCF => stability of the clot (ML < 15%) or fibrinolysis (ML > 15% within 1h)")
83
Parameter: Clot Formation Time
CFT - Clot Formation Time (seconds) – The time from the measurement of CT until a fixed level of clot firmness. The CFT is the time between 2 mm amplitude and the 20 mm amplitude of the clotting signal. Description: CFT - Clot Formation Time (seconds) – The CFT describes the rate of initial clot formation mediated by thrombin-activated platelets, fibrin and activated factor XIII. (FXIIIa) CFT (clot formation time): => fibrin polymerization, stabilization of the clot with Platelets and F XIII Clinical Application: The CFT parameter facilitates the decision to substitute with Platelet Concentrate, or Fibrinogen Containing Products, such as FFP or Cryoprecipitate or both. A shortened CFT may be observed in a hypercoaguable state. Other parameters to be discussed later, such as MCF and Alpha angle can also be indicative of hypercoaguable states. CT (clotting time): time from start of measurement until initiation of clotting => initiation of clotting, thrombin formation, start of clot polymerization CFT (clot formation time): time from initiation of clotting until a clot firmness of 20mm is detected => fibrin polymerization, stabilisation of the clot with thrombocytes and F XIII MCF (maximum clot firmness): firmness of the clot => increasing stabilization of the clot by the polymerised fibrin, thrombocytes as well as F XIIIr ML (maximum lysis): reduction of the clot firmness after MCF in relation to MCF => stability of the clot (ML < 15%) or fibrinolysis (ML > 15% within 1h) may not be achieved in samples with a very low clot formation and therefore not be indicated.
 – The time from the measurement of CT until a fixed level of clot firmness. The CFT is the time between 2 mm amplitude and the 20 mm amplitude of the clotting signal. Description: CFT - Clot Formation Time (seconds) – The CFT describes the rate of initial clot formation mediated by thrombin-activated platelets, fibrin and activated factor XIII. (FXIIIa) CFT (clot formation time): => fibrin polymerization, stabilization of the clot with Platelets and F XIII. Clinical Application: The CFT parameter facilitates the decision to substitute with Platelet Concentrate, or Fibrinogen Containing Products, such as FFP or Cryoprecipitate or both. A shortened CFT may be observed in a hypercoaguable state. Other parameters to be discussed later, such as MCF and Alpha angle can also be indicative of hypercoaguable states. CT (clotting time): time from start of measurement until initiation of clotting => initiation of clotting, thrombin formation, start of clot polymerization. CFT (clot formation time): time from initiation of clotting until a clot firmness of 20mm is detected => fibrin polymerization, stabilisation of the clot with thrombocytes and F XIII. MCF (maximum clot firmness): firmness of the clot => increasing stabilization of the clot by the polymerised fibrin, thrombocytes as well as F XIIIr. ML (maximum lysis): reduction of the clot firmness after MCF in relation to MCF => stability of the clot (ML < 15%) or fibrinolysis (ML > 15% within 1h) may not be achieved in samples with a very low clot formation and therefore not be indicated.")
84
Parameter: α Angle α Angle - (°) - The angle between the baseline and a tangent to the clotting curve through the 2mm CT point. Description: α Angle - Describes the kinetics of clotting. Therefore, a larger alpha angle reflects the rapid clot formation mediated by thrombin-activated platelets, fibrin and activated factor XIII (FXIIIa); CFT becomes shorter as the alpha angle becomes larger. α Angle => the faster the clot builds increases the amplitude which is indicative of increased clot stability. Clinical Application: This parameter correlates to the parameter, CFT. Smaller α Angles typically suggest thrombocytopenia or hypofibrinogenemia. Whereas, a large α Angle may be observed in hypercoagulable states. CT (clotting time): time from start of measurement until initiation of clotting => initiation of clotting, thrombin formation, start of clot polymerization CFT (clot formation time): time from initiation of clotting until a clot firmness of 20mm is detected => fibrin polymerization, stabilisation of the clot with thrombocytes and F XIII α Angle - (°) - The angle between the baseline and a tangent to the clotting curve through the 2mm CT point. MCF (maximum clot firmness): firmness of the clot => increasing stabilization of the clot by the polymerised fibrin, thrombocytes as well as F XIIIr ML (maximum lysis): reduction of the clot firmness after MCF in relation to MCF => stability of the clot (ML < 15%) or fibrinolysis (ML > 15% within 1h)
; CFT becomes shorter as the alpha angle becomes larger. α Angle => the faster the clot builds increases the amplitude which is indicative of increased clot stability. Clinical Application: This parameter correlates to the parameter, CFT. Smaller α Angles typically suggest thrombocytopenia or hypofibrinogenemia. Whereas, a large α Angle may be observed in hypercoagulable states. CT (clotting time): time from start of measurement until initiation of clotting => initiation of clotting, thrombin formation, start of clot polymerization. CFT (clot formation time): time from initiation of clotting until a clot firmness of 20mm is detected => fibrin polymerization, stabilisation of the clot with thrombocytes and F XIII. α Angle - (°) - The angle between the baseline and a tangent to the clotting curve through the 2mm CT point. MCF (maximum clot firmness): firmness of the clot => increasing stabilization of the clot by the polymerised fibrin, thrombocytes as well as F XIIIr. ML (maximum lysis): reduction of the clot firmness after MCF in relation to MCF => stability of the clot (ML < 15%) or fibrinolysis (ML > 15% within 1h)")
85
Parameter: A20 A20 – (mm) – The clot firmness at the amplitude time point of 20 minutes after CT. Description: A20 – (mm) – Amplitude 20 represents the clot firmness at 20 minutes after CT. Clinical Application: Adirectly relates to the MCF. Often it facilitates a decision to use Platelet Concentrate or Fibrinogen containing components when the amplitude/value is below established reference ranges. CT (clotting time): time from start of measurement until initiation of clotting => initiation of clotting, thrombin formation, start of clot polymerization CFT (clot formation time): time from initiation of clotting until a clot firmness of 20mm is detected => fibrin polymerization, stabilisation of the clot with thrombocytes and F XIII α Angle - (°) - The angle between the baseline and a tangent to the clotting curve through the 2mm CT point. MCF (maximum clot firmness): firmness of the clot => increasing stabilization of the clot by the polymerised fibrin, thrombocytes as well as F XIIIr ML (maximum lysis): reduction of the clot firmness after MCF in relation to MCF => stability of the clot (ML < 15%) or fibrinolysis (ML > 15% within 1h)
 – Amplitude 20 represents the clot firmness at 20 minutes after CT. Clinical Application: Adirectly relates to the MCF. Often it facilitates a decision to use Platelet Concentrate or Fibrinogen containing components when the amplitude/value is below established reference ranges. CT (clotting time): time from start of measurement until initiation of clotting => initiation of clotting, thrombin formation, start of clot polymerization. CFT (clot formation time): time from initiation of clotting until a clot firmness of 20mm is detected => fibrin polymerization, stabilisation of the clot with thrombocytes and F XIII. α Angle - (°) - The angle between the baseline and a tangent to the clotting curve through the 2mm CT point. MCF (maximum clot firmness): firmness of the clot => increasing stabilization of the clot by the polymerised fibrin, thrombocytes as well as F XIIIr. ML (maximum lysis): reduction of the clot firmness after MCF in relation to MCF => stability of the clot (ML < 15%) or fibrinolysis (ML > 15% within 1h)")
86
Parameter: Maximum Clot Firmness
MCF – (mm) – The MCF - Maximum Clot Firmness measures clot firmness, thus, overall clot stability. Description: MCF is the maximum amplitude that is reached prior to clot being dissolved by fibrinolysis. Clinical Application: A low MCF suggests decreased clot firmness. Whereas, an elevated MCF may indicate a hypercoagulable state. MCF correlates to A20. CT (clotting time): time from start of measurement until initiation of clotting => initiation of clotting, thrombin formation, start of clot polymerization CFT (clot formation time): time from initiation of clotting until a clot firmness of 20mm is detected => fibrin polymerization, stabilisation of the clot with thrombocytes and F XIII MCF (maximum clot firmness): firmness of the clot => increasing stabilization of the clot by the polymerised fibrin, thrombocytes as well as F XIIIr ML (maximum lysis): reduction of the clot firmness after MCF in relation to MCF => stability of the clot (ML < 15%) or fibrinolysis (ML > 15% within 1h)
 – The MCF - Maximum Clot Firmness measures clot firmness, thus, overall clot stability. Description: MCF is the maximum amplitude that is reached prior to clot being dissolved by fibrinolysis. Clinical Application: A low MCF suggests decreased clot firmness. Whereas, an elevated MCF may indicate a hypercoagulable state. MCF correlates to A20. CT (clotting time): time from start of measurement until initiation of clotting => initiation of clotting, thrombin formation, start of clot polymerization. CFT (clot formation time): time from initiation of clotting until a clot firmness of 20mm is detected => fibrin polymerization, stabilisation of the clot with thrombocytes and F XIII. MCF (maximum clot firmness): firmness of the clot => increasing stabilization of the clot by the polymerised fibrin, thrombocytes as well as F XIIIr. ML (maximum lysis): reduction of the clot firmness after MCF in relation to MCF => stability of the clot (ML < 15%) or fibrinolysis (ML > 15% within 1h)")
87
Parameter: Maximum Lysis
ML - (%) – Maximum Lysis is a parameter that describes the degree of fibrinolysis relative to the MCF achieved during the measurement. (Percent reduction of clot firmness after MCF in relation to MCF). Description: A ML of 5% means that during a selected period of observation, the MCF decreased by 5%. ML (Maximum Lysis): => is not calculated at any fixed time, rather it is defined as the % of lysis at the end of the measurement. Consider: Total run time and the time after MCF. Clinical Application: ML (maximum lysis): Evaluate in conjunction with Lysis Index. ML => stability of the clot (ML < 15%) or fibrinolysis (ML > 15% within 1h) CFT (clot formation time): time from initiation of clotting until a clot firmness of 20mm is detected => fibrin polymerization, stabilisation of the clot with thrombocytes and F XIII α Angle - (°) - The angle between the baseline and a tangent to the clotting curve through the 2mm CT point. MCF (maximum clot firmness): firmness of the clot => increasing stabilization of the clot by the polymerised fibrin, thrombocytes as well as F XIIIr ML (maximum lysis): reduction of the clot firmness after MCF in relation to MCF => stability of the clot (ML < 15%) or fibrinolysis (ML > 15% within 1h)
 – Maximum Lysis is a parameter that describes the degree of fibrinolysis relative to the MCF achieved during the measurement. (Percent reduction of clot firmness after MCF in relation to MCF). Description: A ML of 5% means that during a selected period of observation, the MCF decreased by 5%. ML (Maximum Lysis): => is not calculated at any fixed time, rather it is defined as the % of lysis at the end of the measurement. Consider: Total run time and the time after MCF. Clinical Application: ML (maximum lysis): Evaluate in conjunction with Lysis Index. ML => stability of the clot (ML < 15%) or fibrinolysis (ML > 15% within 1h) CFT (clot formation time): time from initiation of clotting until a clot firmness of 20mm is detected => fibrin polymerization, stabilisation of the clot with thrombocytes and F XIII. α Angle - (°) - The angle between the baseline and a tangent to the clotting curve through the 2mm CT point. MCF (maximum clot firmness): firmness of the clot => increasing stabilization of the clot by the polymerised fibrin, thrombocytes as well as F XIIIr. ML (maximum lysis): reduction of the clot firmness after MCF in relation to MCF => stability of the clot (ML < 15%) or fibrinolysis (ML > 15% within 1h)")
88
Expected Values INTEM HEPTEM Comparison with INTEM.
CT (sec) CFT (sec) α –angle (°) A20 (mm) MCF (mm) 45-110 70-81 51-72 HEPTEM Comparison with INTEM. A better clot quality in HEPTEM as compared to INTEM indicates the presence of unfractionated heparin in the sample. The above reference ranges for INTEM were established in 3 US centers on a reference sample group of healthy blood donors. (n=149)
 CFT (sec) α –angle (°) A20 (mm) MCF (mm) HEPTEM. Comparison with INTEM. A better clot quality in HEPTEM as compared to INTEM indicates the presence of unfractionated heparin in the sample. The above reference ranges for INTEM were established in 3 US centers on a reference sample group of healthy blood donors. (n=149)")
89
Algorithm

90
Platelet Function Testing

91
TEG’s Platelet Mapping
TEG claims: With the Platelet Mapping Assay, TEG can detect Plavix and ASS There are 2 recent articles (Alström et al, Scharbert et al) showing that the PMA is not useful for patient assessment Platelet Mapping Assay – 1 hour, $140, 4 separate test each with a margin of error of 5%. Calculated Platelet function “A novel modification of the Thrombelastograph assay, isolating platelet function, correlates with optical platelet aggregation” ROBERT M. CRAFT, JACK J. CHAVEZ, STUART J. BRESEE, DALE C. WORTHAM, ELI COHEN, and ROGER C. CARROLL, TENNESSEE, and NILES, ILLINOIS This article was funded by Haemoscope – Eli Cohen was CEO of Haemoscope
 showing that the PMA is not useful for patient assessment. Platelet Mapping Assay – 1 hour, $140, 4 separate test each with a margin of error of 5%. Calculated Platelet function. A novel modification of the Thrombelastograph assay, isolating platelet function, correlates with optical platelet aggregation ROBERT M. CRAFT, JACK J. CHAVEZ, STUART J. BRESEE, DALE C. WORTHAM, ELI COHEN, and ROGER C. CARROLL, TENNESSEE, and NILES, ILLINOIS. This article was funded by Haemoscope – Eli Cohen was CEO of Haemoscope.")
92
Referent: msc

93
Material and Methods: Sixty patients were included
Material and Methods: Sixty patients were included. Platelet inhibition was analyzed with flow cytometry including phosphorylation status of the vasodilator-stimulated phosphoprotein (VASP-assay) and two bedside analyzers, VerifyNow-System and PlateletMapping, a modified thrombelastograph. Please cite this article as: Alström U, et al, Platelet inhibition assessed with VerifyNow, flow cytometry and PlateletMapping in patients undergoing heart surgery, Thromb Res (2009), doi: /j.thromres
 and two bedside analyzers, VerifyNow-System and PlateletMapping, a modified thrombelastograph. Please cite this article as: Alström U, et al, Platelet inhibition assessed with VerifyNow, flow cytometry and PlateletMapping in patients undergoing heart surgery, Thromb Res (2009), doi: /j.thromres")
94
“the value of these tests in identifying patients with increased risk for bleeding during heart surgery appears limited.” PlateletMapping-MAADP and MAAA did not correlate to any of the above flow cytometry variables, nor to VASP-assay, VerifyNowP2Y12 Please cite this article as: Alström U, et al, Platelet inhibition assessed with VerifyNow, flow cytometry and PlateletMapping in patients undergoing heart surgery, Thromb Res (2009), doi: /j.thromres
, doi: /j.thromres")
95
Conclusion: “We found a modest agreement between the methods for preoperative platelet inhibition, though not for PlateletMapping-MAADP. There was a correlation between preoperative platelet inhibition measured by VerifyNowP2Y12 and surgical blood loss or transfusion requirements. However, for the individual patient, preoperative use of VerifyNowP2Y12 as an instrument to decide bleeding and transfusion risk does not seem helpful” Please cite this article as: Alström U, et al, Platelet inhibition assessed with VerifyNow, flow cytometry and PlateletMapping in patients undergoing heart surgery, Thromb Res(2009),doi: /j.thromres
,doi: /j.thromres")
96
Evaluation of the Platelet MappingT'"1 Assay on rotational
thromboelastometry ROTEM® G. SCHARBERT, A. AUER, & S. KOZEK-LANGENECKER Department of Special Anesthesia and Pain Management, Medical University of Vienna, Guuwl I 8-20, 1090-Vienna, Austria (Received 6 November 2008; revised December 2008; accepted 2 December 2008)
")
97
“Whole blood was drawn from 22 adult volunteers and patients with and without antiplatelet medication. Platelet aggregability was determined in three whole blood assays: The Platelet Mapping Assay using both activators arachidonic assay (AA) and adenisine diphposphate (ADP) on TEG, it’s adapted version on Rotem, and the multiple electrode impedence aggregometer Multiplate.”
 and adenisine diphposphate (ADP) on TEG, it’s adapted version on Rotem, and the multiple electrode impedence aggregometer Multiplate.")
98
“Specificity of the AA- and ADP-activated Platelet Mapping™ Assay in the TEG® was lower than the respective tests in the ROTEM® and Multiplate® analysis.” “Thus limited correlation between various test modalities seems to be an inherent problem in platelet function monitoring.” “The Platelet Mapping TM Assay is currently recommended in a number of publications for antiplatelet drug monitoring with its correlation to clinical outcome (23). Our experiments, however, showed a high number of false positive and false negative results”

99
“In our experiment, specificity was higher for ROTEM® (40%) compared withTEG® (30%)”
“due to the overall unreliable test results obtained with the Platelet Mapping™ Assay we have decided not to implement this test in our hospital's everyday clinical routine.”

100
“Comparison of four tests to assess inhibition of platelet function by clopidogrel in stable coronary artery disease patients” Marie Lordkipanidze´ 1,2,3†, Chantal Pharand1,2,3†, Thuy Anh Nguyen1,3, Erick Schampaert2,4,5, Donald A. Palisaitis2,4,5, and Jean G. Diodati2,4,5*

101
“pre-specified sub study of a randomized, double-blind trial included 116 patients with stable coronary artery disease requiring diagnostic angiography. Patients received clopidogrel for 1 (300 or 600 mg) or 7 days (300 þ 75 or 150 mg daily) before the procedure. Blood samples obtained before clopidogrel initiation and before diagnostic coronary angiography were assayed using light transmission aggregometry [adenosine diphosphate (ADP) 5 and 20 mM as the agonist], whole-blood aggregometry (ADP 5 and 20 mM), PFA-100w (Collagen-ADP cartridge), and VerifyNoww P2Y12.”
 before the procedure. Blood samples obtained before clopidogrel initiation and before diagnostic. coronary angiography were assayed using light transmission aggregometry [adenosine diphosphate (ADP) 5 and 20 mM as the agonist], whole-blood aggregometry (ADP 5 and 20 mM), PFA-100w (Collagen-ADP cartridge), and VerifyNoww P2Y12.")
102
Conclusion: “At present, no platelet function assay can be acclaimed as optimal for quantifying the inhibition of platelet aggregation by clopidogrel.”

103
Value of PMA This is also reflected in evaluations of the assay
Good results in few evaluation articles using “normal donors” msc

104
TEG PMA Principle Final result is calculated by the following formula
Depending on the single values results which are 55 as a mean can also be 77 or 69 depending on the combination if errors Assay accuracy is questionable msc

105
A novel modification of the Thrombelastograph
assay, isolating platelet function, correlates with optical platelet aggregation ROBERT M. CRAFT, JACK J. CHAVEZ, STUART J. BRESEE, DALE C. WORTHAM, ELI COHEN, (CEO Heamoscope) and ROGER C. CARROLL KNOXVILLE, TENNESSEE, and NILES, ILLINOIS
 and ROGER C. CARROLL. KNOXVILLE, TENNESSEE, and NILES, ILLINOIS.")
106
From the Departments of Anesthesiology and Medicine, University
of Tennessee Graduate School of Medicine; and Haemoscope Corp. Supported by the University of Tennessee Anesthesiology Research Fund and the Physicians’ Medical Education and Research Foundation, as well as Haemoscope Corp, of which Dr Cohen is chief executive officer. Haemoscope Corp may benefit from these studies. Submitted for publication November 4, 2003; revision submitted January 20, 2004; accepted for publication January 28, 2004.

108
TEG’s “functional fibrinogen” & “rapid teg”
Both tests are significantly more expensive than respective ROTEM tests Both tests are less convenient (require more pipetting steps) Both tests use crimp cap vials (danger of injury, while working with potentially infective materials) FF test is Reopro (does not block platelets completely (Lang 2003/2004) Referent: msc
 Both tests use crimp cap vials. (danger of injury, while working with potentially infective materials) FF test is Reopro (does not block platelets completely (Lang 2003/2004) Referent: msc.")
109
Rapid TEG Rapid TEG assay is faster than Kaolin and even more useful in trauma (J. of Trauma, 2009) In a recent publication (J Trauma, 2009), RapidTEG has been advertized as giving faster results than Kaolin (mean 19.2 min vs 29.9 min). The publication says that for RapidTEG r time (CT) may not be evaluated (only k (CFT), alpha and MA (MCF) This is related to the fact that CT is immeasurable short in this assay. EXtem is faster and proven in clinical studies Referent: msc
, RapidTEG has been advertized as giving faster results than Kaolin (mean 19.2 min vs 29.9 min). The publication says that for RapidTEG r time (CT) may not be evaluated (only k (CFT), alpha and MA (MCF) This is related to the fact that CT is immeasurable short in this assay. EXtem is faster and proven in clinical studies. Referent: msc.")
110
Algorithms msc

111
msc

112
Examples msc

113
Correlation FF or fib-TEM with Clauss
Referent: msc

114
FIBTEM as a Indicator for Fibrinogen Substitution
FIBTEM correlates well to fibrinogen levels msc

Similar presentations


 patients Policy.>")


-Score: Probability of Mass Transfusion as Surrogate for Life Threatening Hemorrhage after Multiple Trauma The.>")
