Download presentation
Presentation is loading. Please wait.

1
Final Report Viren Bhanot

2
Work Done Rotary compressor – Its working and calculations
Small Experiment Line Bypass Heater Calibration Heat Balance Report Accumulator Dry-Out testing Accumulator Cooling Power measurements CMS Pixel Upgrade User’s Manual for Building 158

3
Rotary Compressor Sanyo Compressor Model no.: C-C140L5
Dedicated for CO2 Two-Stage compression Pressure rating of 90 bar (outlet, 2nd stage)
")
4
Matlab Compressor Calculations

5
Small Experiment Line 250W Cartridge Heater Swagelok Fittings
Concentric Heat Exchanger after Mass Flow Meter Actuators for Metering Valves

6
Heater Selection 250 W heater required
Cartridge, insertion heater for direct heating Inlet to heater perpendicular to its length Flow development analysed for selection Hydrodynamic and Thermodynamic flow development Low watt density required

7
Heater Selection Correlations Used: Hausen Stephan Shah/London
Flow Development Fully Developed Thermodynamically developing, Hydrodynamically developed Simultaneously developing

8
Heater Selection Specifications: Watlow Firerod Cartridge Heater
Ф -3/8”, Length – 7” Power W Watt Density – 5 W/cm2 4” No-heat zone Epoxy Seals to protect from moisture

9
Swagelok Fittings Heater mounted on reducer union
Inlet through Welding Tee fitting Tube inner dia = 1/2”, heater dia = 3/8” Line between mass flow meter and metering valve in a concentric internal heat exchanger. Whole Assembly Welded Together

10
CAD Model

11
Heater Assembly

12
Actuator Electrical Actuator for Swagelok metering valves
Two companies discovered: Hanbay inc. (Canada) Grotec (Germany) Actuator ordered from Hanbay (cost ~ $1500)
 Grotec (Germany) Actuator ordered from Hanbay (cost ~ $1500)")
13
Bypass Heater Calibration
Bypass Heater (2 kW) performance not satisfactory Virtually no heating at low powers, then sudden overheating at medium-high powers Output power not equal to power requested through PVSS Heater controlled through phase angle controller (inexpensive way of controlling heater) “Span” setting of heater too narrow. Corrected.
 performance not satisfactory. Virtually no heating at low powers, then sudden overheating at medium-high powers. Output power not equal to power requested through PVSS. Heater controlled through phase angle controller (inexpensive way of controlling heater) Span setting of heater too narrow. Corrected.")
14
Bypass Heater Calibration
Tests performed to measure heater power and compare it against input power (through PVSS) System run in single phase to measure enthalpy using Pressure and Temperature. Power o/p = Enthalpy Change x Massflow Rate Pressure, temperature measured across internal heat exchanger. Output power found to be not equal to input power
 System run in single phase to measure enthalpy using Pressure and Temperature. Power o/p = Enthalpy Change x Massflow Rate. Pressure, temperature measured across internal heat exchanger. Output power found to be not equal to input power.")
15
Bypass Heater Calibration

16
Bypass Heater Calibration
Phase Angle Controller chops up the sine-wave signal (4-20 mA) linear with time, instead of linear with output power Mustapha prepared MATLAB and PVSS programs to correctly calculate output power to match input power. New logic incorporated into PVSS by Lukasz. Works perfectly, and has been tested.
 linear with time, instead of linear with output power. Mustapha prepared MATLAB and PVSS programs to correctly calculate output power to match input power. New logic incorporated into PVSS by Lukasz. Works perfectly, and has been tested.")
17
Heat Balance Parameters measured Preq Qpump Qheater Qin Qcond Qcomp
Heater Calibration tests expanded to give overview of heat balance for entire system. Heat addition/extraction measured to get an idea of system performance Compressor data also included Parameters measured Preq Qpump Qheater Qin Qcond Qcomp

18
Heat Balance

19
Heat Balance

20
Heat Balance Conclusions drawn:
Up until 1100W, the readings are reliable. Readings above 1100W are unreliable due to premature boiling of CO2 inside the tubes. Offset between requested power and power measured is due to heat added by the pump and surroundings. Compressor cooling capacity is lower than expected (this data is already 2 months old)
")
21
Accumulator Dry-Out Testing
Accumulator heater in thermo-syphon configuration During start-up, accumulator heated for long time At higher vapor pressure, higher vapor density. At higher density, lower convective currents Risk of dry-out, heater melting.

22
Accumulator Dry-Out Testing
A parameter called Thermal Resistance used to calculate dry-out thresholds 𝑅 𝑡ℎ = 𝑇 ℎ𝑒𝑎𝑡𝑒𝑟 − 𝑇 𝑠𝑎𝑡_𝑎𝑐𝑐𝑢 𝐻𝑒𝑎𝑡𝑒𝑟 𝑃𝑜𝑤𝑒𝑟 Accumulator heated for long periods with 250, 500, 750, 900 and 1000W power Rth calculated for all data points, and plotted against accumulator saturation temperature. Combined graph for all readings plotted

23
Accumulator Dry-Out Testing

24
Accumulator Dry-Out Testing
Conclusions drawn: At 250W Heater Power, dry- out is not witnessed. Higher the heater power, lower the saturation temperature at which dry-out occurs. Some unexplained bumps are observed at higher powers, through sudden, steep rises and falls in the values of Thermal Resistance S. No. Heater Power Dry-Out Saturation Temperature (°C) 1 250 N/A 2 500 27 3 750 22 4 900 19 5 1000 17
 N/A")
25
Accumulator Cooling Power
Tests done to measure cooling power in accumulator It was expected that cooling at 100% valve opening should match heating at 100% heater power (1 kW) This was not the case Some cooling power lost because cooling spiral passes through liquid CO2.
 This was not the case. Some cooling power lost because cooling spiral passes through liquid CO2.")
26
Accumulator Cooling Power
Accumulator cooled and then heated at specific rates. For example, 50% CV1105 valve opening corresponds to 50% heater power, 500W Slopes of cooling and heating measured. Cooling slope observed to be less than heating slope. Since slope unequal, this method not enough to determine cooling power

27
Accumulator Cooling Power

28
Accumulator Cooling Power
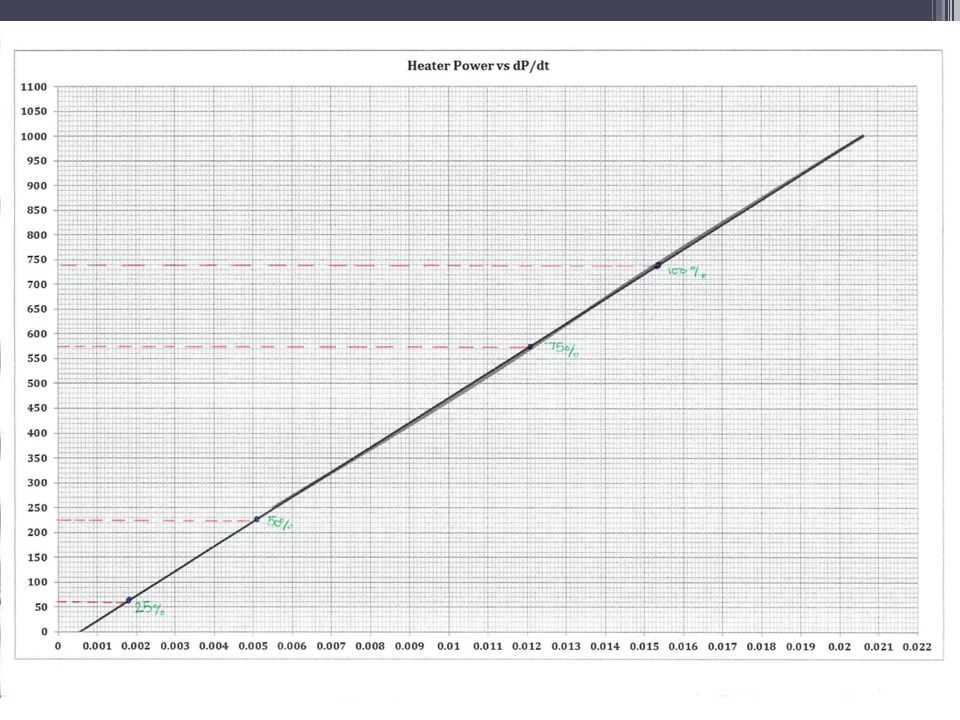
Rough estimate obtained by plotting Heater’s power versus the value ‘dp/dt’ (change in pressure per unit time) dp/dt values of cooling spiral superimposed on heating graph. This gives rough but useful estimate of cooling capacity.
 dp/dt values of cooling spiral superimposed on heating graph. This gives rough but useful estimate of cooling capacity.")
31
Accumulator Cooling Power
Cooling Power Measured: Valve Opening Cooling Power 25% 60 50% 225 75% 575 100% 740

32
Accumulator Cooling Power
Conclusions: Cooling power does not correspond to its respective heating power. The maximum cooling power available is only 740W. The cooling power at 25% valve opening is not a quarter of the full cooling power. This is due to the inertia of the fluid. Cooling Power is not completely linear over the entire range.

33
CMS Pixel Upgrade CMS Pixel layout being discussed with various iterations proposed. Latest proposal (at that time) was simulated to measure the fluid temperature and pressure drop. Results were compared with Bart’s results (with his global calculator) Joao’s calculator was used in Matlab, and simulations with Friedel and Chisholm correlations. The simulation results were similar to, but not exactly the same as Bart’s own simulations.
![]()
34
CMS Pixel Upgrade
![]()
35
CMS Pixel Upgrade
![]()
36
User’s Manual The eventual aim of project was to prepare User Manual to allow external researchers (Belle, SLAC, IBL) to use the system without distracting Bart, Lukasz or Joao! The manual is about 60 pages long and will hopefully be used by someone in the future.
 to use the system without distracting Bart, Lukasz or Joao! The manual is about 60 pages long and will hopefully be used by someone in the future.")
37
Thank You

Similar presentations


 CO 2 Cooling for PXD/SVD IDM Meeting.>")


>")
