Download presentation
Presentation is loading. Please wait.

1
The Changing Face of the Texas Labor Market Stephen F. Austin University Nacogdoches, Texas April 10, 2003 Richard Froeschle, Director Career Development Resources(CDR) rich@cdr.state.tx.us (512) 491-4941
 (512)")
3
Economic forecasting is a field that gives Astrology a good name!

4
A Changing Texas Labor Market 1. If its not a recession, its still not fun! Downturn affects output, employment, tax revenues, employment in all sectors 2. Economists still very divided on duration, turning point signals, and level of job growth in recovery

5
Harry Truman is purported to have said, All my economists say, on the one, or on the other hand…what I really need is a one-handed economist.

6
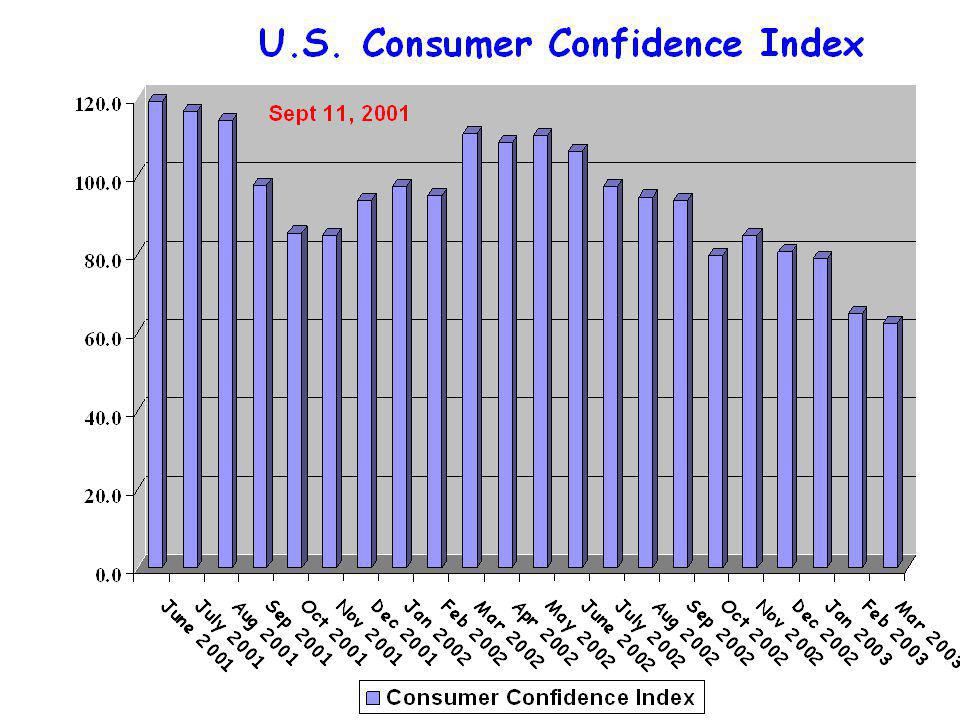
Short Term Trends and the Economy Overall job growth not occurring Manufacturing jobs hardest hit, esp. telecom Low interest rates good for some sectors, housing, financial services, autos Low stock prices lead to cost containment. Bad market returns affect Insurance, wealth effect War uncertainty tempers business expansion plans High energy prices hit production costs, consumers War & terrorism affect some industries more… airlines, travel/lodging, retail Government, health services leading growth engines Consumer confidence levels fall with war, gas prices, layoffs, corporate corruption, market malaise

8
What do labor economists agree on? 1.There will be no shortage of opportunities in the knowledge sector for those with the education and intelligence to perform in it 2.All jobs, even the most low-skilled, will require higher levels of basic education, math, communication and technology skills…for survival and growth 3. Those without some specialized knowledge or skill are likely to suffer declining real wages

9
What do labor economists agree on? (II) 4. The Digital Divide exists and those on the wrong side will have limited hiring and advancement opportunities 5. Jobs requiring human touch will continue to be in demand e.g. health services and nursing, construction…no robot plumbers! 6. Workplace settings and business practices and knowledges will change rapidly, making lifelong learning essential e.g. life after paving the cow path

10
A Changing Texas Labor Market (2) 3. Continued transition to services, not products for value-added and employment opportunities Increase in high tech and high touch jobs What comes after the Knowledge economy? The Creativity Economy? The Celebrity Economy?

11
Fewer Jobs in Goods Producing Sectors…

12
Airlines, Oil & Gas, Computer and Accounting Services Shedding Jobs

13
Education, Health & Govt. Buoy Economy

14
U.S. Industries Adding Most Jobs 2000-2010 1. Computer and Data Processing1.80 mil 2. Retail Trade1.60 mil 3. Eating & Drinking Places1.48 mil 4. Offices of Health Practitioners1.24 mil 5. State and Local Education1.07 mil 6. Misc. Business Services1.00 mil 7. Construction824 thou 8. State and Local Government808 thou 9. Wholesale Trade776 thou 10. Health Services, NEC689 thou 13. Residential Care512 thou 14. Hospitals509 thou 16. Nursing/Personal Care Facilities394 thou

15
More Jobs in Services… Texas Absolute Job Growth 1999-2002 Educational Services Food Services/Drinking Places Ambulatory Health Care Services Professional and Technical Services Local Government Specialty Trade Contractors General Merchandise Stores Hospitals Heavy and Civil Construction Motor Vehicle and Parts Dealers

16
Job Declines in Goods Producing Sectors Texas Industries Losing Most Jobs 1999-2002 Agriculture/Forestry Support Computer/Electronic Manufacturing Apparel Manufacturing Transportation Equip Manufacturing Fabricated Metal Manufacturing Chemical Manufacturing Oil & Gas Extraction Food & Beverage Stores Administrative Support Services Federal Government

17
Texas Exports 2001 Computer/Electronics$25.7 billion27.0% Chemicals$14.6 billion15.4% Machinery, ex. Electrical$12.8 billion13.5% Transportation Equipt$11.3 billion11.8% Electrical Components $4.8 billion 5.1% Petroleum Products $3.7 billion 3.9% Fabricated Metals $3.2 billion 3.4% Plastic & Rubber Prod $2.8 billion 2.9% Food & Kindred $2.6 billion 2.7% Primary Metal Manuf. $2.1 billion 2.2% Agricultural Products $1.9 billion 2.0%

18
A Changing Texas Labor Market (3) 4. Technology implementation will enhance productivity and transform many job sites and skill sets. What jobs can be replaced by technology (sheep shearing, textile inspector, electronic insurance processing, voice recognition)? What jobs does technology create? see…. Burlington/Nano-Tex, Texasinabox.com
. What jobs does technology create. see…. Burlington/Nano-Tex, Texasinabox.com.")
19
Technology Meets Apparel Manufacturing

20
Technology Meets Barbeque…

21
More Output…Not More Workers U.S. Projections 2000-2010 (annual) Industry SectorOutputEmployment Computers & Related7.0%1.6% Chemicals3.3%.4% Industrial Machinery6.1%.5% Transportation Equipment3.7%1.1% Motor Vehicles4.4%0.8% Electrical Equipment5.3%0.6% Fabricated Metal Products3.6%0.8% Plastics and Rubber4.0%1.4% Telephone Communications6.5%1.2% Computer Data Processing8.0%6.4%
 Industry SectorOutputEmployment Computers & Related7.0%1.6% Chemicals3.3%.4% Industrial Machinery6.1%.5% Transportation Equipment3.7%1.1% Motor Vehicles4.4%0.8% Electrical Equipment5.3%0.6% Fabricated Metal Products3.6%0.8% Plastics and Rubber4.0%1.4% Telephone Communications6.5%1.2% Computer Data Processing8.0%6.4%.")
22
A Changing Texas Labor Market (4) 5. More jobs in small firms, greater use of leased and independent contract labor means fewer and shorter career ladders 6. Higher overall workforce education levels encourage fewer internal career ladders, fewer growth options for unskilled when they get a job e.g. hire outside folks who dont need training

23
Texas Employment Distribution by Firm Size First Quarter 2001 Firm Of Firms Statewide Of Workers Statewide SizeNo. Percent No. Percent 0-4243,78855.3% 462,175 5.0% 5-9 77,81617.7% 520,016 5.6% 10-19 52,23911.9% 723,532 7.7% 20-49 38,203 8.7% 1,203,531 12.9% 50-99 14,554 3.3% 1,040,977 11.1% 100-249 8,820 2.0% 1,396,492 15.0% 250-499 2,826 0.6% 992,058 10.6% 500-999 1,242 0.3% 891,835 9.6% 1,000 plus 843 0.2% 2,106,265 22.6% Total440,331 100.0% 9,336,881 100.0%

24
Pattern of Change 1989-2001 Texas Employment Percentages by Firm Size Firm Pct of Workers Trend Size 1989 1992 1996 2001 0-4 4.92 5.78 5.16 5.0 SMALL INCREASE 5-9 5.68 7.02 5.97 5.6 SLIGHT DECLINE 10-19 6.92 9.12 8.01 7.7 INCREASE 20-49 10.26 14.52 13.11 12.9 INCREASE 50-99 8.3411.62 10.91 11.1 BIG INCREASE 100-249 11.5214.64 14.56 15.0 BIG INCREASE 250-499 9.24 9.04 9.77 10.6 INCREASE 500-999 9.02 7.87 9.53 9.6 SMALL INCREASE 1000 + 34.10 20.48 22.98 22.6 MAJOR DECLINE

25
A Changing Texas Labor Market (5) 7. For those working within companies, organizational structure moving from pyramid to flatter pyramid to hour glass, so fewer ports of entry for low skill workers 8. Workplace earnings are increasingly correlated with education and earnings inequality is increasing based on education and the Digital Divide

27
Changing Nature of Work: New Paradigm for Career Ladders 1.Increased employment growth in service industries with higher percentages of workers in the secondary labor market 2. More jobs being created in smaller firms with shorter or less well-defined promotional ladders 3. Increased role for contingent workers, outsourcing, independent contractors with few formal promotional ladders

28
Distribution of U.S. Employment by Education Category Education Category Employment 2000 2010 Percent distribution Jobs Added Between 2000-2010 Mean Annual Earnings 2000 Bachelors Degree or higher 20.7%21.8%29.3%$56,553 First Professional Degree 1.4% 1.7%$91,424 Doctoral Degree 1.0% 1.1% 1.6% $52,146 Masters Degree 1.0% 1.5%$43,842 Bachelors plus work experience 5.0%5.2% 6.4% $69,967 Bachelors Degree 12.2%13.0% 18.1% $48,440 Associate Degree 3.5%4.0%7.3%$41,488 Postsecondary vocational award 4.6% 4.7%5.5% $31,296 Work experience 7.2% 8.5% 6.9%5.0% $40,881 Long-term OJT 8.0%4.2% $33,125 Moderate-term OJT 19.0% 18.4%14.1% $29,069 Short-term OJT 36.6%36.3% 34.6%$19,799

29
Lifetime Earnings by Education Level in Texas Education LevelEstimated Estimated Texas 2000 Lifetime Hourly Work Life Hours Earnings Earnings Short-term training83,200 $8.26$687,232 Moderate-term training83,200$11.32$941,824 Long-term OJT*83,200$12.12 $1,008,384 Work Experience83,200$15.85 $1,318,720 Post-sec Vocational Award83,200$13.30 $1,106,560 Associates Degree83,200$17.72 $1,474,304 Bachelors Degree83,200$19.74 $1,642,368 Bachelors + Experience83,200$24.82 $2,065,024 Masters Degree83,200$18.51 $1,540,032 Doctoral Degree83,200$19.53 $1,624,896 First Professional Degree 83,200$35.61 $2,962,752

30
A Changing Texas Labor Market (6) 9. Globalization is changing economic theory, business practices and labor supply options 10. Changing demography affects everything from education needs, working with diversity, consumer tastes, tax structure, retirement

31
Population Pyramids for Anglo and Hispanic Ethnic Groups in Texas, 2000 Male Female AngloHispanic

32
Educational Attainment Concerns Hispanics are much less likely to complete HS (62.8%) than Blacks (86.8%) or Whites (94%) Hispanic drop out rates (28.6%) are twice as high as Blacks and four time higher than Whites Hispanic and Black 15-17 year olds are more likely to be below modal grade Hispanics HS grads are less likely to be enrolled in college than Blacks or Whites and much less likely to have received a Bachelors degree.
 than Blacks (86.8%) or Whites (94%) Hispanic drop out rates (28.6%) are twice as high as Blacks and four time higher than Whites Hispanic and Black year olds are more likely to be below modal grade Hispanics HS grads are less likely to be enrolled in college than Blacks or Whites and much less likely to have received a Bachelors degree.")
33
A Changing Texas Labor Market (7) 11. A changing industry mix is resulting in changing occupational demand and skill sets, with an emphasis on lifelong learning.

34
Projected Fastest Growing Occupations BLS National 2000-2010 Fastest Growing Computer Software Engineers Applications Computer Support Specialists Computer Software Engineers Systems Network Administrators Systems Communication Analyst Desktop Publishers Database Administrators Personal Home Care Aides Computer Systems Analysts Medical Assistants Adding Most Jobs Fast food Prep Wrkers Customer Service Reps Registered Nurses Retail Sales Workers Computer Support Specialists Cashiers, ex. Gaming General Office Clerks Security Guards Software Applications Engineers Waiter/Waitress

35
Occupational Growth in Texas Fastest Growing 2000-2010 1. Computer Support Specialists 2. Computer Software Engineers, Apps 3. Network & Systems Administrators 4. Desktop Publishers 5. Computer Software Engineers, Systems 6. Network & Data Communications Analysts 7. Computer Specialist, NEC 8. Database Administrators 9. Medical Records Technician 10. Social Services Assistants 11. Special Education Teachers 12. Computer Systems Analysts 13. Medical Assistants 14. Physician Assistants 15. Information Systems Mgrs.

36
Occupational Growth in Texas Most Jobs Created 2000-2010 1. Customer Service Representatives 2. Food Prep and Serving Workers, Fast Food 3. Child Care Workers 4. Retail Salespersons 5. Registered Nurses 6. Cashiers 7. Computer Support Specialists 8. Office Clerks, General 9. Waiters & Waitresses 10. General and Operations Managers 11. Elementary School Teacher 12. Teacher Assistants 13. Secondary School Teacher 14. Janitors and Cleaners 15. Truck Drivers, Heavy and Tractor Trailer

38
CDR Products and Services

39
Texas CARES 2002

40
Career Alternatives Resource Evaluation System Evaluate Different Programs of Study, Career Pathways, and Training Requirements-Explore Occupations to Programs Relationships Compare Up to 4 Colleges or Occupations Side By Side Occupational, Texas College and Career Preparation Videos Explore Occupations and Programs By Career Clusters Texas Employers With Contact Information, Mapping O*NET 3.0 Databases with K,S,As Texas CARES Formal Assessment Tools: Interest Profiler and Work Importance Locator Occupational Information Covering State and LWDBs, KSA, Educational Requirements and Expected Job Outlook CD ROM and Internet Portal combine best of both worlds

41
Career Development Resources Texas Job Hunters Guide

42
Career Development Resources Succeed at Work Workforce Magazine Starting a New Job Managing Your Career Work Ethics Maintaining a Proper Attitude Living a Balanced Life

43
Career Development Resources Licensed Occupations and Apprenticeship Program Contacts in Texas

44
Career Development Resources Starting the Conversation: Parents Guide to Student Career Development

45
Career Development Resources Emerging and Evolving Occupations in Texas

46
Career Development Resources Labor Specialists Essays on Labor Market Topics for Workforce Planners or Case Workers Technology Workers In The New Texas Economy Biotechnology: Impact On Emerging and Evolving Occupations in Texas NEW! Student Follow-up

47
Sources for LMI Data 1. SOCRATES Website http://socrates.cdr.state.tx.us 2. TRACER www.twc.state.tx.us/lmi/tracer/tracerhome.htm 3. iOSCAR skills transferability system www.iOSCAR.org 4. Career Development Resources (CDR) Website www.cdr.state.tx.us 5. Career Development Resources (CDR) Hotline 1-800-822-PLAN
 Website 5. Career Development Resources (CDR) Hotline PLAN.")
Similar presentations


 Motion Controller Design for A Class of Second-order Systems Center for Self-Organizing Intelligent.>")


