Download presentation
Presentation is loading. Please wait.

1
Trajet d'une expatriée : de la phylogénie du VIH au traitement de la grippe, et de Paris à San Francisco Colombe Chappey DEA 1986, PhD 1992

2
Modélisation Reconnaissance de Formes (These ’92) Bioinformatique
Statistiques Cliniques Personalized Health Care (Soins personnalisés) DEA 1986 Bioinformatique Reconnaissance de Formes (These ’92) Essais Cliniques Analyse d’images Modélisation Epidémiologie Analyse Exploratoire Bio-marqueurs predictifs Epidémiologie Moleculaire Transmission de la grippe Programmation (Computer Science)
 DEA Bioinformatique. Reconnaissance. de Formes. (These ’92) Essais. Cliniques. Analyse. d’images. Modélisation. Epidémiologie. Analyse. Exploratoire. Bio-marqueurs. predictifs. Epidémiologie. Moleculaire. Transmission. de la grippe. Programmation. (Computer Science)")
3
Au cours de mon ‘trajet’…
Statistiques Cliniques Personalized Health Care (Soins personnalisés) DEA 1986 Bioinformatique Reconnaissance de Formes (These ’92) Essais Cliniques Analyse d’images Modélisation Epidémiologie Analyse Exploratoire Bio-marqueurs predictifs Epidémiologie Moleculaire VIH Transmission de la grippe Programmation (Computer Science)
 DEA Bioinformatique. Reconnaissance. de Formes. (These ’92) Essais. Cliniques. Analyse. d’images. Modélisation. Epidémiologie. Analyse. Exploratoire. Bio-marqueurs. predictifs. Epidémiologie. Moleculaire. VIH. Transmission. de la grippe. Programmation. (Computer Science)")
4
Partager mon experience
Transitions de la recherche publique en France aux Etat-Unis De l’’Academic’ au ‘privé’ de la petite Biotech a la grosse ‘Pharma’ Données: Explosion des données genetiques disponibles Nouvelles technologies de sequencages L’importance du ‘to think outside the box’ (en dehors de sa bulle) Position unique du bioinformaticien/biostatisticien entre données et idées “Opportunities is often missed because it is dressed in overalls and looks like work” (Thomas Edison}
 Position unique du bioinformaticien/biostatisticien entre données et idées. Opportunities is often missed because it is dressed in overalls and looks like work (Thomas Edison}")
5
Reconnaissance de motifs appliquée a la comparaison de sequences biologiques
Comparaison de séquences nucleiques/proteines -> Alignement des éléments/motifs en commun -> pondérer les différences/mutations et les insertions/deletions …A G G T T G C… …A G G T C…

6
Comparaison de séquences biologiques de Virus d’immunodéficience
9 séquences de VIH type 1 1 séquences VIH type 2 5 séquences de VIS Le nombre de sequences de VIH a tres vite augmente. Certaines séquences sont plus similaires que d’autres 1988

7
MASH : Algorithme d’alignement de plusieurs séquences
Chappey C, Danckaert A, Dessen P, Hazout S. MASH an interactive multiple alignment and consensus sequence construction. Comp. Applic. Biosci. 1991; 7:

8
Distance entre séquences
Applications Distance entre séquences Classification time Homogénéité et hétérogénéité par region Chappey C, Danckaert A, Dessen P, Hazout S. MASH an interactive multiple alignment and consensus sequence construction. Comp. Applic. Biosci. 1991; 7:

9
Cas du Dentiste

10
Prediction de Structure/function de la Proteine d’Enveloppe du VIF
Profile of structural constraints= based on quantification of amino acid replacements Selection for change = Profile of the ratio of nonsynonymous to synonymous change proportions (nsi/si, si) Pancino G, Chappey C, Saurin W, Sonigo P. B epitopes and selection pressures in feline immunodeficiency virus envelope glycoproteins. J. Virol. 1993; 67: Pancino G, Fossati I, Chappey C, Castelot S, Hurtrel B, Moraillon A, Klatzmann D, Sonigo P. Structure and variations of feline immunodeficiency virus envelope glycoproteins. Virology 1993; 192:
 Pancino G, Chappey C, Saurin W, Sonigo P. B epitopes and selection pressures in feline immunodeficiency virus envelope glycoproteins. J. Virol. 1993; 67: Pancino G, Fossati I, Chappey C, Castelot S, Hurtrel B, Moraillon A, Klatzmann D, Sonigo P. Structure and variations of feline immunodeficiency virus envelope glycoproteins. Virology 1993; 192:")
11
Bilan des années de These
(+) Tremplin pour les collaborations Institut Pasteur, France Agence Nationale Recherche Sida (ANRS) Institut Cochin de Genetique Moleculaire (ICGM) HIV database de Los Alamos National Laboratory, NM (+) Publications # Méthodes 2 Application du logiciel d’alignement Human immunodeficiency virus type 1 4 Transmission HIV mother-infant 5 Simian / human T-cell lymphotropic virus type 1 3 Simian immunodeficiency virus 1 Feline immunodeficiency virus FIV 2 (-) Occasions manquées Commercialisation du logiciel d’alignment (alors que CLUSTAL…) Analyses non-publiées
 Tremplin pour les collaborations. Institut Pasteur, France. Agence Nationale Recherche Sida (ANRS) Institut Cochin de Genetique Moleculaire (ICGM) HIV database de Los Alamos National Laboratory, NM. (+) Publications # Méthodes 2. Application du logiciel d’alignement. Human immunodeficiency virus type 1 4. Transmission HIV mother-infant 5. Simian / human T-cell lymphotropic virus type 1 3. Simian immunodeficiency virus 1. Feline immunodeficiency virus FIV 2. (-) Occasions manquées. Commercialisation du logiciel d’alignment (alors que CLUSTAL…) Analyses non-publiées.")
12
National Center Biotechnology Information (GenBank)
National Institutes of Health National Center Biotechnology Information (GenBank)
")
14
Histoire de GenBank et NCBI
Human EST BLAST (Basic Local Alignment Search Tool) Human Genome GenBank demenage a NIH international computer database of nucleic acid sequence data – Los Alamos Natl Lab, NM (NSF) Wilbur and Lipman Algorithme de recherche de similarites entre sequences 1979
 Human Genome. GenBank demenage a NIH. international computer database of nucleic acid sequence data – Los Alamos Natl Lab, NM (NSF) Wilbur and Lipman. Algorithme de recherche de similarites entre sequences")
15
Programmation d’un outil d’annotation et de Soumission de Séquences Biologiques a GenBank
La publication de nouvelles séquences biologiques nécessite de les rendre publiques Avant, elles etaient publier dans les journaux scientifiques Avec GenBank, elles sont envoyées par au service qui faisait les annotations et leur associait un numéro d’Acces (Accession Number) Besoin d’outil informatique permettant aux biologistes d’annotater leur séquences avant de les envoyer Types de séquences Gene codant (CD) -> simple soumission EST (Expressed Segment T) -> soumission en batch Population de Séquences -> soumission des séquences alignées
 Besoin d’outil informatique permettant aux biologistes d’annotater leur séquences avant de les envoyer. Types de séquences. Gene codant (CD) -> simple soumission. EST (Expressed Segment T) -> soumission en batch. Population de Séquences -> soumission des séquences alignées.")
16
Sequin: Soumission de Sequence aux DB genetiques
1995

17
Editeur d’Annotation de Sequences

18
Editeur d’Annotation de Sequences Alignees
Wheeler DL, Chappey C, Lash AE, Leipe DD, Madden TL, Schuler GD, Tatusova TA, Rapp BA. Database resources of the National Center for Biotechnology Information.Nucleic Acids Res Jan 1;28(1):10-4.
:10-4.")
19
“PopSet” de GenBank

20
CN3D Viewer de Structure de Protéines
Wang Y, Geer LY, Chappey C, Kans JA, Bryant SH. Cn3D: sequence and structure views for entrez. Trends Biochem Sci Jun;25(6):300-2. Marchler-Bauer A, Addess KJ, Chappey C, Geer L, Madej T, Matsuo Y, Wang Y, Bryant SH. MMDB: Entrez's 3D structure database. Nucleic Acids Res. 1999;27(1):240-3.
: Marchler-Bauer A, Addess KJ, Chappey C, Geer L, Madej T, Matsuo Y, Wang Y, Bryant SH. MMDB: Entrez s 3D structure database. Nucleic Acids Res. 1999;27(1):")
22
Bilan des années NIH (+) Acquisition de connaissances dans un institut de renommée internationale Data format: ASN-1 (Abstract Syntax Notation One) Format de répresentation de données ISO permettant l’interoperabilité entre plateformes et représentation de données hétérogenes. Convertie en XML Programmer en C/C++, Web server, Travailler dans le milieu ‘academic’ américain Données et programmes sont disponibles au public (QC) ftp.ncbi.nih.gov (-) Occasion manquée (ou non) l’opportunité de travailler sur le Génome Humain
 ftp.ncbi.nih.gov. (-) Occasion manquée (ou non) l’opportunité de travailler sur le Génome Humain.")
23
1998 NCBI - What’s Next? Phénotype: caractères observables d'un organisme Gene expression profiling: (par Microarray Affymetrix, Stanford) sur RNA, comparaison de l’expression de génes, dans différents types cellulaires (traités non-traités…) SNPs / DeCode… HIV Drug Resistance Database in Stanford Données cliniques: occurrence et évolution de maladies dbGaP: SNPs et maladies genetiques Allele mutants et (partial) resistance a l’infection par le VIH Reponse clinique aux antiviraux et la presence de virus resistance
 sur RNA, comparaison de l’expression de génes, dans différents types cellulaires (traités non-traités…) SNPs / DeCode… HIV Drug Resistance Database in Stanford. Données cliniques: occurrence et évolution de maladies. dbGaP: SNPs et maladies genetiques. Allele mutants et (partial) resistance a l’infection par le VIH. Reponse clinique aux antiviraux et la presence de virus resistance.")
25
ViroLogic Inc Mission: "The right therapy to the right patient at the right time.“ ~10 antiviraux anti-VIH Business Model simple: Laboratoire d’Analyses Hopital + Patient Resistance Report DB Algorithm ~100 employes, 80 dans la laboratoire d’analyse, 20 dans la recherche, l’administration…

26
Test de Résistance du VIH aux antiviraux 2 approches : Phénotype-Génotype
Test de Phenotype teste la capacite’ de chaque antiviraux de diminuer la FONCTION de la protein virale cible de l’antivirale. Translation Polyprotein Test de Genotype determine la sequence de la proteine cible de l’antiviral Un algorithme reconnait les mutations cles qui diminue la function de la proteine Clivage Processing Folding

27
Response Clinique Database de ViroLogic Génotype Phénotype
Small studies (n ~ 100’s) PT-GT database (n > 100,000) Response Clinique Reduction de la charge virale Phénotype IC50 fold change Small studies (n ~ 100’s) clinical cut-off pour le phenotype Identification de mutation associees a la resistance du VIH aux antiviraux
 PT-GT database. (n > 100,000) Response Clinique. Reduction de la. charge virale. Phénotype. IC50 fold change. Small studies. (n ~ 100’s) clinical cut-off pour le phenotype. Identification de mutation associees a la resistance du VIH aux antiviraux.")
28
Calling Bases and Mixtures from Raw Sequence (ABI Chomatogram) Data
codon 184 R(=A/G)TG -> M/V 28
TG -> M/V. 28.")
29
Fréquences des Mutations par Réponse virologic apres 2 semaines
Zolopa, A. R. et. al. Ann Intern Med 1999;131: 29

30
Régles d’interprétation du Genotype
Resistance Collaborative Group (DeGruttola et al., 2000) Initially used in GeneSeq assay, with some modifications Expert Consensus, derived for meta-analysis (not intended for clinical use) UK Drug Resistance Database (2006) Stanford (R. Shafer), HIVResistance.com Comprehensive, updated frequently, good notes International AIDS Society IAS (Hirsch et al., JAMA 2000; 2008 updates) Expert consensus; updated frequently
 Initially used in GeneSeq assay, with some modifications. Expert Consensus, derived for meta-analysis (not intended for clinical use) UK Drug Resistance Database (2006) Stanford (R. Shafer), HIVResistance.com. Comprehensive, updated frequently, good notes. International AIDS Society IAS (Hirsch et al., JAMA 2000; 2008 updates) Expert consensus; updated frequently.")
31
Interprétation du Génotype viral
. | | | | | | | | | Wild-type: PQITLWQRPLVTIKIGGQLKEALLDTGADDTVLEEMNLPGRWKPKMIGGIGGFIKVRQYDQILIEICGHKAIGTVLVGPTPVNIIGRNLLTQIGCTLNF Patient PQIALWQRPLVTIKIGGQLKEALLDTGADNTILEEMNLPGRWKPKMVGGIGGFVKVRQYDQILIEICGHKAIGTVLVGPTPVNIIGRNLLTQIGCTLNF Patient virus genotype D30N T4A I54V V32I I47V D30N Resistance to NPV I47V, I54V Intermediate resistance to fAMP, TPV Regles d’interprétation du Génotype Drug Resistance associated Mutations (RAMs) V82A V32I L90M A71V I47V I84V V82F M46I G48V D30N I50V I54V N88S 31
 V82A. V32I. L90M. A71V. I47V. I84V. V82F. M46I. G48V. D30N. I50V. I54V. N88S. 31.")
32
How are Drug Resistance Mutations Identified?
In vitro selection, clinical studies, site-directed mutagenesis BUT… Drug resistance mutations identified during drug development (esp. in vitro) may not be the most relevant mutations in clinical settings Mutations that are sufficient to cause drug resistance may not be necessary to effect drug resistance Cross-resistance due to mutations selected by related drugs (1) But, another reason that cross-resistance is underestimated has to do with the manner in which drug resistance mutations are traditionally identified. (2) Most clinicians and even many researchers may not be aware that most of our conventional knowledge of drug resistance mutations comes from pre-clinical and early clinical drug studies and often is not drawn from the post-marketing experience with a drug. (3) When a compound with anti-HIV activity is identified. One of the first steps is to culture HIV in the presence of increasing concentrations of the compound, thus selecting for a virus that can replicate in the presence of the drug. (4) This virus is then usually found to have developed mutations in the molecular target of therapy and to have reduced in vitro drug susceptibility. (5) Site-directed mutagenesis is performed next to confirm that the newly developed mutations are indeed responsible for the newly developed drug resistance. The “gold standard” approach, i.e. randomized, prospective clinical trials, identify statistically significant associations, not absolute correlates Useful for testing general principles/interventions Cannot identify all contributing variables There will (almost) always be outliers and exceptions to any rule Rare, unknown mutations Epigenetic phenomena 32
 may not be the most relevant mutations in clinical settings. Mutations that are sufficient to cause drug resistance may not be necessary to effect drug resistance. Cross-resistance due to mutations selected by related drugs. (1) But, another reason that cross-resistance is underestimated has to do with the manner in which drug resistance mutations are traditionally identified. (2) Most clinicians and even many researchers may not be aware that most of our conventional knowledge of drug resistance mutations comes from pre-clinical and early clinical drug studies and often is not drawn from the post-marketing experience with a drug. (3) When a compound with anti-HIV activity is identified. One of the first steps is to culture HIV in the presence of increasing concentrations of the compound, thus selecting for a virus that can replicate in the presence of the drug. (4) This virus is then usually found to have developed mutations in the molecular target of therapy and to have reduced in vitro drug susceptibility. (5) Site-directed mutagenesis is performed next to confirm that the newly developed mutations are indeed responsible for the newly developed drug resistance. The gold standard approach, i.e. randomized, prospective clinical trials, identify statistically significant associations, not absolute correlates. Useful for testing general principles/interventions. Cannot identify all contributing variables. There will (almost) always be outliers and exceptions to any rule. Rare, unknown mutations. Epigenetic phenomena. 32.")
33
Mesure de Résistance Phenotypique
IC50: Concentration of drug required to inhibit viral replication by 50%. Fold Change = _IC50 patient_ IC50 reference Reference: wild-type reference strain NL4-3 % inhibition Log concentration of drug Chappey 02/23/09

34
Analysis Univariée des mutations
To determine which mutations are associated with High or Low TPV IC50 Fold Change Wild-type Mutant, mixed Mutant Fold-change Fisher’s Exact test with the Benjamini correction for multiple tests (for each mutation) -Wilcoxon–Mann–Whitney test For comparison of median FC
 -Wilcoxon–Mann–Whitney test. For comparison of median FC.")
35
Variabilité de la résistance au SQV des virus avec L90M
1639 samples, excludes those with >1 mutation at 30, 48, 50, 82, 84 or mixtures at these positions; 35% are <2.5, 69% are <10 35

36
TPV Susceptibility in Groups of Samples categorized by the TPV Mutation Score
lower clinical cutoff (Total=1411)
")
37
PT-GT Discordances PT-R GT-R PT-R GT-S lower clinical cutoff PT-S GT-R
PT-S GT-S (Total=1411) At a mutation score cutoff of 4 total discordance was 18.1%
 At a mutation score cutoff of 4 total discordance was 18.1%")
38
Performance of the New Tipranavir Mutation Score
Validation Dataset (Total=1845) N: At a mutation score cutoff of 4 total discordance was 16% 38
 N: At a mutation score cutoff of 4 total discordance was 16% 38.")
39
Model Predictive Accuracy Biological Descriptive Meaning
Trade off between Model Complexity, Predictive accuracy and Biological Descriptive Meaning Genotype Rules and Mutation Score Genotype Rules ML Regression Model complexity SVM MLR: Multiple Linear Regression Neural Network Model Predictive Accuracy Increasing SVM: Non-linear Support Vector Machine Biological Descriptive Meaning 39 39

40
De la bulle des Dot-Com … aux Subprimes
March 10, 2000 Embauche licenciement #2 licenciement #1 Grant 2m NIH Grant 400K NIH Grant 400K Introduction en bourse 2009 Chart of NASDAQ closing values from 1994 to 2008

41
Small Business Innovation Research Grants
NIH Grants Title Dates Resume $ SBIR Phase I “HIV Phenotype/Genotype Database Resources” Aug – July 2005 This grant supported the development of a relational database populated with phenotypic and genotypic drug resistance data collected from a large number (>80,000) of HIV-1 patient isolates. Statistical and analytical query tools were developed to derive highly accurate genotypic-phenotypic correlations. “HIV-1 Envelope phenotype/genotype database resources” . May 2004 – Apr. 2006 The goal of the project was to create, populate and exploit an HIV-1 envelope database comprised of high quality data derived from genotypic and phenotypic assays recently developed at Monogram Biosciences to characterize and evaluate entry inhibitors and vaccines Phase II “The Development of a Web-based Data Retrieval System for HIV Therapy Guidance” June 2007 – May 2010 The goal of the project was to implement a web-based database retrieval system to search the Monogram HIV drug resistance database to support clinical management of HIV/AIDS patients and development of novel therapeutics. Ecris des projets de recherche pour obtenir des financements permettant de me payer et d’employer des programmeurs. Certains etaient temporaires, d’autres etaient embauches a temps plein. Agnes Paquet.
 of HIV-1 patient isolates. Statistical and analytical query tools were developed to derive highly accurate genotypic-phenotypic correlations HIV-1 Envelope phenotype/genotype database resources . May 2004 – Apr The goal of the project was to create, populate and exploit an HIV-1 envelope database comprised of high quality data derived from genotypic and phenotypic assays recently developed at Monogram Biosciences to characterize and evaluate entry inhibitors and vaccines. Phase II. The Development of a Web-based Data Retrieval System for HIV Therapy Guidance June 2007 – May The goal of the project was to implement a web-based database retrieval system to search the Monogram HIV drug resistance database to support clinical management of HIV/AIDS patients and development of novel therapeutics Ecris des projets de recherche pour obtenir des financements permettant de me payer et d’employer des programmeurs. Certains etaient temporaires, d’autres etaient embauches a temps plein. Agnes Paquet.")
42
Bilan (+) Organisation du travail dans un societe privee
Respect des délais Coaching des collaborateurs Concrétisation de projets i.e. rédiger des projets aboutissant a un financement, et donc a une réalité (!) Application des connaissances acquises Utilisation de R, Perl … (-) Occasions manquées Insuffisante priorité accordée a ma carriere au sein de la société (a la rue vs. promue)
 Application des connaissances acquises. Utilisation de R, Perl … (-) Occasions manquées. Insuffisante priorité accordée a ma carriere au sein de la société (a la rue vs. promue)")
43
Genentech Roche Senior Biostatistician
Genentech : employes Produits : les anticorps therapeutiques 1976 1987 1998 2000 2001 2003 2004 2006 1993 1996 1997 founded t ablets 2010 Protropin® 1990 Actimmune

44
Histoire de la collaboration entre Genentech et Roche
Page 20 Roche exercises its option to cause Genentech to redeem its outstanding special common shares not owned by Roche. Roche announces its intent to publicly sell up to 19 percent of Genentech shares and continue Genentech as a publicly traded company on the NYSE (symbol: DNA) with independent directors. Roche signs license agreement to sell Genentech’s products in ex-U.S. markets. At the Roche Institute of Molecular Biology a pure interferon alfa is isolated. Roche Nutley and Genentech start work on a joint project to produce a genetically engineered version of the substance. Pour maladies virales -HIV: Saquinavir SQV -HCV: Inhibiteurs de polymerase et de protease en Phase 2 -Grippe: Tamiflu (post-marketing) 1980 1990 1999 2009 Genentech and Roche complete a $2.1 billion merger, and Genentech continues to trade on the NYSE. Roche and Genentech announce that they have signed a merger agreement, and Genentech becomes a wholly owned member of the Roche Group.
 with independent directors. Roche signs license agreement to sell Genentech’s products in ex-U.S. markets. At the Roche Institute of Molecular Biology a pure interferon alfa is isolated. Roche Nutley and Genentech start work on a joint project to produce a genetically engineered version of the substance. Pour maladies virales. -HIV: Saquinavir SQV. -HCV: Inhibiteurs de polymerase et de protease en Phase 2. -Grippe: Tamiflu (post-marketing) Genentech and Roche complete a $2.1 billion merger, and Genentech continues to trade on the NYSE. Roche and Genentech announce that they have signed a merger agreement, and Genentech becomes a wholly owned member of the Roche Group.")
45
Personalized Health Care - Are We there Yet?

46
Mark Lackner What is our role as Statisticians? How/when do we get involved? The Drug/Diagnostic Co-development 46 Early stage research Developmental Research Phase I/II/III Late stage research Drug + •Establish Dx hypothesis Identify Dx marker candidates Preclinical validation Develop clinical Dx Strategy (DxST) Develop in house assays in Ph I • Dx Biomarker validation Develop validated Dx assay with partner Phase III strategy and implementation Risk mitigation plans •Assess need for Dx Initiate selected programs Companion Dx Test This is an idealized development plan for a diagnostic. At every step we need to think about how much we invest in the process and how we will move into evidence based drug development. Research/Research Dx Development Dx/PDB Companion Dx
 Develop in house assays in Ph I. • Dx Biomarker validation. Develop validated Dx assay with partner. Phase III strategy and implementation. Risk mitigation plans. •Assess need for Dx. Initiate selected programs. Companion. Dx. Test. This is an idealized development plan for a diagnostic. At every step we need to think about how much we invest in the process and how we will move into evidence based drug development. Research/Research Dx. Development Dx/PDB. Companion Dx.")
47
Ce qui me reste a faire… Epouser un milliardaire americain
George Soros Warren Buffet Donald Trump Monter une start-up Biotech Et la revendre a Pfizer pour 18 mds d’Euros Ensuite racheter l’UPMC Chirurgie esthetique GIS

48
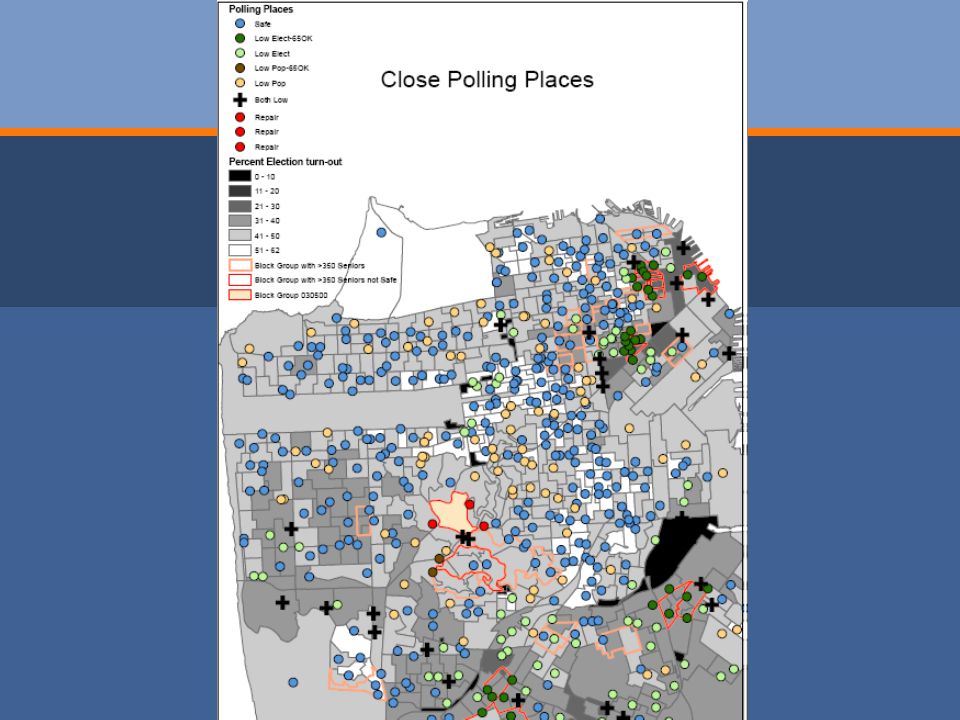
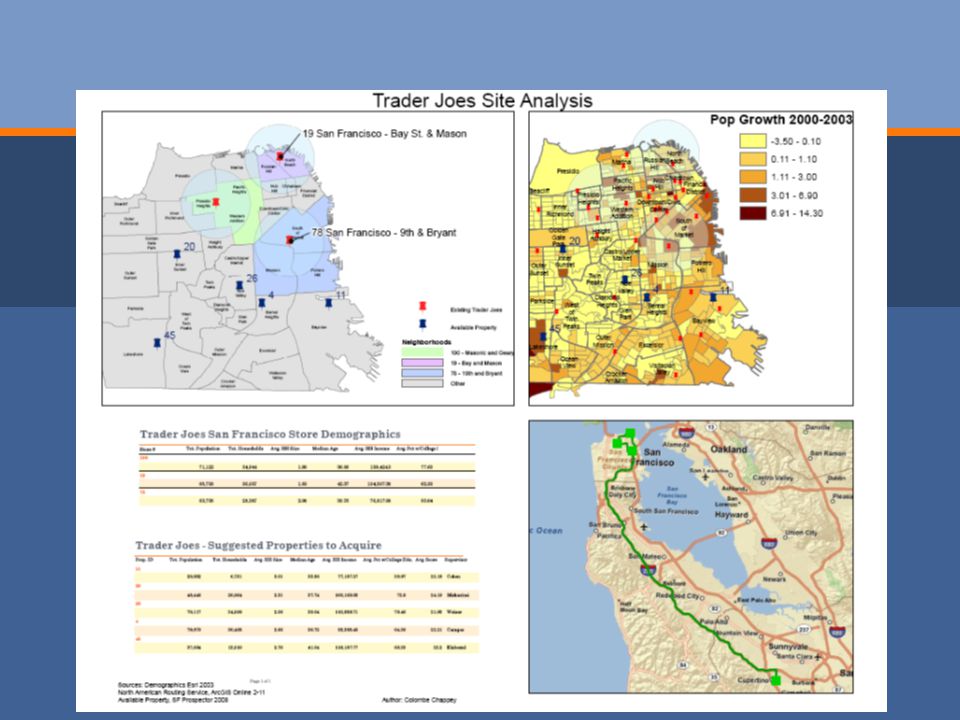
ArcGIS – Epidemie de grippe

51
Back-up Slides

52
The Drug/Diagnostic Co-development
Mark Lackner The Drug/Diagnostic Co-development 52 Early stage research Developmental Research Phase I/II/III Late stage research Drug + •Establish Dx hypothesis Identify Dx marker candidates Preclinical validation Develop clinical Dx Strategy (DxST) Develop in house assays in Ph I • Dx Biomarker validation Develop validated Dx assay with partner Phase III strategy and implementation Risk mitigation plans •Assess need for Dx Initiate selected programs Companion Dx Test This is an idealized development plan for a diagnostic. At every step we need to think about how much we invest in the process and how we will move into evidence based drug development. Research/Research Dx Development Dx/PDB Companion Dx
 Develop in house assays in Ph I. • Dx Biomarker validation. Develop validated Dx assay with partner. Phase III strategy and implementation. Risk mitigation plans. •Assess need for Dx. Initiate selected programs. Companion. Dx. Test. This is an idealized development plan for a diagnostic. At every step we need to think about how much we invest in the process and how we will move into evidence based drug development. Research/Research Dx. Development Dx/PDB. Companion Dx.")
53
Virus susceptibility to antiretroviral drugs allows for the control of the infection
Antiviral drug susceptibility correlates with virologic outcome Baseline phenotypic drug susceptibility was strongly correlated with outcome in both treatment arms. Subjects with baseline virus phenotypically sensitive to 2 or 3 drugs in the salvage regimen experienced significantly greater virus load suppression than those with baseline virus sensitive to 0 or 1 drug (median week-24 change log and log, respectively; P 5 .01). HIV resistance: occurs when HIV changes or mutates so it can escape the effect of an antiretroviral drug -> choosing an ART regimen in light of resistant HIV -> resistance testing Deeks S. JID, 1999;179:1375–81
. HIV resistance: occurs when HIV changes or mutates so it can escape the effect of an antiretroviral drug. -> choosing an ART regimen in light of resistant HIV. -> resistance testing. Deeks S. JID, 1999;179:1375–81.")
54
Agenda Phenotype (PT) and genotype (GT) assays require bioinformatics-based interpretation algorithms to interpret a patient virus as resistant (R) or susceptible (S) to a drug Phenotype assay measure of the ability of a virus to replicate in presence of a drug Cut-offs are used to categorize the PT measure as drug Resistant or Susceptible Genotype assay provides the list of mutations present in a virus pool and differing from the wild-type drug-sensitive virus An algorithm is used to recognize the key mutations associated with resistance from patient-specfic polymorphism
 and genotype (GT) assays require bioinformatics-based interpretation algorithms to interpret a patient virus as resistant (R) or susceptible (S) to a drug. Phenotype assay measure of the ability of a virus to replicate in presence of a drug. Cut-offs are used to categorize the PT measure as drug Resistant or Susceptible. Genotype assay. provides the list of mutations present in a virus pool and differing from the wild-type drug-sensitive virus. An algorithm is used to recognize the key mutations associated with resistance from patient-specfic polymorphism.")
55
Application using RESIST trial for tipranavir TPV
Boehringer Ingelheim Protease Inhibitor Aptivus® (tipranavir) The RESIST trial evaluated Aptivus® (tipranavir) in treatment-experienced HIV-1 infected patients Baseline samples selected were: The study regimen did not include enfuvirtide Where the study PI/r was not a continuation of the prestudy PI/r Endpoint: Viral Load reduction at week 4
 The RESIST trial evaluated Aptivus® (tipranavir) in treatment-experienced HIV-1 infected patients. Baseline samples selected were: The study regimen did not include enfuvirtide. Where the study PI/r was not a continuation of the prestudy PI/r. Endpoint: Viral Load reduction at week 4.")
56
Phenotype Assay: Technical Process
Isolating the viral RNA for Protease and Reverse Transcriptase 2. Constructing the test vector 3. Producing and testing the virus PR Patient-Derived Segment Indicator Gene RT IN LUCIFERASE RESISTANCE TEST VECTOR DNA The Technical Process: Step by Step 1. Isolating the viral RNA Protease (PR) and reverse transcriptase (RT) sequences of the patient's HIV virus are isolated from the patient blood sample and amplified via reverse transcription/polymerase chain reaction (RT-PCR). The process is optimized and validated to capture sequences representing the viral diversity present in the patient sample. 2. Constructing the test vector Patient HIV PR and RT sequences are inserted into the test vector (see figure). Luciferase, a light-emitting reporter gene, is present in the test vector. 3. Producing and testing the virus The test vector is introduced into host cells to produce virus particles that incorporate the PR and RT from the patient's HIV. These virus particles are dependent on the activity of the patient’s virus PR and RT to replicate and are used to infect target cells in the presence and absence of specific antiretroviral drugs. Luciferase glow in the target cells indicates the ability of the virus to grow at increasing levels of drug concentration. The concentration of drug that can inhibit the growth of the virus is a measure of the susceptibility of the virus to the different drugs. 4. Measuring resistance The drug susceptibility of the patient-derived test virus is compared to that of a reference virus that is susceptible to all of the drugs tested. Susceptibility of patient virus is expressed as the fold change and the fold change is compared to cutoff values determined through correlation of drug susceptibility and clinical outcomes data. Petropoulos CJ, ANTIMICROBIAL AGENTS AND CHEMOTHERAPY, Apr. 2000, p. 920–928
 and reverse transcriptase (RT) sequences of the patient s HIV virus are isolated from the patient blood sample and amplified via reverse transcription/polymerase chain reaction (RT-PCR). The process is optimized and validated to capture sequences representing the viral diversity present in the patient sample. 2. Constructing the test vector. Patient HIV PR and RT sequences are inserted into the test vector (see figure). Luciferase, a light-emitting reporter gene, is present in the test vector. 3. Producing and testing the virus. The test vector is introduced into host cells to produce virus particles that incorporate the PR and RT from the patient s HIV. These virus particles are dependent on the activity of the patient’s virus PR and RT to replicate and are used to infect target cells in the presence and absence of specific antiretroviral drugs. Luciferase glow in the target cells indicates the ability of the virus to grow at increasing levels of drug concentration. The concentration of drug that can inhibit the growth of the virus is a measure of the susceptibility of the virus to the different drugs. 4. Measuring resistance. The drug susceptibility of the patient-derived test virus is compared to that of a reference virus that is susceptible to all of the drugs tested. Susceptibility of patient virus is expressed as the fold change and the fold change is compared to cutoff values determined through correlation of drug susceptibility and clinical outcomes data. Petropoulos CJ, ANTIMICROBIAL AGENTS AND CHEMOTHERAPY, Apr. 2000, p. 920–928.")
57
Phenotype Resistance Interpretation
Clinical cut-off -drug level at which a patient’s probability of treatment failure increases. -Based on outcome data from clinical trials. Biological cut-off -based on natural variability of wild-type viruses from treatment-naïve HIV-1 infected patients - 99th percentile of the IC50 FC distribution -Requires a large number of wild-type samples. Assay/technical cut-off -Based on assay variability with repeated testing of patient samples Clinical Relevance Highest Moderate Biological Cut-Off: For any given antiretroviral the biological cut-off is at the 99th percentile for the FC distribution for isolates within the Monogram database which do not have genotypic resistance mutations in protease or reverse transcriptase. For TPV 556 isolates were identified and defined a biologic cutoff at 2.1.

58
HIGHLY CONFIDENTIAL -- NOT FOR DISTRIBUTION

59
Conclusion 1 2 week process that may fail in case of viruses with low replication capacity PT may not capture the resistance in case of minor populations of resistant variants that are selected by the drug pressure Phenotypic Cutoffs caveats Biological cutoffs are assay specific Clinical cutoffs are method dependent References Incremental and Continuous Phenotypic Drug Susceptibility Scores more Accurately Predict Virologic and Immunologic Treatment Outcomes in HIV+ Patients Starting Salvage Therapy: Findings from the Argenta Trial. De Luca et al. Abstract th CROI, Denver Feb Antiretroviral Phenotypic Susceptibility Score as a Predictor of Treatment Response in Persons with Multi-drug-resistant HIV-1 Lawrence et al Abstract th CROI, Denver Feb Phenotypic susceptibility and virological outcome in nucleoside-experienced patients receiving three or four antiretroviral drugs. Katzenstein D et al. AIDS 2006;20:1065-6 Weighted phenotypic susceptibility scores are predictive of the HIV-1 RNA response in protease inhibitor-experienced HIV-1-infected subjects. Swanstrom et al. J Infect Dis. 2004;190:886-93

60
Genotype assay and Rule-based interpretation
PROTEASE (1-99) and REVERSE TRANSCRIPTASE (1-305) Validated for samples with viral loads 500 copies/mL Use of multiple primers : Redundancy of 2 to 5 sequence fragments Detects all mutations and mixtures from co-existing populations of virus (as minor as 10-30%) Patient virus population (quasispecies) Clone ID Virus tropism Peptide sequence E04_101157_c07 R5 CTRPSNNTRKSINM GPGRAFYTTGEIIGDIRQAHC E04_101157_c08 E04_101157_c09 X4 CTRPSNHTRKRVTL GPSRVYYTTGEITGDIRRAHC E04_101157_c13 E04_101157_c19 E04_101157_c21 E04_101157_c23 E04_101157_c25 GPGRAFYTTGEIIGNIRQAHC E04_101157_c26 E04_101157_c30 E04_101157_c34
 and REVERSE TRANSCRIPTASE (1-305) Validated for samples with viral loads 500 copies/mL. Use of multiple primers : Redundancy of 2 to 5 sequence fragments. Detects all mutations and mixtures from co-existing populations of virus (as minor as 10-30%) Patient virus population (quasispecies) Clone ID. Virus. tropism. Peptide sequence. E04_101157_c07. R5. CTRPSNNTRKSINM. GPGRAFYTTGEIIGDIRQAHC. E04_101157_c08. E04_101157_c09. X4. CTRPSNHTRKRVTL. GPSRVYYTTGEITGDIRRAHC. E04_101157_c13. E04_101157_c19. E04_101157_c21. E04_101157_c23. E04_101157_c25. GPGRAFYTTGEIIGNIRQAHC. E04_101157_c26. E04_101157_c30. E04_101157_c34.")
61
HIGHLY CONFIDENTIAL -- NOT FOR DISTRIBUTION

62
HIGHLY CONFIDENTIAL -- NOT FOR DISTRIBUTION

63
HIGHLY CONFIDENTIAL -- NOT FOR DISTRIBUTION

64
HIGHLY CONFIDENTIAL -- NOT FOR DISTRIBUTION

65
HIGHLY CONFIDENTIAL -- NOT FOR DISTRIBUTION

66
HIGHLY CONFIDENTIAL -- NOT FOR DISTRIBUTION

67
Conclusions 2 - Genotype algorithms evolve over time with increased clinical experience and more clinical data on cross-resistance and reverse susceptibility Use of large database combining phenotype and genotype results to generate more accurate genotype interpretive algorithms Minimizing PT-GT Discordance : tradeoff between false negatives (PT-S GT-R) and the false positives (PT-R GT-S) PT-R GT-S New mutations Cross-resistance PT-S GT-R Suppression of resistance or “re-sensitization” Presence of mixtures Use of more complex prediction models yield to more accurate algorithms but with less biological descriptive meaning
 and the false positives (PT-R GT-S) PT-R GT-S. New mutations. Cross-resistance. PT-S GT-R. Suppression of resistance or re-sensitization Presence of mixtures. Use of more complex prediction models yield to more accurate algorithms but with less biological descriptive meaning.")
68
Monogram Technologies for Resistance Testing
Patient virus RT-PCR PR-RT DNA GeneSeq™ PhenoSense™ Vector Assembly PR Patient-Derived Segment Indicator Gene RT IN LUCIFERASE RESISTANCE TEST VECTOR DNA Sequencing Transfection Recombinant Virus Genotyping and phenotyping methodologies both involve amplification of the protease and reverse transcriptase regions of the patient virus. Genotyping analyzes this region for mutations that are known to cause resistance to antiretroviral drugs, while phenotyping involves incorporation of the PR-RT region into a test vector in order to assess the susceptibility of the patient virus to antiretroviral drugs. Genotyping therefore provides a measure of resistance that predicts susceptibility, while phenotyping measures susceptibility directly. In many instances, phenotyping and genotyping provide different results on the same patient sample. This is often referred to as “discordance.” Resistance Mutations Infection Measure of Drug Susceptibility Rules for genotype Interpretation Categorize R if FC > cut-off S if FC < cut-off Pheno-Geno Database Prediction of Drug Susceptibility Categorization of Drug Susceptibility

69
Discussion Interpretation of phenotypic (cutoffs) and genotypic (algorithms) resistance assays is an evolving science Large databases of phenotypic and genotypic information are essential tools to understand and improve discordance rates The use of both types of assay in many cases provides the most complete picture of an individual patient’s virus resistance profile

70
Acknowledgements Increasing Genetic Complexity Phenotypic testing
Genotypic testing Phenotypic testing Utility Treatment rounds All my colleagues at Monogram Biosciences (Clinical Reference Laboratory and Research and Development) And my collaborators (Steve Deeks, UCSF, Andy Zolopa, Stanford, Sebastian Bonhoeffer, Swizerland, R. Shafer ,Stanford..)
 And my collaborators (Steve Deeks, UCSF, Andy Zolopa, Stanford, Sebastian Bonhoeffer, Swizerland, R. Shafer ,Stanford..)")
71
Biological Cut-off: Definition
Biological cut-off: based on natural variability of wild-type viruses from treatment-naïve HIV-1 infected patients (infected by patient who is also drug naïve) When the treatment history is not known, wild-type virus “WT” is defined by the absence of any drug-selected mutation in PR or RT: PR: 23, 24, 30, 32, 33F, 46, 47, 48, 50, 54, 82 (not 82I), 84, 90 RT: 41, 65, 67, 69 (incl. ins.), 70, 74, 75, 100, 101E or P, 103N or S, 106A or M, 151, 181, 184, 190, 210, 215F or Y, 219, 225, 227, 230, 236
 When the treatment history is not known, wild-type virus WT is defined by the absence of any drug-selected mutation in PR or RT: PR: 23, 24, 30, 32, 33F, 46, 47, 48, 50, 54, 82 (not 82I), 84, 90. RT: 41, 65, 67, 69 (incl. ins.), 70, 74, 75, 100, 101E or P, 103N or S, 106A or M, 151, 181, 184, 190, 210, 215F or Y, 219, 225, 227, 230, 236.")
72
Biological Cut-off for TPV
Natural Variation of TPV FC Among “Wild-type” Samples 99th percentile = 2.1 TPV fold change N=2848 , no PI or RTI ‘recognized‘ resistance mutations

73
Genotype Interpretation for Tipranavir (TPV)
TPV susceptibility based on genotype uses an algorithm that counts mutations associated with reduced in vitro susceptibility or in vivo virological response. The “TPV mutation score” was derived from analysis of a limited number of patient samples collected during phase 2 and 3 clinical trials and considers the following mutations: L10V, I13V, K20M, R, or V, L33F, E35G, M36I, K43T, M46L, I47V, I54A, M, or V, Q58E, H69K, T74P, V82L or T, N83D, I84V1. Kohlbrenner et al., HIV DART, 2004

74
Mutations Associated with PT-R GT-S
N mut Odds ratio† P-Value I54A* 16 15.1 A71L 18 8.0 V11L 20 4.0 V82T 65 2.8 I47V 122 <0.0001 G73T 66 2.5 L89V 105 2.3 I84V 356 2.2 V32I 169 2.0 M36L 77 I66 94 1.9 D60E 217 1.6 K55R L90M 787 1.3 M46I 495 L10I 625 1.2 *underlined mutations in existing TPV mutation score † the ratio of % H samples with the mutation to % L samples with the mutation

75
Phenotype-Clinical: Week 4 HIV-1 VL Change vs
Phenotype-Clinical: Week 4 HIV-1 VL Change vs. Baseline IC50 Fold Change to TPV (N= 176) Linear regression was used to quantify the correlation between the baseline TPV fold change (log10 transformed FC) and the absolute HIV RNA reduction (log10 copies (c)/mL) from baseline (start of the study, or day 0) to week 4. 75
 Linear regression was used to quantify the correlation between the baseline TPV fold change (log10 transformed FC) and the absolute HIV RNA reduction (log10 copies (c)/mL) from baseline (start of the study, or day 0) to week")
76
Clinical Cutoffs: Definitions
Lower clinical cutoff: The IC50 fold change at which the HIV RNA response first begins to decline Upper clinical cutoff: The fold change above which a clinically meaningful HIV RNA response (>0.3 log10) is unlikely Probability of response Zone of Intermediate Response Fold Change 76
 is unlikely. Probability of response. Zone of. Intermediate. Response. Fold Change. 76.")
77
Clinical Cutoffs: Methods
Lower clinical cut-off Comparison of HIV RNA responses between two adjacent groups across a moving IC50 FC cut-off (Kruskal-Wallis test) Upper clinical cut-off Phenotypic susceptibility scoring to account for background effect Define the HIV RNA change attributable to the PI/r Define the fold change associated with an HIV RNA reduction of -0.3 log10 copies/mL Chappey 02/23/09 77
 Upper clinical cut-off. Phenotypic susceptibility scoring to account for background effect. Define the HIV RNA change attributable to the PI/r. Define the fold change associated with an HIV RNA reduction of -0.3 log10 copies/mL. Chappey 02/23/")
78
LCCO: First difference from reference Expanding Window method
Lower Clinical Cut-Off (LCCO): The LCCO was defined as the FC at which the HIV RNA response is first observed to decrease. To define the LCCO, we used of a moving window approach and ran successive statistical tests for increasing FC. The method comprised 4 steps: 1) Defining 2 continuous windows, adjacent across a given FC, and encompassing the same number of patients data points, 2) Computing the median HIV RNA reduction within the left and right windows, 3) Testing for the statistical significance of the difference between the responses (Kruskal-Wallis), 4) Moving the CO and expanding the window’s limits. For TPV the analysis started a FC of 1.0 and increased by 0.1. At a FC of 1.0 the windows encompassed 31 data points in the adjacent windows. As the CO increased, the left window expanded encompassing additional data points. The upper limit of the right window was expanded to match the number of data points in the left window. 78
: The LCCO was defined as the FC at which the HIV RNA response is first observed to decrease. To define the LCCO, we used of a moving window approach and ran successive statistical tests for increasing FC. The method comprised 4 steps: 1) Defining 2 continuous windows, adjacent across a given FC, and encompassing the same number of patients data points, 2) Computing the median HIV RNA reduction within the left and right windows, 3) Testing for the statistical significance of the difference between the responses (Kruskal-Wallis), 4) Moving the CO and expanding the window’s limits. For TPV the analysis started a FC of 1.0 and increased by 0.1. At a FC of 1.0 the windows encompassed 31 data points in the adjacent windows. As the CO increased, the left window expanded encompassing additional data points. The upper limit of the right window was expanded to match the number of data points in the left window. 78.")
79
LCCO: First difference from reference Expanding Window method
for a FC cut-off of 2, the green window groups 36 samples with FC below 1.1 and the red window groups 36 samples above 1.1. The difference between median VL change was tested using Kruskal Wallis test. It is not significant. 79

80
LCCO: First difference from reference Expanding Window method
for a FC cut-off of 2, the green window groups 36 samples with FC below 1.1 and the red window groups 36 samples above 1.1. The difference between median VL change was tested using Kruskal Wallis test. It is not significant. 80

81
LCCO: First difference from reference Expanding Window method
81

82
LCCO: First difference from reference Expanding Window method
82

83
LCCO: First difference from reference Expanding Window method
First difference from reference defined at a FC of 1.5 Window sizes N=59, Median HIV RNA reductions: log10c/mL (green window) and log10c/mL, (red window) p = 83
 and log10c/mL, (red window) p =")
84
LCCO: First difference from reference Fixed Window Method
Also, we evaluated a fixed window approach, encompassing a fixed number of data points in the left and the right windows at each FC, this number being determined by the number of samples below the first tested CO, e.g., 31 for TPV. 84

85
LCCO: First difference from reference Fixed Window Method
A different approach consisted in keeping the same number of samples, 31, for the successive tests. For a FC cut-off of 2, the green window groups 31 samples with FC below 1 and the red window groups 31 samples above 1. The difference between median VL change was tested using Kruskal Wallis test. It is not significant. 85

86
LCCO: First difference from reference Fixed Window method
For a FC CO at 1.1, and windows grouping 31 samples below and above the FC, the difference is not significant. 86

87
LCCO: First difference from reference Fixed Window method
87

88
LCCO: First difference from reference Fixed Window method
88

89
LCCO: First difference from reference Fixed Window method
89

90
LCCO: First difference from reference Fixed Window method
The response becomes to decrease significantly for a FC CO of 1.7 First difference from reference defined at a FC of 1.7 Window size N=31 Median HIV RNA reductions: log10c/mL (green window) and log10 c/mL (red window) p=0.003 90
 and log10 c/mL (red window) p=")
91
Comparing LCCO with the Biological Cut-off
Natural Variation of TPV FC Among “Wild-type” Samples In order to minimize misclassification of wildtype isolates as resistant a TPV/r LCO at 2.0 was chosen LCCO = 1.5 The following LCCO were defined (Figures 1a-c): Expanding window method 1.5 (Figure 1B) Fixed window method 1.7 (Figure 1C) TPV biological CO 2.1 We decided to select 1.5 for our LCO because it corresponds to the definition of the LCCO: the lowest FC for which we detect a significant decrease. However, the value of 1.5 is lower than the biological cut-off we estimated for TPV. The biological cut-off for TPV was estimated as the 99th percentile of the distribution of TPV FC for wild-type viruses. The distribution of the TPV FC shows the variation of TPV FC for 2848 distinct variants selected from the Monogram database of resistance data linking phenotype and genotype data. All 2848 samples do not show any of the recognized resistance mutations in PROTEASE and RT. There is a preference not to have a CCO less than the biological CO since this would cause a significant number of WT viruses to be incorrectly classified as TPV resistant. Therefore a lower CO of 2.0 was selected 99th percentile = 2.1 TPV fold change N=2848 , no PI or RTI ‘recognized‘ resistance mutations 91
: Expanding window method 1.5 (Figure 1B) Fixed window method 1.7 (Figure 1C) TPV biological CO 2.1. We decided to select 1.5 for our LCO because it corresponds to the definition of the LCCO: the lowest FC for which we detect a significant decrease. However, the value of 1.5 is lower than the biological cut-off we estimated for TPV. The biological cut-off for TPV was estimated as the 99th percentile of the distribution of TPV FC for wild-type viruses. The distribution of the TPV FC shows the variation of TPV FC for 2848 distinct variants selected from the Monogram database. of resistance data linking phenotype and genotype data. All 2848 samples do not show any of the recognized resistance mutations in PROTEASE and RT. There is a preference not to have a CCO less than the biological CO since this would cause a significant number of WT viruses to be incorrectly classified as TPV resistant. Therefore a lower CO of 2.0 was selected. 99th percentile = TPV fold change. N=2848 , no PI or RTI ‘recognized‘ resistance mutations. 91.")
92
Clinical Cutoffs: Methods
Lower clinical cut-off Comparison of HIV RNA responses between two adjacent groups across a moving IC50 FC cut-off (Kruskal-Wallis test) Upper clinical cut-off Phenotypic susceptibility scoring (PSS) to account for background effect Define the HIV RNA change attributable to the PI/r Define the fold change associated with an HIV RNA reduction of -0.3 log10 copies/mL Chappey 02/23/09 92
 Upper clinical cut-off. Phenotypic susceptibility scoring (PSS) to account for background effect. Define the HIV RNA change attributable to the PI/r. Define the fold change associated with an HIV RNA reduction of -0.3 log10 copies/mL. Chappey 02/23/")
93
Adjust HIV RNA change attributable to TPV/r
UCCO Determination: Calculate the proportion of HIV RNA change attributed to PI/r % HIV RNA reduction attributable to each drug: 2 NRTI 2 NRTI 50% PSS=0 PSS=1 TPV 50% PSS=1 PSS=1 TPV 100% TPV/r TPV/r Adjust HIV RNA change attributable to TPV/r 93

94
Phenotypic Susceptibility Scoring (PSS)
Upper Clinical Cut-Off (UCCO): This was defined as the FC above which the attributable week 4 HIV RNA reduction from baseline was < 0.3 log10c/mL. The contribution of the background therapy in explaining limited HIV RNA response is particularly important for this analysis. To quantify the relative contribution of PI/r and other background therapy, a continuous phenotypic susceptibility score (cPSS) was derived for each of the ‘new’ drugs in the study regimen, where ‘new’ drugs were drugs in the regimen that were not used in the pre-study regimen. The scoring for the individual drugs is derived as part of an ongoing iterative process employing data from previously described PSS studies (1-4). Viruses fully resistant to a given drug were assigned a score of 0 for that drug. A score of 1 was assigned for viruses fully susceptible to a PI/r or NNRTI and of 0.5 for viruses fully susceptible to an NRTI. For viruses with FC’s <0.4, i.e., hypersusceptible, a value of 1.5 (PI/r, NNRTI) or 0.75 (NRTI) was assigned. For viruses with susceptibilities in the intermediate zone the score was assigned on a continuous scale proportionate to the distance of the FC between the upper and lower CO’s. The new regimen cPSS was the sum of the cPSS for each new drug in the new regimen. The attributable HIV RNA change for each drug was determined by the relative contribution to the total PSS. Since the PI UCCO was not know, sequentially higher upper cut-offs were tested and the cPSS and HIV RNA distribution adjusted accordingly. Samples with FC greater than the UCCO tested were censored from the analysis. The upper cut-off chosen was associated with the best fit of HIV RNA change and baseline PI FC by linear regression. Within this adjusted data distribution the PI fold change corresponding to a -0.3 log10c/ml HIV RNA change from baseline was identified and defined the upper cutoff 94
: This was defined as the FC above which the attributable week 4 HIV RNA reduction from baseline was < 0.3 log10c/mL. The contribution of the background therapy in explaining limited HIV RNA response is particularly important for this analysis. To quantify the relative contribution of PI/r and other background therapy, a continuous phenotypic susceptibility score (cPSS) was derived for each of the ‘new’ drugs in the study regimen, where ‘new’ drugs were drugs in the regimen that were not used in the pre-study regimen. The scoring for the individual drugs is derived as part of an ongoing iterative process employing data from previously described PSS studies (1-4). Viruses fully resistant to a given drug were assigned a score of 0 for that drug. A score of 1 was assigned for viruses fully susceptible to a PI/r or NNRTI and of 0.5 for viruses fully susceptible to an NRTI. For viruses with FC’s <0.4, i.e., hypersusceptible, a value of 1.5 (PI/r, NNRTI) or 0.75 (NRTI) was assigned. For viruses with susceptibilities in the intermediate zone the score was assigned on a continuous scale proportionate to the distance of the FC between the upper and lower CO’s. The new regimen cPSS was the sum of the cPSS for each new drug in the new regimen. The attributable HIV RNA change for each drug was determined by the relative contribution to the total PSS. Since the PI UCCO was not know, sequentially higher upper cut-offs were tested and the cPSS and HIV RNA distribution adjusted accordingly. Samples with FC greater than the UCCO tested were censored from the analysis. The upper cut-off chosen was associated with the best fit of HIV RNA change and baseline PI FC by linear regression. Within this adjusted data distribution the PI fold change corresponding to a -0.3 log10c/ml HIV RNA change from baseline was identified and defined the upper cutoff. 94.")
95
Scatter plots of drug susceptibility versus week 4 HIV RNA change
Regimen phenotypic susceptibility score (PSS) versus HIV RNA change (R²=0.19, p<0.0001) TPV FC (log10) versus unadjusted Week 4 HIV-1 RNA (log10) change, N=176, (R²=0.22, p<0.0001) -0.3log10c/mL The Week 4 HIV RNA change was adjusted for regimen activity by calculating the phenotypic susceptibility score (PSS) (Figures 2 and 3a-c). For these PSS calculations the TPV LCCO at 2.0 was used and the FC corresponding to PSS=0 was varied. The LCCO-PSS ‘zero’ pairing with the best fit for the RNA distribution was identified (linear regression) (Figure 3c). Within the final adjusted HIV RNA distribution the FC corresponding to log10 copies/mL HIV RNA change was identified as the UCCO 95
 versus HIV RNA change (R²=0.19, p<0.0001) TPV FC (log10) versus unadjusted Week 4 HIV-1 RNA (log10) change, N=176, (R²=0.22, p<0.0001) -0.3log10c/mL. The Week 4 HIV RNA change was adjusted for regimen activity by calculating the phenotypic susceptibility score (PSS) (Figures 2 and 3a-c). For these PSS calculations the TPV LCCO at 2.0 was used and the FC corresponding to PSS=0 was varied. The LCCO-PSS ‘zero’ pairing with the best fit for the RNA distribution was identified (linear regression) (Figure 3c). Within the final adjusted HIV RNA distribution the FC corresponding to -0.3 log10 copies/mL HIV RNA change was identified as the UCCO. 95.")
96
TPV FC versus Adjusted Week 4 HIV RNA Change
The Week 4 HIV RNA change was adjusted for regimen activity by calculating the phenotypic susceptibility score (PSS) (Figures 2 and 3a-c). For these PSS calculations the TPV LCCO at 2.0 was used and the FC corresponding to PSS=0 was varied. The LCCO-PSS ‘zero’ pairing with the best fit for the RNA distribution was identified (linear regression) (Figure 3c). Within the final adjusted HIV RNA distribution the FC corresponding to log10 copies/mL HIV RNA change was identified as the UCCO 96
 (Figures 2 and 3a-c). For these PSS calculations the TPV LCCO at 2.0 was used and the FC corresponding to PSS=0 was varied. The LCCO-PSS ‘zero’ pairing with the best fit for the RNA distribution was identified (linear regression) (Figure 3c). Within the final adjusted HIV RNA distribution the FC corresponding to -0.3 log10 copies/mL HIV RNA change was identified as the UCCO. 96.")
97
Adjusted Week 4 HIV RNA outcomes by TPV susceptibility category
97

98
What is our role as Statisticians?
How/when do we get involved?

99
What is Our Responsibility
We are strategic partners PHC strategy is part of the Development Plan Embrace the PHC strategy Engage the DST in strategic/prioritization/timelines discussions related to PHC Raise the right issues Plan for resources Work with DST and your manager Network with the Biomarker Experts/Dx sub-teams Be proactive/Stay informed Get Involved! What is the strategic context? Do we have what we need to carry out unbiased assessments Help define risks

100
Mark Lackner What is our role as Statisticians? How/when do we get involved? The Drug/Diagnostic Co-development 100 Early stage research Developmental Research Phase I/II/III Late stage research Drug + •Establish Dx hypothesis Identify Dx marker candidates Preclinical validation Develop clinical Dx Strategy (DxST) Develop in house assays in Ph I • Dx Biomarker validation Develop validated Dx assay with partner Phase III strategy and implementation Risk mitigation plans •Assess need for Dx Initiate selected programs Companion Dx Test This is an idealized development plan for a diagnostic. At every step we need to think about how much we invest in the process and how we will move into evidence based drug development. Research/Research Dx Development Dx/PDB Companion Dx
 Develop in house assays in Ph I. • Dx Biomarker validation. Develop validated Dx assay with partner. Phase III strategy and implementation. Risk mitigation plans. •Assess need for Dx. Initiate selected programs. Companion. Dx. Test. This is an idealized development plan for a diagnostic. At every step we need to think about how much we invest in the process and how we will move into evidence based drug development. Research/Research Dx. Development Dx/PDB. Companion Dx.")
101
PHC strategy Development Strategy
Strong Dx hypothesis No activity in Dx- Some activity in Dx- No strong Dx hypothesis Exploratory Stage Development Strategy Patient selection through all phases of development Complex, larger phase IIs with stratification Complex phase IIIs No selection or stratification Possible data mining trap Prospectively defined diagnostic markers are required for any label enabling action. Diagnostic markers should be defined prior to pivotal trials and hence planned for in a CDP Retrospective analyses are generally considered “hypothesis” generating. Diagnostic marker evaluation - phase II Diagnostic marker validation – phase III

102
Impact on components of CDP
Target product profile Parallel development of companion diagnostic Phase I trials Selection for quick signal seeking Phase II trials Complex issues become more complex More unknowns, more questions to answer Phase III trials Clinical Validation of Dx Design depends on Phase II outcome Selection, stratification or all-comers

103
Phase II Considerations
Objective: simultaneous Rx/Dx evaluation Scientific rationale and pre-clinical data - main determinants of the scenario prior to Phase II Statistical considerations Co-primary endpoints Value added and feasibility of stratification Defining cut-offs for continuous biomarker Go/No Go decision algorithm Dedicated studies to investigate assay or biomarker properties Reproducibility, prevalence, prognostic value

104
Phase III Considerations
Study Objective Assess/determine risk/benefit Clinical Validation of Dx Implementation issues Analytically validate Dx assay before applying it to specimens in pivotal trials Accruing / prospective stratification based on non-final assay – can result in discordance Analysis method Test two hypothesis, All comers Dx positive subgroup Appropriately control for type I error Clearly define your decision tree – there are no “freebies”

105
End of Phase III Decision Criteria
Phase III outcome Not statistically significant in all comers Statistically significant in all comers Statistically significant in Dx+ group SELECTION CLAIM All comers claim if no diff. b/w Dx- & Dx+ groups Greater benefit claim if clinically meaningful diff. b/w Dx- & Dx+ Selection Claim if no improvement in Dx- group

106
Old Drugs – New Tests Exploratory Analysis
Biomarker not known at the time of study initiation Data not analyzed with that biomarker as part of the hypothesis New scientific advancements/new technologies Biomarker discovery – generation of new hypotheses Prospective-Retrospective Study Exploratory Analysis

107
Prospective/Retrospective Study
Completed or post-interim-analysis trial Patient samples collected prior to treatment initiation Clinical outcomes data unblinded and analyzed without the biomarker data Diagnostic hypothesis/analysis plan - prospectively specified Analysis is retrospective

108
Components of good biomarker analysis plan
Role of randomization - fairness of comparison Marker availability – impact of convenience samples Bias due to missing data Marker performance Marker performance and prevalence may explain study to study heterogeneity Statistical control of false positive conclusions – How many hypothesis How many outcomes Model selection Over-fitting can lead to bias Validation methods Data to generate the hypothesis vs. data to confirm the hypothesis

109
Summary Companion diagnostics are at the heart of personalized health care Predictive claims rely on understanding the effect of the drug in biomarker positive and negative patients Optimal approach: Adequate and well-controlled trials, prospectively designed to assess risk/benefit in biomarker subgroups Late emergence of critical biomarkers for existing drugs - revision of drug’s use As strategic partners, we need to be involved in all stages of the co-development process 4th bullet: During development phase plan for the future: optimal specimen collection/preservation/storage

Similar presentations


 Resistance-Associated Variant (RAV) Loci in Genotype 1a and 1b Patients:>")


>")


 and the UK HIV Drug Resistance Database.>")


