Download presentation
Presentation is loading. Please wait.

1
Developing a Child Cohort Research Strategy for Europe http://www.chicosproject.eu Is it the healthiest women who drink alcohol during pregnancy? A CHICOS case study on light drinking in relation to birth weight and preterm delivery Katrine Strandberg-Larsen – March 2012

2
Are there beneficial effects of light drinking? Light drinking is < 1 drink/day A J-shaped curve has been observed for: –Birth weight / SGA / IUGR –Preterm birth –Still birth –Behavioural problems –Cognitive problems

3
A healthy drinker effect B EHAVIOR MODIFICATION BIAS Widespread consensus that alcohol is harmful during pregnancy Women with a troublesome pregnancy experience will avoid drinking alcohol Women with a high a-priori risk of reproductive failure will be over-represented among non- drinkers C ONFOUNDING Light drinkers are more likely than abstainers to be: From high income households Better educated Older Multiparous (Non-smokers)
")
4
Experience in the DNBC AJE 2004;159:155-161

5
Experience in the DNBC AJE 2004;159:155-161

6
Aim To examine whether the observed beneficial effects of light drinking are attributable to behaviour modification bias or confounding

7
How to examine this? Examine light drinking during pregnancy in relation to birth weight and preterm delivery –Restrict to women unaware of their reproductive abilities –Examine the paternal alcohol consumption in relation to low birth weight and preterm delivery and compare the maternal and partner associations

8
Reasons to do a CHICOS case study? Restriction to pregnancies in which the women have no reproductive experience is a conservative approach and huge samples are needed to get a sufficient number Few of the existing cohorts have data on paternal alcohol consumption

9
Identification of cohorts A list of European birth cohorts were made –A preliminary list of European cohorts (WP 1- June 2011) –Cohorts listed at: www.chicosproject.eu/cohort/ www.enrieco.org www.birthcohorts.net
 –Cohorts listed at:")
10
Criteria of inclusion Enrolment during pregnancy Enrolment to the cohort was ended or ongoing Enrolled at birth or later n=26 No information on time of enrolment n=3 Enrolled at birth or later n=26 No information on time of enrolment n=3 Enrollment not initiated n=2

11
Mandatory variables Average weekly alcohol consumption Birth weight Gestational age Gravidity Time to pregnancy

12
Was this information available? Cohort inventories www.enrieco.org www.birthcohorts.net Official web page of cohorts Key references

13
No data on mandatory variables No data on alcohol n=2 Not able to identify data on alcohol n=3 No data on alcohol n=2 Not able to identify data on alcohol n=3 Not able to identify data on gravidity n= 8 No data on time to pregnancy n=2 Not able to identify data on time to pregnancy n=5 Not able to identify data on gravidity n= 8 No data on time to pregnancy n=2 Not able to identify data on time to pregnancy n=5

14
Included cohorts No response n=4 Refused to participate because lack of payment for data n=1 No response n=4 Refused to participate because lack of payment for data n=1 Incompatible data on alcohol n=1 Ask for consumption in a specific week No information on time to pregnancy n=1 Incompatible data on alcohol n=1 Ask for consumption in a specific week No information on time to pregnancy n=1

15
The included cohorts CohortCountryYear of enrolment Aarhus Birth CohortDenmark1989- DNBCDenmark1996-2002 Generation RNetherlands2002-2006 HHf2Denmark1984-1987 INMASpain1997,1998, 2004-2008 NINFEAItaly2005+ MoBaNorway1999-2008 PÉLAGIEFrance2002-2005

16
Covering of Europe

17
Collaborators Cohort Aarhus Birth CohortTine Brink HenriksenMorten S. Jensen DNBCKatrine Strandberg-LarsenAnne-Marie Nybo Andersen Generation RVincent Jaddoe HHf2Bodil Hammer BechEllen Aagaard Nøhr INMAMartine Vrijheid MoBaPer MagnusAne Lunde NINFEALorenzo RichardiFranco Merletti PÉLAGIESylviane CordierFlorence Rouget

18
PRESENTATION OF COLLABORATORS

19
HOW CAN WE HARMONIZE DATA? Lets start the work:

20
Size of cohorts CohortNumber of live born singletons % enrolled before 36 completed weeks Aarhus Birth Cohort 64,246 99.6 DNBC 87,184 100 Generation R 9,355 99.9 HHf2 11,088 44.5 INMA 3,564 100 MoBa 99,887 99.8 NINFEA 2,791 87.2 PÉLAGIE 3,319 100

21
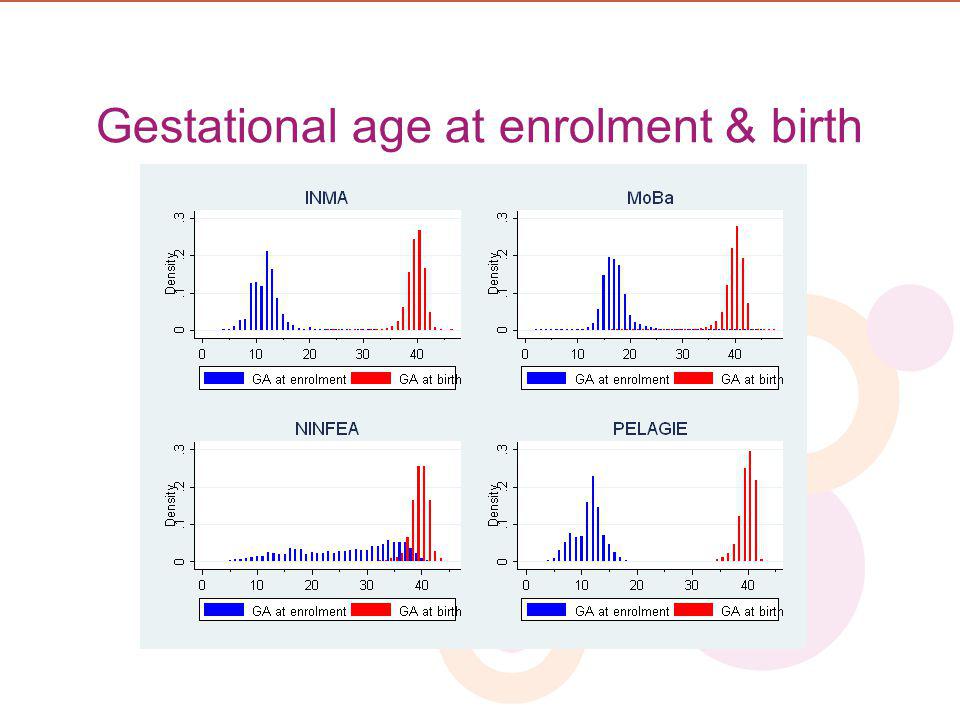
Gestational age at enrolment & birth

23
What we know about gestational age? CohortStatus of cleaningEstimation Aarhus Birth Cohort Yes verified in hospital charts Register based DNBC Yes Register based Generation R Yes US HHf2? INMA Yes US or LMP MoBa? NINFEA No (extreems coded as.) US or LMP PÉLAGIE Yes Clinical assesment at delivery, LMP & US
 US or LMP PÉLAGIE Yes Clinical assesment at delivery, LMP & US.")
24
Gestational age at delivery CohortMeanSDRange Aarhus Birth Cohort 39.51.7623-45 DNBC 39.61.8022-45 Generation R 39.41.8424-43 HHf2 39.81.4727-45 INMA 39.11.6423-44 MoBa 39.51.8222-47 NINFEA 39.81.7223-45 PÉLAGIE 39.41.5525-42

25
Birth weight CohortMeanSDRange Aarhus Birth Cohort 3541.2553.2520-6050 DNBC 3585.1565.4510-8700 Generation R 3409.1563.3635-5610 HHf2 3469.5505.5700-5750 INMA 3253.9476.6565-4880 MoBa 3601.1558.8500-6300 NINFEA 3291.4544.1560-5400 PÉLAGIE 3391.8492.9510-5580

26
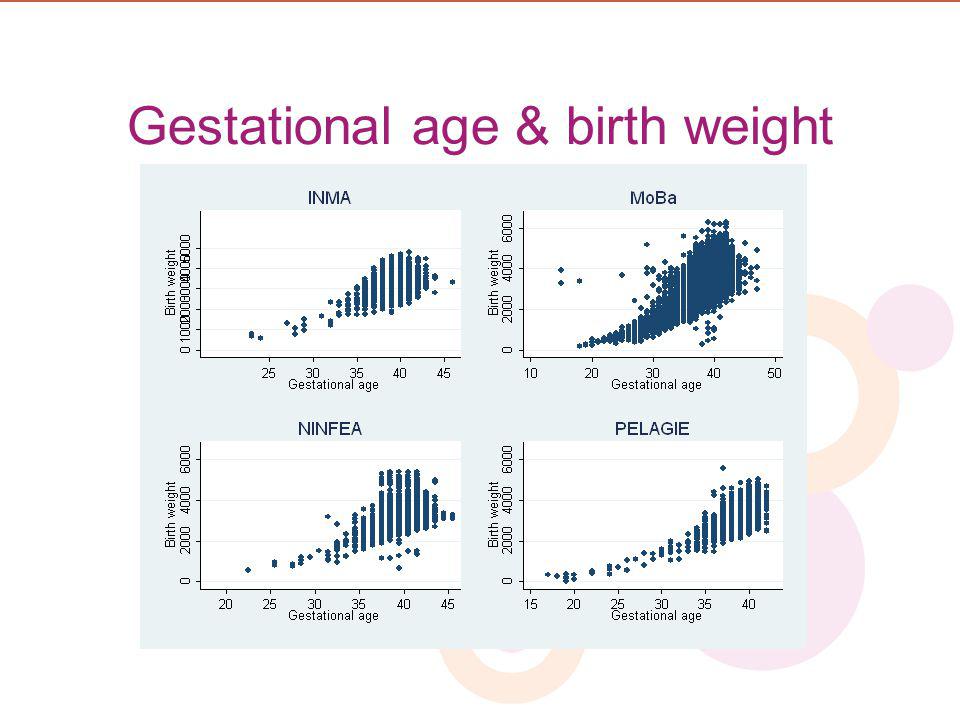
Gestational age & birth weight

28
SHOULD WE DO ANYTHING ABOUT IMPLAUSIBLE BW-GA COMBINATIONS? Your opinions on:

29
We have considered… Alexander GR. Obstet & Gynecol 1996

30
Low birth weight Cohort<2500gSGALGA Aarhus Birth Cohort 2015 (3.1%)5951 (9.3%)9975 (15.5%) DNBC 2,644 (3.0%)6,731 (7.7%) 14,446 (16.6%) Generation R 456 (4.9%)1264 (13.5%)916 (9.8%) HHf2 306 (2.8%)1605 (14.5%)1162 (10.5%) INMA 182 (5.1%)625 (17.5%)206 (5.8%) MoBa* 2839 (2.8%)-- NINFEA 125 (4.5%)626 (22.4%)157 (5.6%) PÉLAGIE 108 (3.3%)386 (11.6%)235 (7.1%) * Have received no data on sex of child
5951 (9.3%)9975 (15.5%) DNBC 2,644 (3.0%)6,731 (7.7%) 14,446 (16.6%) Generation R 456 (4.9%)1264 (13.5%)916 (9.8%) HHf2 306 (2.8%)1605 (14.5%)1162 (10.5%) INMA 182 (5.1%)625 (17.5%)206 (5.8%) MoBa* 2839 (2.8%)-- NINFEA 125 (4.5%)626 (22.4%)157 (5.6%) PÉLAGIE 108 (3.3%)386 (11.6%)235 (7.1%) * Have received no data on sex of child")
31
Use an external reference PROS Ultrasound estimated standards better reflect intrauterine growth For preterms and postterms, the birth weight standards are based on abnormal pregnancies No need for extrapolations CONS Difficult to find references that is suitable for each cohort

32
HOW SHOULD WE DEFINE SGA? Your opinions on:

33
Data on reproductive experience CohortFirst preg.TTP 6 month Combination Aarhus Birth Cohort 24,564 (38.2%)41,869 (65.2%)15,075 (23.5%) DNBC 28,279 (34.5%)60,250 (73.6%)19,632 (24.0%) Generation R 3,944 (43.1%)3,736 (75.2%)1,640 (33.6%) HHf2 3,811 (34.4%)7,431 (68.8%)2,665 (24.7%) INMA * 1,125 (45.6%)-- MoBa 40,980 (43.0%)62,238 (79.7%)24,019 (32.2%) NINFEA 2,142 (76.6%)1,510 (56.1%)632 (23.5%) PÉLAGIE 1,472 (44.5%)2,130 (73.3%)750 (25.8%) * Have received no data on TTP. Note not all cohorts categorized at <6 months, e.g. in HHf2 TTP was categorized in 0-6 months

34
WHAT TO DO ABOUT THE CATEGORIZATION OF TTP? Your opinions on:

35
Troublesome alcohol data Almost every cohort used different questions Some asked for types others overall consumption Different response categories is used Most asked for weekly consumption, others for days or the last three months One cohort ask for frequency and amount Data collected for different periods of pregnancy

36
Structure of the available alcohol data

37
Maternal consumption during CohortNumbers with alcohol data Never drinkers <1/week1/week Aarhus Birth Cohort 60,71579%21% DNBC 82,020 55% 16% 29% Generation R 7,333 57%25% 18% HHf2 11,076 18%17% 64% INMA * 3,422 84%14% 2% MoBa 90,051 88%11% 1% NINFEA 2,758 65%19% 16% PÉLAGIE 3,277 85% 8% 7% Total 260,688

38
We want to… Use the earliest collected data on alcohol Construct a continuous variable for average weekly alcohol consumption within each cohort Use data from the cohorts with alcohol consumption measured in drinks to estimate distributions within fixed response categories Use multiple imputation to impute continuous average weekly intake

39
OTHER SUGGESTIONS TO HOW WE CAN HARMONIZE THE ALCOHOL DATA? Your opinions on:

40
Maternal consumption before CohortNumbers with alcohol data Aarhus Birth Cohort 25,458 DNBC 81,744 Generation R 7,268 HHf2 11,075 MoBa 93,720 Total 219,265

41
Paternal consumption during CohortNumbers with alcohol data Aarhus Birth Cohort 29,480 HHf2 10,877 INMA * 2,930 MoBa 70,932 Total 114,219

42
Plan of analysis BIRTH WEIGHT Logistic regression with LBW & SGA as outcome variables Linear regression with differences in mean birth weight as outcome GA will be included in the analysis of LBW & differences in mean birth weight PRETERM DELIVERY Cox regression with GA as underlying time variable Entry is GA at enrolment (or if different answering the alcohol questions) Exit is GA at delivery, emigration or 36 week + 6 days of gestation
 Exit is GA at delivery, emigration or 36 week + 6 days of gestation")
43
We plan to adjust for Maternal education/SES Maternal age Marital status/cohabitation (single parenting) Pre-pregnancy BMI Smoking Cohort Parity in analysis that is not restricted to first- time pregnancies with TTP < 6 months
 Pre-pregnancy BMI Smoking Cohort Parity in analysis that is not restricted to first- time pregnancies with TTP < 6 months")
44
Availability of data on adjustment variables

45
THE PLAN OF ANALYSIS Your inputs to:

46
Developing a Child Cohort Research Strategy for Europe http://www.chicosproject.eu Thank you for all your useful comments

Similar presentations


 2008 Update Kate Cox.>")
 Kate Cox.>")
>")
 2009 Update Natasha Wood.>")

