Download presentation
Presentation is loading. Please wait.

1
1 CHAPTER To view a full-screen figure during a class, click the red “expand” button. To return to the previous slide, click the red “shrink” button. To advance to the next slide, click anywhere on the full screen figure.

3
A Housing Market with a Rent Ceiling
A price ceiling or price cap is a regulation that makes it illegal to charge a price higher than a specified level. When a price ceiling is applied to a housing market it is called a rent ceiling. If the rent ceiling is set above the equilibrium rent, it has no effect. But if the rent ceiling is set below the equilibrium rent, it has powerful effects.

4
A Housing Market with a Rent Ceiling
Housing Shortage Figure 6.1 shows the effects of a rent ceiling that is set below the equilibrium rent. The equilibrium rent is $1,000 a month. A rent ceiling is set at $800 a month. So the equilibrium rent is in the illegal region.

6
A Housing Market with a Rent Ceiling
At the rent ceiling, the quantity of housing demanded exceeds the quantity supplied. There is a shortage of housing. Explain that because landlords can’t be forced to supply a greater quantity than they wish, the quantity of housing supplied at the rent ceiling is less than the quantity that would be supplied in an unregulated market.

7
A Housing Market with a Rent Ceiling
Because the legal price cannot eliminate the shortage, other mechanisms operate: Search activity Black markets With a housing shortage, people are willing to pay up to $1,200 a month.

8
A Housing Market with a Rent Ceiling
Search Activity The time spent looking for someone with whom to do business is called search activity. When a price is regulated and there is a shortage, search activity increases. Search activity is costly and the opportunity cost of housing equals its rent (regulated) plus the opportunity cost of the search activity (unregulated). Because the quantity of housing is less than the quantity in an unregulated market, the opportunity cost of housing exceeds the unregulated rent.
 plus the opportunity cost of the search activity (unregulated). Because the quantity of housing is less than the quantity in an unregulated market, the opportunity cost of housing exceeds the unregulated rent.")
9
A Housing Market with a Rent Ceiling
Black Markets A black market is an illegal market that operates alongside a legal market in which a price ceiling or other restriction has been imposed. A shortage of housing creates a black market in housing. Illegal arrangements are made between renters and landlords at rents above the rent ceiling—and generally above what the rent would have been in an unregulated market.

10
A Housing Market with a Rent Ceiling
Inefficiency of Rent Ceilings A rent ceiling set below the equilibrium rent leads to an inefficient underproduction of housing services. Figure 6.2 illustrates this inefficiency.

11
A Housing Market with a Rent Ceiling
A rent ceiling decreases the quantity of housing supplied to less than the efficient quantity. A deadweight loss arises. Producer surplus shrinks. Consumer surplus shrinks. There is a potential loss from increased search activity.

13
A Housing Market with a Rent Ceiling
Are Rent Ceilings Fair? According to the fair rules view, a rent ceiling is unfair because it blocks voluntary exchange. According to the fair results view, a rent ceiling is unfair because it does not generally benefit the poor. A rent ceiling decreases the quantity of housing and the scarce housing is allocated by Lottery First-come, first-served Discrimination

14
A Housing Market with a Rent Ceiling
A lottery gives scarce housing to the lucky. A first-come, first served gives scarce housing to those who have the greatest foresight and get their names on the list first. Discrimination gives scarce housing to friends, family members, or those of the selected race or sex. None of these methods leads to a fair outcome.

15
A Labor Market with a Minimum Wage
A price floor is a regulation that makes it illegal to trade at a price lower than a specified level. When a price floor is applied to labor markets, it is called a minimum wage. If the minimum wage is set below the equilibrium wage rate, it has no effect. If the minimum wage is set above the equilibrium wage rate, it has powerful effects.

16
A Labor Market with a Minimum Wage
If the minimum wage is set above the equilibrium wage rate, the quantity of labor supplied by workers exceeds the quantity demanded by employers. There is a surplus of labor. The quantity of labor hired at the minimum wage is less than the quantity that would be hired in an unregulated labor market. Because the legal wage rate cannot eliminate the surplus, the minimum wage creates unemployment. Figure 6.3 on the next slide illustrates these effects.

17
A Labor Market with a Minimum Wage
The equilibrium wage rate is $6 an hour. The minimum wage rate is set at $7 an hour. So the equilibrium wage rate is in the illegal region. The quantity of labor employed is the quantity demanded.

19
A Labor Market with a Minimum Wage
Minimum Wage Brings Unemployment The quantity of labor supplied exceeds the quantity demanded and unemployment is created. With only 20 million hours demanded, some workers are willing to supply the last hour demanded for $8.

20
A Labor Market with a Minimum Wage
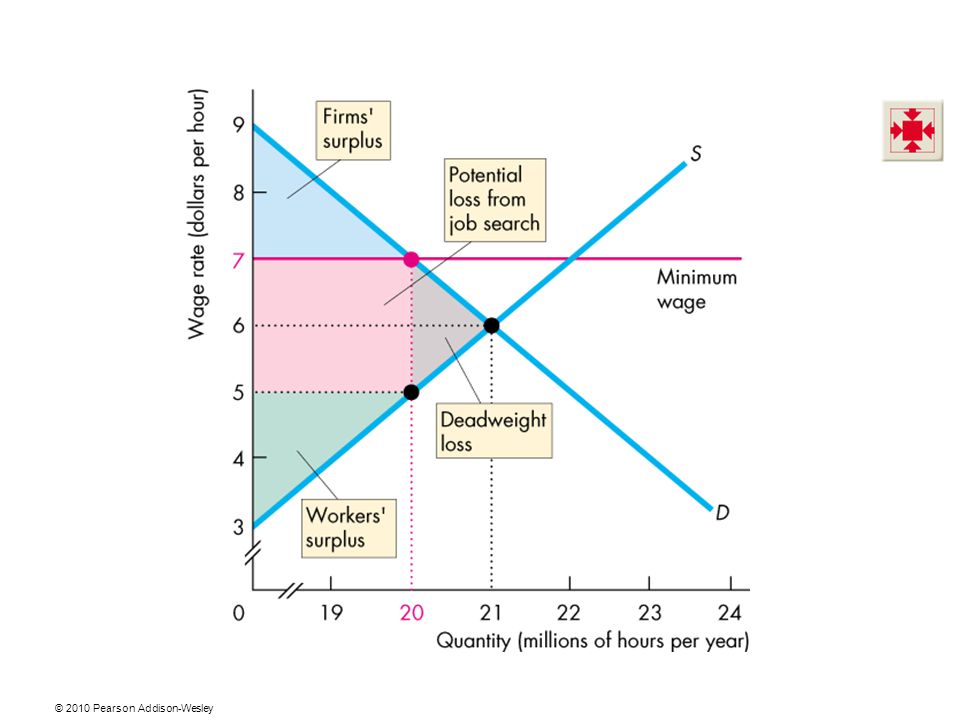
Inefficiency of a Minimum Wage A minimum wage leads to an inefficient outcome. The quantity of labor employed is less than the efficient quantity. The supply of labor measures the marginal social cost of labor to workers (leisure forgone). The demand for labor measures the marginal social benefit from labor (value of goods produced). Figure 6.4 illustrates this inefficient outcome.
. The demand for labor measures the marginal social benefit from labor (value of goods produced). Figure 6.4 illustrates this inefficient outcome.")
21
A Labor Market with a Minimum Wage
A minimum wage set above the equilibrium wage decreases the quantity of labor employed. A deadweight loss arises. The potential loss from increased job search decreases both workers’ surplus and firms’ surplus. The full loss is the sum of the red and gray areas.

23
Taxes Tax Incidence Tax incidence is the division of the burden of a tax between buyers and sellers. When an item is taxed, its price might rise by the full amount of the tax, by a lesser amount, or not at all. If the price rises by the full amount of the tax, buyers pay the tax. If the price rise by a lesser amount than the tax, buyers and sellers share the burden of the tax. If the price doesn’t rise at all, sellers pay the tax.

24
Taxes A Tax on Sellers Figure 6.5 shows the effects of this tax.
With no tax, the equilibrium price is $3.00 a pack. A tax on sellers of $1.50 a pack is introduced. Supply decreases and the curve S + tax on sellers shows the new supply curve.

26
Taxes The market price paid by buyers rises to $4.00 a pack and the quantity bought decreases. The price received by the sellers falls to $2.50 a pack. So with the tax of $1.50 a pack, buyers pay $1.00 a pack more and sellers receive 50¢ a pack less.

27
Taxes A Tax on Buyers Again, with no tax, the equilibrium price is $3.00 a pack. A tax on buyers of $1.50 a pack is introduced. Demand decreases and the curve D tax on buyers shows the new demand curve.

29
Taxes The price received by sellers falls to $2.50 a pack and the quantity decreases. The price paid by buyers rises to $4.00 a pack. So with the tax of $1.50 a pack, buyers pay $1.00 a pack more and sellers receive 50¢ a pack less.

30
Taxes So, exactly as before when sellers were taxed:
Buyers pay $1.00 of the tax. Sellers pay the other 50¢ of the tax. Tax incidence is the same regardless of whether the law says sellers pay or buyers pay.

31
Taxes Tax Division and Elasticity of Demand
The division of the tax between buyers and sellers depends on the elasticities of demand and supply. To see how, we look at two extreme cases. Perfectly inelastic demand: Buyer pay the entire tax. Perfectly elastic demand: Sellers pay the entire tax. The more inelastic the demand, the larger is the buyers’ share of the tax.

32
Taxes Demand for this good is perfectly inelastic—the demand curve is vertical. When a tax is imposed on this good, buyers pay the entire tax.

34
Taxes The demand for this good is perfectly elastic—the demand curve is horizontal. When a tax is imposed on this good, sellers pay the entire tax.

36
Taxes Tax Division and Elasticity of Supply
To see the effect of the elasticity of supply on the division of the tax payment, we again look at two extreme cases. Perfectly inelastic supply: Sellers pay the entire tax. Perfectly elastic supply: Buyers pay the entire tax. The more elastic the supply, the larger is the buyers’ share of the tax.

37
Taxes The supply of this good is perfectly inelastic—the supply curve is vertical. When a tax is imposed on this good, sellers pay the entire tax.

39
Taxes The supply of this good is perfectly elastic—the supply curve is horizontal. When a tax is imposed on this good, buyers pay the entire tax.

41
Taxes Taxes in Practice
Taxes usually are levied on goods and services with an inelastic demand or an inelastic supply. Alcohol, tobacco, and gasoline have inelastic demand, so the buyers of these items pay most the tax on them. Labor has a low elasticity of supply, so the seller—the worker—pays most of the income tax and most of the Social Security tax. Taxes and the inelasticity of “sinful” acts. If students understand the basics of taxes, they will become more informed citizen voters. Raise a number of provocative issues related to taxation to evoke student interest in understanding why some goods are taxed and others are not. Taxing the consumer surplus of smokers—“Once, Twice Three times a levy.” Provoke the students’ interest in tax policy by showing them how cigarette smokers are “taxed” at least three times for their habit: Many believe that smoking is considered to be one of the most addictive, legally available products in the market without a doctor’s prescription. The government recognizes demand for cigarettes is highly inelastic and places a hefty sales tax on each pack of cigarettes. Strike one. Many governments have sued the major tobacco companies for compensation for past and future health care costs arising from the smoking-related illnesses of its citizens. Tobacco companies have recently settled these suits by paying hundreds of billions of dollars in penalties. Students should see that inelastic demand for cigarettes allows tobacco producers to pass on most of these costs to the smoker. (This could explain why the settlement has done little in the long run to depress the stock prices and dividends from these major tobacco companies, relative to the whole market.) Strike two. Due to the increased health risk of smoking, the average smoker dies at a much earlier age than the average non-smoker. This means that smokers can expect to receive little, if any, return on all the social security taxes they’ve been paying in throughout their lives. (That is, assuming any of us will get anything back for our social security taxes!) Strike three!
 Strike two. Due to the increased health risk of smoking, the average smoker dies at a much earlier age than the average non-smoker. This means that smokers can expect to receive little, if any, return on all the social security taxes they’ve been paying in throughout their lives. (That is, assuming any of us will get anything back for our social security taxes!) Strike three!")
42
Taxes Taxes and Efficiency
Except in the extreme cases of perfectly inelastic demand or perfectly inelastic supply when the quantity remains the same, imposing a tax creates inefficiency. Figure 6.10 shows the inefficiency created by a $20 tax on MP3 players.

43
Taxes With no tax, marginal social benefit equals marginal social cost and the market is efficient. Total surplus (the sum of consumer surplus and producer surplus) is maximized. The tax decreases the quantity, raises the buyers’ price, and lowers the sellers’ price.
 is maximized. The tax decreases the quantity, raises the buyers’ price, and lowers the sellers’ price.")
45
Taxes Marginal social benefit exceeds marginal social cost and the tax is inefficient. The tax revenue takes part of the total surplus. The decreased quantity creates a deadweight loss.

46
Taxes Taxes and Fairness
Economists propose two conflicting principles of fairness to apply to a tax system: The benefits principle The ability-to-pay principle

47
Production Subsidies and Quotas
Intervention in markets for farm products takes two main forms: Production quotas Subsidies A production quota is an upper limit to the quantity of a good that may be produced during a specified period. A subsidy is a payment made by the government to a producer.

48
Production Subsidies and Quotas
Production Quotas With no quota, the price is $30 a ton and 60 million tons a year are produced. With the production quota of 40 million tons a year, quantity decreases to 40 million tons a year. The market price rises to $50 a ton and marginal cost falls to $20 a ton.

50
Production Subsidies and Quotas
With no subsidy, the price is $40 a ton and 40 million tons a year are produced. With a subsidy of $20 a ton, marginal cost minus subsidy falls by $20 a ton and the new supply curve is S – subsidy.

52
Production Subsidies and Quotas
The market price falls to $30 a ton and farmers increase the quantity to 60 million tons a year. But farmers’ marginal cost increases to $50 a ton. With the subsidy, farmers receive more on each ton sold—the price of $30 a ton plus the subsidy of $20 a ton, which is $50 a ton.

53
Markets for Illegal Goods
The U.S. government prohibits trade of some goods, such as illegal drugs. Yet, markets exist for illegal goods and services. How does the market for an illegal good work? To see how the market for an illegal good works, we begin by looking at a free market and see the changes that occur when the good is made illegal. Students are always interested in this analysis. The major thing to achieve is an awareness that declaring an activity to be illegal must be backed up with incentives—penalties. And taxes can work as an alternative incentive to achieve an identical outcome in terms of price and quantity. This analysis is another good place to emphasize that the opportunity cost of something is the market price plus any other costs of buying.

54
Markets for Illegal Goods
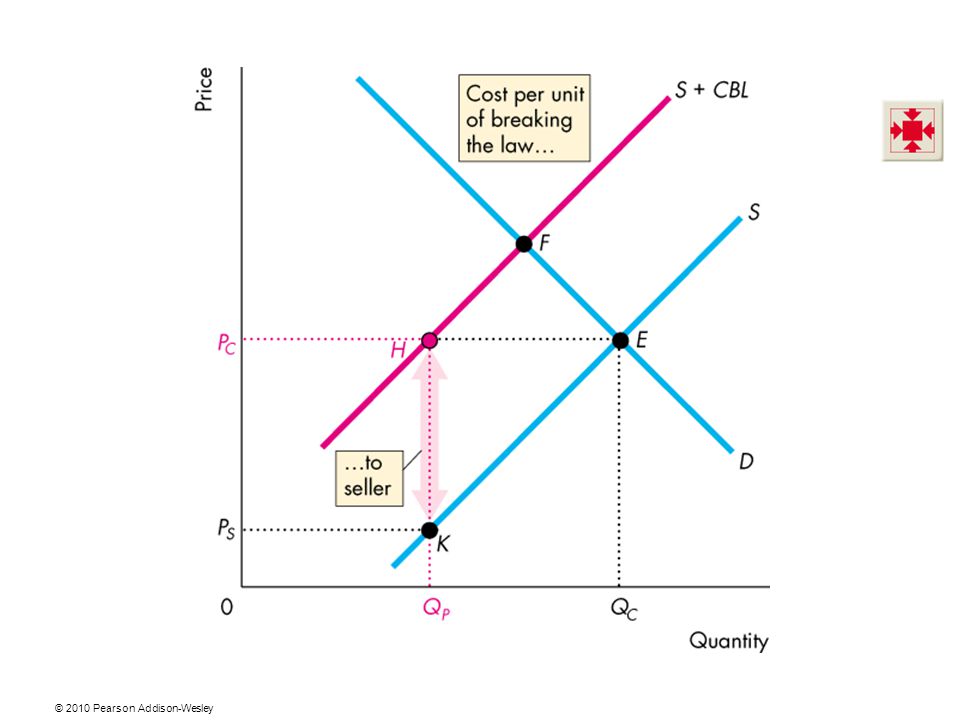
A Free Market for a Drug Figure 6.13 shows the market for a drug such as marijuana. Market equilibrium is at point E. The price is PC and the quantity is QC.

55
Markets for Illegal Goods
Penalties on Sellers If the penalty on the seller is the amount HK, then the quantity supplied at a market price of PC is QP. Supply of the drug decreases to S + CBL. The new equilibrium is at point F. The price rises and the quantity decreases.

57
Markets for Illegal Goods
Penalties on Buyers If the penalty on the buyer is the amount JH, the quantity demanded at a market price of PC is QP. Demand for the drug decreases to D – CBL. The new equilibrium is at point G. The market price falls and the quantity decreases.

59
Markets for Illegal Goods
But the opportunity cost of buying this illegal good rises above PC because the buyer pays the market price plus the cost of breaking the law.

60
Markets for Illegal Goods
Penalties on Both Sellers and Buyers With both sellers and buyers penalized for trading in the illegal drug, both the demand for the drug and the supply of the drug decrease.

62
Markets for Illegal Goods
The new equilibrium is at point H. The quantity decreases to QP. The market price is PC. The buyer pays PB and the seller receives PS.

63
Markets for Illegal Goods
Legalizing and Taxing Drugs An illegal good can be legalized and taxed. A high enough tax rate would decrease consumption to the level that occurs when trade is illegal.

Similar presentations