Download presentation
Presentation is loading. Please wait.

1
Performance Models for Application Optimization
Walid Abu-Sufah Visiting Scholar, University of Illinois Associate Professor, University of Jordan

2
Outline Objective Overview Relate roofline/capacity Open Issues
Roofline model Capacity model Relate roofline/capacity Open Issues Discussion: How could PMUs help

3
1. Objective Explore how a model for a target architecture could be used for application tuning (may be in a compiler?). All approaches, including autotuning, have involved running experiments. Library guys may be willing to do that but compiler guys don't want to make a compiler that 'searches'. 99% of developers wouldn't use it.

4
2.1 Roofline Model For applications where off-chip memory bandwidth is the constraining resource (limit) in system performance. Relates processor performance to off-chip memory traffic. Bound and Bottleneck Model good enough to understand which optimizations to try to get next level of performance So far, demonstrated for several HPC dwarfs and multicore systems.

5
Bounds = Peak Processing Bandwidth; MFLOP/sec
= Peak DRAM Bandwidth; Mbytes/sec “Operational Intensity”: Average number of Floating Point Operations per Byte to DRAM, FLOPs/Byte Varies by multicore design (cache org.) and dwarf Characterize dwarf for a particular multicore design
 and dwarf. Characterize dwarf for a particular multicore design.")
6
Performance Model Graph
Y axis is GFLOPs/sec X-axis is FLOPs/Byte (i.e. Operational Intensity) Can plot peak DRAM BW, since (GFLOPs/sec) (FLOPs/Byte) “Roofline” = GBytes/sec
 Can plot peak DRAM BW, since. (GFLOPs/sec) (FLOPs/Byte) Roofline = GBytes/sec.")
7
Roofline Visual Performance Model
“Ridge Point”: minimum Operational Intensity to get Peak Performance Compute Bound Memory Bound Ridge Point

8
Roofline model for AMD Opteron X2

9
Roofline model for Opteron X2 vs. Opteron X4

10
Roofline model with ceilings for Opteron X2

11
Roofline model with ceilings for Opteron X2.

12
Roofline model with ceilings for Opteron X2

13
What is next for Roofline
Non-floating point kernels would be interesting e.g., Sort (potential exchanges/sec vs GB/s), Graph Traversal (nodes traversed/sec vs. GB/s) Opportunities for others to help investigate: many kernels, multicores, metrics, … For example, Jike Chong ported two financial PDE solvers to four other multicore computers: the Intel Penryn and Larrabee and NVIDIA G80 and GTX280.[9] He used the Roofline model to keep track the platforms' peak arithmetic throughput and L1, L2, and DRAM bandwidths. By analyzing an algorithm's working set and operational intensity, he was able to use the Roofline model to quickly estimate the needs for algorithmic improvements. Specifically, for the option-pricing problem with an implicit PDE solver, the working set is small enough to fit into L1 and the L1 bandwidth is sufficient to support peak arithmetic throughput, so the Roofline model indicates that no optimization is necessary. For option pricing with an explicit PDE formulation, the working set is too large to fit into cache, and the Roofline model helps to indicate the extent to which cache blocking is necessary to extract peak arithmetic performance
, Graph Traversal (nodes traversed/sec vs. GB/s) Opportunities for others to help investigate: many kernels, multicores, metrics, … For example, Jike Chong ported two financial PDE solvers to four other multicore computers: the Intel Penryn and Larrabee and NVIDIA G80 and GTX280.[9] He used the Roofline model to keep track the platforms peak arithmetic throughput and L1, L2, and DRAM bandwidths. By analyzing an algorithm s working set and operational intensity, he was able to use the Roofline model to quickly estimate the needs for algorithmic improvements. Specifically, for the option-pricing problem with an implicit PDE solver, the working set is small enough to fit into L1 and the L1 bandwidth is sufficient to support peak arithmetic throughput, so the Roofline model indicates that no optimization is necessary. For option pricing with an explicit PDE formulation, the working set is too large to fit into cache, and the Roofline model helps to indicate the extent to which cache blocking is necessary to extract peak arithmetic performance.")
14
2.2 Capacity Model HW represented as nodes with “peak” BW
In this talk & for illustration purposes, we assume only two nodes, a memory and a processing node with BWs: System is represented as graph of HW nodes

15
Performance Depends on:
System Characteristics Peak BWs of nodes Memory hierarchy (cache) organization/ size Operational overlap Application Characteristics Relative demands on BWs Overheads
 organization/ size. Operational overlap. Application Characteristics. Relative demands on BWs. Overheads.")
16
Definitions Ration of peak BWs, BW-used per node: , Ratio of BWs-used
Ratio of BW-used per node to system bandwidth-used:

17
Capacity of A Node Average node BW utilized by an application
A function of Application characteristics Node BW

18
Saturated Node Capacity
Assume that at least one of the nodes is saturated, then processor capacity, , is given by A similar expression applies for memory capacity, System capacity, Similar argument holds for unsaturated node pair

19
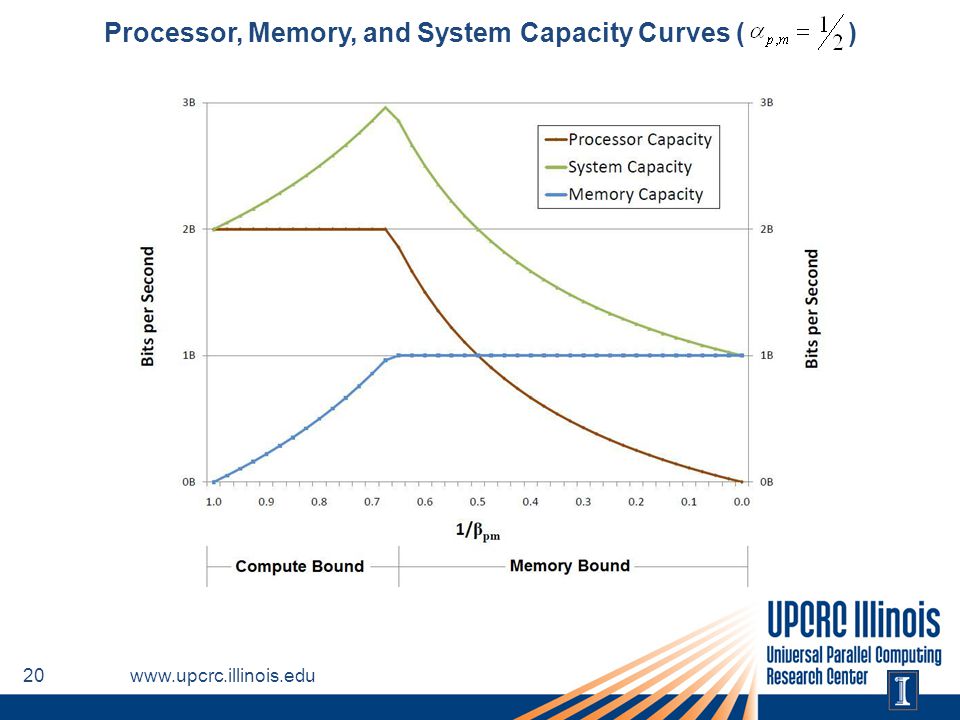
Saturated Node Capacity Expression – Example
For αp,m = ½

20
Processor, Memory, and System Capacity Curves ( )
21
3. Relating Roofline/ Capacity
A processing optimization ceiling, x , in Roofline corresponds to a used processing BW A memory optimization ceiling , y, in Roofline corresponds to a used memory BW, If an application is optimized using optimizations x and y then

22
Roofline model with ceilings for Opteron X2

23
4. Open Issues Modeling with different performance limiting factors
Cache resident client applications (i.e. memory BW is not the limit) Introduce additional bounds: Network BW and IO BW Development of tools based on models for use in application optimization
 Introduce additional bounds: Network BW and IO BW. Development of tools based on models for use in application optimization.")
24
5. Discussion: How could PMUs help

25
References: Roofline Model
S. Williams, A. Waterman, D. Patterson, "Roofline: an insightful visual performance model for multicore architectures,” Communications of the ACM, Volume 52 , Issue 4 (April 2009), Pages David Patterson,” The Parallel Revolution Has Started: Are You Part of the Solution or Part of the Problem?“, April 8, 2009 lecture in the Distinguished Lecture Series ( )
, Pages David Patterson, The Parallel Revolution Has Started: Are You Part of the Solution or Part of the Problem , April 8, 2009 lecture in the Distinguished Lecture Series ( )")
26
References: Capacity Model
D. J. Kuck, "Computer System Capacity Fundamentals,” National Bureau of Standards, Technical Note 851, Oct D. J. Kuck, B. Kumar, A system model for computer performance evaluation, March 1976 SIGMETRICS 76: Proceedings of the 1976 ACM SIGMETRICS Conference on computer performance modeling measurement and evaluation. D.J. Kuck, The Structure of Computers and Computations, Vol. I, John Wiley & Sons, Inc., 1978.

27
David J. Kuck “Capacity-based Codesign of Computer HW and SW“, January 26, 2009 lecture in the Distinguished Lecture Series ( )
Similar presentations


 L1 Cache: (128 KB Instruction +128KB Data at the core level???) L3 Cache: None? CPU.>")


