Download presentation
Presentation is loading. Please wait.

1
The Economics of Data Center Air Flow Containment

2
Course Description This course will explain:
The acceptable range of equipment inlet conditions The value of supply air set points versus return air set points The value for maximizing the separation between supply air streams and return air streams. The benefits for maintaining air separation including: elimination of equipment hot spots elimination of bypass and re-circulation waste reduction in fan energy improvements in cooling coil efficiency ability to support trends toward higher rack heat density improvement in chiller plant efficiency access to increased hours of economization cooling increased overall design flexibility

3
Learning Objectives At the end of this program, you will be able to:
Discuss the three basic methods for achieving air separation through hot aisle containment, cold aisle containment, and vertical exhaust ducts. State the relative advantages and disadvantages for the different separation topologies along with application appropriateness. Quantify the cost-benefits for a well-designed air flow management. Explain the overall value of good air flow management, and how it can be achieved using design elements that can enable or compromise best results.

4
What is the source of your pain?
Hot spots? Cost for energy? Growth and/or technology refresh constrained? High cost of eliminating hot spots or reducing energy costs or positioning for growth?

5
Uptime Institute 2012 Data Center Survey

6
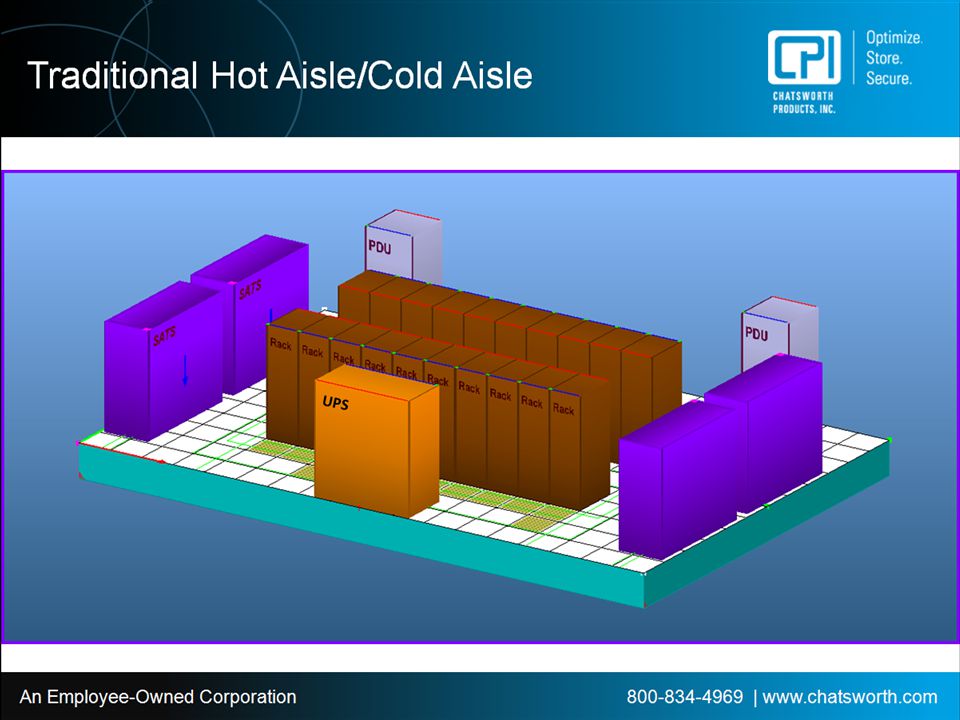
Limitations of Hot Aisle – Cold Aisle
BACK FRONT BACK FRONT BACK 15000 CFM per air handler 300 CFM for 2kW cabinet 1500 CFM for 10kW cabinet 6000 CFM for 2 rows of 10 2kW cabinets 30000 CFM for 2 rows of 10 10kW cabinets Hot air recirculation from the hot aisle into the cold aisle Bypass airflow under the cabinets

7
Recommended Environmental Envelope
What is the target? The New ASHRAE Recommended Environmental Envelope for Class 1 Electronics 2004 Version 2008 Version Low End Temperature 20°C (68°F) 18°C (64.4°F) High End Temperature 25°C (77°F) 27°C (80.6°F) Low End Moisture 40% RH 5.5°C DP (41.9°F) High End Moisture 55% RH 60% RH & 15°C DP (59°F DP) 6
 18°C (64.4°F) High End Temperature. 25°C (77°F) 27°C (80.6°F) Low End Moisture. 40% RH. 5.5°C DP (41.9°F) High End Moisture. 55% RH. 60% RH & 15°C DP (59°F DP) 6.")
8
Typical Set Point Management
72°F (22°C) 55°F (13°C) 14
 55°F (13°C) 14.")
9
Typical Set Point Management
Mixing of supply air and return air in typical data center 15

10
Typical Set Point Management
72°F (22°C) 55°F (13°C) Hot spots Return air could cool an entire data center
 55°F (13°C) Hot spots. Return air could cool an entire data center.")
11
All the hot return air is isolated from the supply air
Supply Set Point Management All the hot return air is isolated from the supply air No hot spots. No concern about return air temperature. 17

12
What is Hot Air Isolation
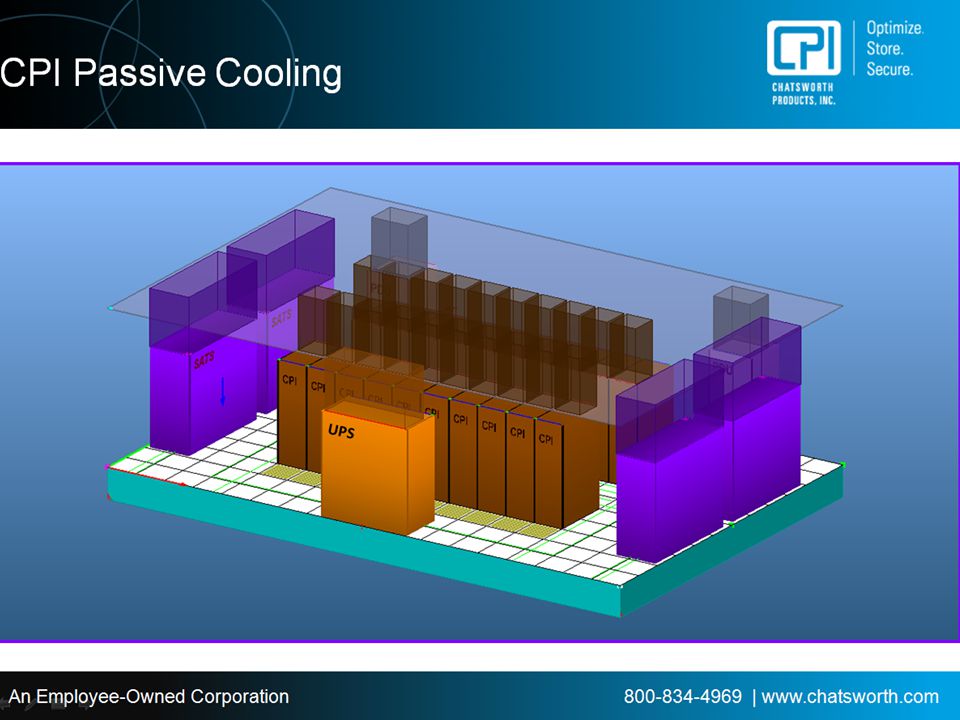
-Completely preventing hot and cold air from mixing -Completely capturing either hot or cold air -100% is probably unrealistic -leakage is important -many design trade-offs -Several design strategies

17
Benefits of Hot Air Isolation
Eliminates hot spots Supports 4x higher heat and power densities (6 kW to 30+kW)! Effectively utilizes 100% of supplied air and reduces chilled air waste! Transfers server equipment ΔT directly back to the HVAC unit! Increase chiller efficiency through higher set points! Can increase economization through higher set-points! Allows supply air delivery from ceiling, wall or floor.
! Effectively utilizes 100% of supplied air and reduces chilled air waste! Transfers server equipment ΔT directly back to the HVAC unit! Increase chiller efficiency through higher set points! Can increase economization through higher set-points! Allows supply air delivery from ceiling, wall or floor.")
18
Elimination of Hot Spots
86 83 81 78 75 72 70 67 64 62 59 Temp is set based on hot spots causing great inefficiencies.

19
Benefits of Hot Air Isolation
Eliminates hot spots Supports 4x higher heat and power densities (6 kW to 30+kW)! Effectively utilizes 100% of supplied air and reduces chilled air waste! Transfers server equipment ΔT directly back to the HVAC unit! Increase chiller efficiency through higher set points! Can increase economization through higher set-points! Allows supply air delivery from ceiling, wall or floor.
! Effectively utilizes 100% of supplied air and reduces chilled air waste! Transfers server equipment ΔT directly back to the HVAC unit! Increase chiller efficiency through higher set points! Can increase economization through higher set-points! Allows supply air delivery from ceiling, wall or floor.")
20
High Density Cooling 4 IBM H 8852 Blade Servers 25kW actual heat load
We have contracted third party CFD testing for high density loads with IBM and HP blade servers. These reports show pressure distribution and the low pressure readings inside the vertical exhaust ducts indicate the direction of flow out of the cabinets and illustrate why fans are not required in the CPI Passive Cooling Solution. We have successfully tested up to 32kW in a cabinet in our thermal lab and a 45kW cabinet was successfully tested in a KyotoCooling data center in The Netherlands. Today, the solution is capable of dissipating more heat than equipment can actually be fit into a 45U cabinet. 4 IBM H 8852 Blade Servers 25kW actual heat load 4 HP c7000 Blade Servers 22kW actual heat load

21
Benefits of Hot Air Isolation
Eliminates hot spots Supports 4x higher heat and power densities (6 kW to 30+kW)! Effectively utilizes 100% of supplied air and reduces chilled air waste! Transfers server equipment ΔT directly back to the HVAC unit! Increase chiller efficiency through higher set points! Can increase economization through higher set-points! Allows supply air delivery from ceiling, wall or floor.
! Effectively utilizes 100% of supplied air and reduces chilled air waste! Transfers server equipment ΔT directly back to the HVAC unit! Increase chiller efficiency through higher set points! Can increase economization through higher set-points! Allows supply air delivery from ceiling, wall or floor.")
22
6 Stulz CCD-1800-CWE CRAH units (N+1)
Elimination of Excess Supply Air 600kW IT load 6 Stulz CCD-1800-CWE CRAH units (N+1) Standard Hot Aisle – Cold Aisle Data Center Air handlers 83% capacity Maximum inlet temperature range = 58.6°F – 79.7°F CRAH fan energy = 32.1 kW or 280,937 kW hours/year Data Center with Hot and Cold Isolation Air handlers operate at 73% capacity Maximum inlet temperature range = 75°F – 76°F CRAH fan energy = 21.6kW or 189,216 kW hours/year 91,721 kW hours energy saved by eliminating need to produce excess bypass supply air These figures are from a case study showing the difference between a very well-designed and well-managed hot aisle – cold aisle data center and a data center with a good hot and cold isolation scheme, with a 600kW IT load and N+1 cooling units. The 10% reduction in air volume produces a 32% reduction in fan energy
 Standard Hot Aisle – Cold Aisle Data Center. Air handlers 83% capacity. Maximum inlet temperature range = 58.6°F – 79.7°F. CRAH fan energy = 32.1 kW or 280,937 kW hours/year. Data Center with Hot and Cold Isolation. Air handlers operate at 73% capacity. Maximum inlet temperature range = 75°F – 76°F. CRAH fan energy = 21.6kW or 189,216 kW hours/year. 91,721 kW hours energy saved by eliminating need to produce excess bypass supply air. These figures are from a case study showing the difference between a very well-designed and well-managed hot aisle – cold aisle data center and a data center with a good hot and cold isolation scheme, with a 600kW IT load and N+1 cooling units. The 10% reduction in air volume produces a 32% reduction in fan energy.")
23
Benefits of Hot Air Isolation
Eliminates hot spots Supports 4x higher heat and power densities (6 kW to 30+kW)! Effectively utilizes 100% of supplied air and reduces chilled air waste! Transfers server equipment ΔT directly back to the HVAC unit! Increase chiller efficiency through higher set points! Can increase economization through higher set-points! Allows supply air delivery from ceiling, wall or floor.
! Effectively utilizes 100% of supplied air and reduces chilled air waste! Transfers server equipment ΔT directly back to the HVAC unit! Increase chiller efficiency through higher set points! Can increase economization through higher set-points! Allows supply air delivery from ceiling, wall or floor.")
24
Supply Air Temperature Return Air Temperature
CRAC Efficiency with Supply/Return Isolation Cooling Unit Supply Air Temperature Return Air Temperature Cooling Capacity Stulz CCD-600-CWE Labeled as 10 Tons 60˚ F 70˚ F 7.8 tons 90˚ F 15.5 tons 105˚ F 20.7 tons Stulz CCD-1800-CWE 30 Tons 23.0 tons 46.0 tons 61.3 tons Another effect of ducted return air systems is a much higher return air temperature. This is not necessarily a bad thing. As you can see here, the higher return air temperatures actually bumps up the performance ratings of the cooling units. This actually only works with chilled water units. DX units have a more or less fixed temperature difference that they work with so higher return temperatures will actually drive up the supply temperatures. With chilled water CRACs, however, actually cooling performance efficiency increases with higher return air temperatures. In addition, if you recall the sensible cooling equation from the beginning of the presentation, the temperature difference is the divisor, so as that temperature rise increases, the amount of air required for the same amount of cooling decreases. We have seen data centers go from experiencing significant over-heating problems to actually putting half of their cooling unit capacity in reserve merely be effectively managing these variables. Almost a 3x improvement in cooling unit efficiency!

25
Benefits of Hot Air Isolation
Eliminates hot spots Supports 4x higher heat and power densities (6 kW to 30+kW)! Effectively utilizes 100% of supplied air and reduces chilled air waste! Transfers server equipment ΔT directly back to the HVAC unit! Increase chiller efficiency through higher set points! Can increase economization through higher set-points! Allows supply air delivery from ceiling, wall or floor.
! Effectively utilizes 100% of supplied air and reduces chilled air waste! Transfers server equipment ΔT directly back to the HVAC unit! Increase chiller efficiency through higher set points! Can increase economization through higher set-points! Allows supply air delivery from ceiling, wall or floor.")
26
38% savings = $168,521 Chiller Efficiency at Higher Set Points
38% Energy Savings 38% savings = $168,521 1MW example Chart from ASHRAE Data Center Design and Operation Book#6: Best Practices for Datacom Facility Energy Efficiency

27
Benefits of Hot Air Isolation
Eliminates hot spots Supports 4x higher heat and power densities (6 kW to 30+kW)! Effectively utilizes 100% of supplied air and reduces chilled air waste! Transfers server equipment ΔT directly back to the HVAC unit! Increase chiller efficiency through higher set points! Can increase economization through higher set-points! Allows supply air delivery from ceiling, wall or floor.
! Effectively utilizes 100% of supplied air and reduces chilled air waste! Transfers server equipment ΔT directly back to the HVAC unit! Increase chiller efficiency through higher set points! Can increase economization through higher set-points! Allows supply air delivery from ceiling, wall or floor.")
28
Increase Economization Through Better Separation Between Supply and Return Air
538.5kW Load

29
Increase Economization Through Better Separation Between Supply and Return Air
538.5kW Load

30
Increase Economization Through Better Separation Between Supply and Return Air
538.5kW Load

31
Benefits of Hot Air Isolation
Eliminates hot spots Supports 4x higher heat and power densities (6 kW to 30+kW)! Effectively utilizes 100% of supplied air and reduces chilled air waste! Transfers server equipment ΔT directly back to the HVAC unit! Increase chiller efficiency through higher set points! Can increase economization through higher set-points! Allows supply air delivery from ceiling, wall or floor.
! Effectively utilizes 100% of supplied air and reduces chilled air waste! Transfers server equipment ΔT directly back to the HVAC unit! Increase chiller efficiency through higher set points! Can increase economization through higher set-points! Allows supply air delivery from ceiling, wall or floor.")
32
Design Flexibility Return Supply

33
Strategies for Air Isolation
Hot Aisle Containment (HAC) Cold Aisle Containment (CAC Hot air isolation (chimney or VED) Now we can move thermostat from return air to supply air and supply a number we want the air to be.
 Cold Aisle Containment (CAC. Hot air isolation (chimney or VED) Now we can move thermostat from return air to supply air and supply a number we want the air to be.")
34
Containment Starts Inside the Cabinet
Floor Tile Cut-out Grommets An Uptime Institute survey of data centers around the country found the average data center had 2.7 times the cooling capacity needed to cool the heat load, but still had numerous hot spots. That is primarily the result of bypass air – chilled air that is bypassing the computer equipment because improperly located floor openings and unsealed openings, such as cable access cut-outs. The photographs show various cut-out sealing products, but there are all kinds of ways to address bypass air, including foam inserts, plenum pillows and cardboard and duct tape. I worked with a data center out in west Texas that was frying blade PCs. We showed them where they were losing their cooling capacity and when they completed their corrective actions, they eliminated all their hot spots and turned off one of two 18 ton CRACs to hold it in reserve for back-up and maintenance. The duct tape and cardboard worked fine for these folks because they were using blade PCs, so the vast majority of the moves, adds and changes were restricted to just swapping blades, minimal or no churn on the cabling. 50% to 80% bypass air observed in many sites has three impacts—all unwanted Hot spots Cooling unit incapacity Incapacity: Any condition that prevents cooling unit from delivering rated capacity—dirty filters, fouled surfaces, leaks, latent cooling, etc. Latent cooling penalty Sealing off cable access ports in floor tiles is recommended by TIA-942 and will be a best practices requirement of the pending BICSI data center standard. Available solutions include brush grommets, sliding metal panels, rubber grommets, plenum pillows, and even duct tape and cardboard. One small data center out in Odessa, Texas used the cardboard and duct tape approach so effectively that they relegated one of their two CRACs strictly to back-up redundancy, after previously experiencing heat-related equipment failures. Application was blade PCs, so MAC activity was centered on blades rather than cabling, so cardboard and duct tape was effective. Obviously, in a high churn environment for cabling, you want something a little more flexible. Cabinet Air Dams Blanking Panels

35
Cabinet Air Re-Circulation
CFD Model Thermal Imaging Photograph Here’s what I was talking about with hot air coming around the sides of equipment. Hot Air re-circulates around the side of the cabinet also. [trace airflow] Hot air mixes with cold air increasing the temperature of air at the server inlet. That’s why blank filler panels by themselves are not sufficient. This CFD model, by the way, was produced for us by the folks from Fluent – we play no favorites – from data we collected in our own test lab. I’ll be showing you several graphics from this test, so you should know some of the basics from the test. We had server replicator heat loads of just over 9kW. The heat loads consumed around 1600 CFM. We had AC pumped under the access floor and got out a little over 500 CFM through the perf tile in front of the cabinet. The structure around the cabinet was designed to replicate a cabinet in the middle of a row of similar cabinets with another row of cabinets both in front and behind it. [next slide] 1” rail set-back = 5+ RMU open space between hot area and cold area

36
Cold Aisle Containment
538.5kW Load

37
Hot Aisle Containment

38
with Cabinet Vertical Exhaust Duct
Hot Air Isolation with Cabinet Vertical Exhaust Duct 538.5kW Load

39
Hybrid Containment with Chimney Cabinets and Hot Aisle Containment
538.5kW Load

41
What Is the Best Containment?
DataCenter 2020: Hot-aisle and Cold Aisle Containment Efficiencies Reveal No Significant Differences Copyright © 2011 Intel Corporation. The DataCenter 2020 is a joint T-Systems and Intel data center test laboratory in the Munich-based Euroindustriepark.

42
Hot Aisle Containment Easy integration of fire suppression
Hot aisle working 90 – 130⁰F Flexible supply air delivery architectures Better low density thermal ride-through Raised floor not required Pod deployment Compatible with row-based cooling

43
Cold Aisle Containment
Data Center working ⁰F Better high density thermal ride-through Easier retrofit of working data center Raised floor (usually) Separate “volume” for fire suppression Pod deployment Possibly sensitive to over-pressure Compatible with row-based cooling
 Separate volume for fire suppression. Pod deployment. Possibly sensitive to over-pressure. Compatible with row-based cooling.")
44
Cabinet Containment Working environment @ 74 - 80⁰F
16’ pitch may impact fire suppression Raised floor not required Thermal ride-through (variable dependent) Cabinet deployment 3050 CFM density threshold Flexible supply air delivery architectures
 Cabinet deployment CFM density threshold. Flexible supply air delivery architectures.")
45
Case Study 300kW IT load 2000 square feet 150 watts per square foot
60 cabinets 1,025,567 BTU/hr Case Files

46
Cooling Cost Roll-up 12kW to operate 5 cooling units @ 64% capacity
41.8kW to operate 65°F H2O leaving temperature 0.06 kW for fresh air (N+1) 0.56kW for electrical room (N+1) 0.06kW for battery room (N+1) 15kW for substation (N+1, but not simultaneously running redundancy 608,119 kW hours per year $60,812 cooling budget at $0.10 per kW hour (1.23 COOLING ONLY PUE)
 0.56kW for electrical room (N+1) 0.06kW for battery room (N+1) 15kW for substation (N+1, but not simultaneously running redundancy. 608,119 kW hours per year. $60,812 cooling budget at $0.10 per kW hour. (1.23 COOLING ONLY PUE)")
47
Savings Comparison 44% cooling energy savings over original data center 35.8% reduction in chiller plant energy 73.7% reduction in CRAH fan energy 30% cooling energy savings over optimized hot aisle – cold aisle data center 30.8% reduction in chiller plant energy 52% reduction in CRAH fan energy No economizer in any scenario

48
Benefits of Airflow Management by Containment
Eliminates hot spots Suitable for low, medium and high density Eliminates wasted capacity and saves fan energy Improves cooling unit efficiency Supports supply air set points Reduced chiller plant energy use Increased “free cooling” utilization Facilitates greater design and deployment flexibility Now we can move thermostat from return air to supply air and supply a number we want the air to be.

49
Questions? Thank You For Your Time
This concludes The American Institute of Architects Continuing Education Systems Course Glen ter Horst (708)
")
Similar presentations


 Grants Chapter 6.>")


