Download presentation
Presentation is loading. Please wait.

1
Performance Measurement 101 PART 1
Oregon Public Performance Measure Association (OPPMA) Annual Meeting 8:45 – 11:45 Session with Rita Conrad, Ken Smith and Laura Wipper Willamette University, Salem, OR Read the “OPPMA Welcome” document. Be sure to thank the many people that helped to put this together and the participants for their contributions to improve the performance of their organizations.
 Annual Meeting. 8:45 – 11:45 Session. with Rita Conrad, Ken Smith and Laura Wipper. Willamette University, Salem, OR. Read the OPPMA Welcome document. Be sure to thank the many people that helped to put this together and the participants for their contributions to improve the performance of their organizations.")
2
Today’s Session Part 1: The basics (~60 min)
Intro & Brief History Criteria Logic models Part 2: Small groups (~75 min) Practice Report-out Part 3: Making it happen (~60 min) Three approaches Dialogue Briefly introduce the session – with an outline of what we plan to do. Also, that they may move to the Advanced class over at the business building at any time – in order to accomplish their own learning objectives. Also briefly introduce the three presenters. I have an “academic” perspective – Rita comes from the “Policy” viewpoint – and Laura is the “Organization” expert. We have many decades among us – and yet the total experiences in the entire room are much greater than just our own – even in an introductory session. Please, Please, Please – participate!! State how important it is that we accomplish the individual learning objectives of the participants as much as possible. 2 jtAGAWilsonville04-04
 Practice. Report-out. Part 3: Making it happen (~60 min) Three approaches. Dialogue. Briefly introduce the session – with an outline of what we plan to do. Also, that they may move to the Advanced class over at the business building at any time – in order to accomplish their own learning objectives. Also briefly introduce the three presenters. I have an academic perspective – Rita comes from the Policy viewpoint – and Laura is the Organization expert. We have many decades among us – and yet the total experiences in the entire room are much greater than just our own – even in an introductory session. Please, Please, Please – participate!! State how important it is that we accomplish the individual learning objectives of the participants as much as possible. 2. jtAGAWilsonville")
3
Late 1800’s-1930’s New York Municipal Research Board
Audit of Portland, Oregon International City Management Association (ICMA) Herbert Simon, Nobel Prize winner Three “Take-Aways” for this brief history: Very long history of performance measurement/management in government Oregon has been a leader throughout much of this history Many successes by Oregon and others – but numerous challenges remain
 Herbert Simon, Nobel Prize winner. Three Take-Aways for this brief history: Very long history of performance measurement/management in government. Oregon has been a leader throughout much of this history. Many successes by Oregon and others – but numerous challenges remain.")
4
1970’s Productivity Optimistic Views Negative or Cautionary Views
Harry Hatry (1972; 1978) Negative or Cautionary Views Quinn (1978); Burkhead and Hennigan (1978) In my book chapter with Lee Schiffel – we talk about two “Symposia” that appeared in the leading journal Public Administration Review. The first Symposia occurred in the beginning of the 1970’s and the second in the latter 1970’s. Both included those who were optimistic and favorable (such as Harry Hatry) as well as those who noted concerns and were skeptical. This balance of proponents and opponents in the Academic as well as Professional communities continues today.
 Negative or Cautionary Views. Quinn (1978); Burkhead and Hennigan (1978) In my book chapter with Lee Schiffel – we talk about two Symposia that appeared in the leading journal Public Administration Review. The first Symposia occurred in the beginning of the 1970’s and the second in the latter 1970’s. Both included those who were optimistic and favorable (such as Harry Hatry) as well as those who noted concerns and were skeptical. This balance of proponents and opponents in the Academic as well as Professional communities continues today.")
5
1980’s – Why Accountants? Governmental Accounting Standards Board (GASB) Government Finance Officers Association (GFOA) Association of Government Accountants (AGA) Oregon is the best state at performance reporting – by a long shot (Smith, Cheng, Smith, Schiffel 2006 – available online) It may be a surprise that accountants are one of the professional bodies that have played a significant role in the development of performance measurement and management initiatives. The GASB did a series of research reports in the late 1980’s and conclude that “Its Time has Come” for state and local government organizations to engage in external performance reporting. GASB chose a perhaps obscure phrase to describe what most just call “performance reporting” – they call it “Service Efforts and Accomplishments” or SEA Reporting. The GFOA is a professional organization composed of finance directors or CFO’s of governments. Finance and accounting have many similarities – but there are fundamental differences where accountants are often primarily focused on how to measure and record past events. Finance individuals tend to focus primarily on the present and future decisions and steps that need to be made in order to have adequate cash and resources for the organization to operate. Accountants generally prefer highly standardized language and structures both within their organization as well as across other organizations – in order to facilitate comparisons. Finance professionals are generally concerned with their own unique problems. The AGA has been a supporter of government accountability and external performance reporting – aligning its Certificate of Achievement in SEA Reporting in direct connection with the categories promoted by GASB. My research with Schiffel, Cheng and another Smith show that very few states are excellent at performance reporting – and Oregon is by far the best.
 Oregon is the best state at performance reporting – by a long shot (Smith, Cheng, Smith, Schiffel 2006 – available online) It may be a surprise that accountants are one of the professional bodies that have played a significant role in the development of performance measurement and management initiatives. The GASB did a series of research reports in the late 1980’s and conclude that Its Time has Come for state and local government organizations to engage in external performance reporting. GASB chose a perhaps obscure phrase to describe what most just call performance reporting – they call it Service Efforts and Accomplishments or SEA Reporting. The GFOA is a professional organization composed of finance directors or CFO’s of governments. Finance and accounting have many similarities – but there are fundamental differences where accountants are often primarily focused on how to measure and record past events. Finance individuals tend to focus primarily on the present and future decisions and steps that need to be made in order to have adequate cash and resources for the organization to operate. Accountants generally prefer highly standardized language and structures both within their organization as well as across other organizations – in order to facilitate comparisons. Finance professionals are generally concerned with their own unique problems. The AGA has been a supporter of government accountability and external performance reporting – aligning its Certificate of Achievement in SEA Reporting in direct connection with the categories promoted by GASB. My research with Schiffel, Cheng and another Smith show that very few states are excellent at performance reporting – and Oregon is by far the best.")
6
Original Oregon Model @ ODOT
Roots in work of Glenn Felix Productivity matrix Baseline – or average – levels of performance Historical best or optimum goals Relative weights, performance levels and performance index Efficiency and Effectiveness Cost vs. Quality Gainshare pilot at ODOT proves value is in the measures and the conversation

7
Striving for Balance Effectiveness Efficiency
Cost per product, service or result Labor per product, service or result Direct hours Indirect hours Administrative hours Outcome/Goal What’s Important Along the Way Customer Satisfaction Work Life Quality

8
Work Life Quality At ODOT
Regularly gauged the capacity of the organization Sick leave Safety Turnover Employee Survey Equal Opportunity Employment Training

9
Development of Measures
Series of workshops Involved almost all staff Aligned activities to purpose, outcomes, goals Measures were customized by staff Alignment through Key Result Areas Some were “roll-ups”

10
Statewide Rollout Statewide measurement initiative began in 1991 with 16 agencies – Phase 1 More phases followed – 100+ agencies Agency-level measurement facilitated by mentors from previous phases Expanded upon ODOT model Efficiency and effectiveness Tied goal-orientation to Oregon Benchmarks

11
Some 90’s Success Stories
DMV Positive experience with a negative index Ways and Means liked the candid conversation Adult and Family Services Moved focus from application processing to family self-sufficiency Lead the nation in welfare reform Vocational Rehabilitation Decided federal goal of two months back on the job not high enough to justify cost Set goal at 18 months Department of Corrections Sharper focus on direct recipient of program efforts 180 degree swing on recidivism

12
Original Oregon Model Adopted across the US
Implemented nationwide by US Army Corps of Engineers One of first two agencies to act following federal Government Performance Results Act of 1993 At one point, 70 Federal agencies were implementing the “Oregon” model following success of Corps

13
Elements of Oregon’s Key Performance Measure System
Tiered, linked system for external reporting Common language Logic models Criteria Budget

14
Linking state performance to benchmarks
Progress Board prepares KPM-Benchmark Crosswalks for W&M subcommittees Measuring Up by Jonathan Walters 98 Progress Board prepares Performance Measure Guidelines for State Agency Budget Instructions Oregon laws required agency performance measures 93 09 08 93 94 95 96 97 98 99 00 01 02 03 04 05 06 07 SB555 gives Progress Board first time evaluation function HB 3358 gives performance measurement role to Progress Board National Performance Measurement Movement LFO and BAM assume more performance measurement and management functions

15
Benchmarks.oregon.gov Oregon Benchmarks and Performance Measures

16
Activity #1 Getting to Know You

17
Why measure performance? To get results.
It’s at the core of results-based management Fosters internal learning and improvement Is the ship running well? Provides greater external accountability Is the ship on course? Informs policy-making Should the ships change course? 17

18
CRITERIA What makes a good performance measure?
Common language Alignment (line-of-sight) Accurate and reliable data A few key measures Time-framed targets Someone in charge Comparisons Customer satisfaction 18
 Accurate and reliable data. A few key measures. Time-framed targets. Someone in charge. Comparisons. Customer satisfaction. 18.")
19
Criterion #1. Common language
Altitude 30,000 ft. OUTCOME, high-level = Societal result OUTCOME, intermediate = Entity result OUTPUT = Product or service INPUT = Time or money EFFICIENCY =Input per output or Input per outcome 20,000 ft. 10,000 ft. 5,000 ft. 19

20
Practical application
3. High-Level Outcomes (HLO) – Is the world you are attempting to affect changing? Oregon Benchmark #65, Juvenile Recidivism – % of juveniles referred w/in 12 months … 2. Intermediate Outcomes – Is the strategy producing the desired result? % of treated youth with reduced risk factors 1. Outputs – Is the strategy getting done? # of youth completing treatment 20
 – Is the world you are attempting to affect changing Oregon Benchmark #65, Juvenile Recidivism – % of juveniles referred w/in 12 months … 2. Intermediate Outcomes – Is the strategy producing the desired result % of treated youth with reduced risk factors. 1. Outputs – Is the strategy getting done # of youth completing treatment. 20.")
21
HLO - Mission or Benchmark Key Performance Measures
Criterion #2. Alignment - line-of-sight to goals and high-level outcomes HLO - Mission or Benchmark Intermediate Outcomes 3C 2 Impact Outputs 3B Goal 1 Strategies to achieve the goal 3A Key Performance Measures 3 21

22
Criterion #3. Accurate and reliable data
Trustworthy data is essential. Example: verifiable records trump estimates Per measure - at least one data point, preferably several Data should match the measure. 22 jtAGAWilsonville04-04

23
Goal: Prevent Juvenile Crime How high up do you want to go?
Criterion #4. Few key measures – different measures for different purposes More agency influence Goal: Prevent Juvenile Crime Juvenile recidivism DECREASES. High-Level Outcome % of served youth with mitigated risk factors INCREASES. Intermediate Outcome “So That” More public interest % of high risk youth completing program INCREASES. Intermediate Outcome “So That” % of grantees trained INCREASES. Output “So That” How high up do you want to go? 23

24
Criterion #5. Time-framed targets
2003 Actual: 20 TARGET = Desired level at a given point in time Ambitious but realistic Set targets using: trend data comparisons expert opinion Example: hours of travel delay per capita per year 2007 Target: 15 24 jtAGAWilsonville04-04

25
Criterion #6. Someone in charge
Management, staff and stakeholders need to know where the buck stops Critical for improving performance 25

26
Criterion #7. Measures of customer satisfaction
This is a required Key Performance Measure (KPM) for Oregon state agencies. Rationale: Those who pay for their government should be satisfied with their government. 26
 for Oregon state agencies. Rationale: Those who pay for their government should be satisfied with their government. 26.")
27
Criterion #8. Comparisons
“We resolved complaints within three weeks on average.” Is this good or bad? How does actual performance compare to industry standards? Rationale: to better understand whether action is needed. Difficult but not impossible! Agency suggestion: “peer” agencies develop common measures and comparator 27

28
LOGIC MODEL - a tool for thinking it through
Getting started IMPORTANT: Engage those whose performance will be measured. Have a clear statement of goals. “Look up” to mission & high-level outcomes (benchmarks) “Look down” to what you are doing and how you are measuring performance Agency Goals 1 Performance Measures 3 2 High-level outcomes 28
 Look down to what you are doing and how you are measuring performance. Agency Goals. 1. Performance Measures High-level outcomes. 28.")
29
Logic model example #1 – Citizen involvement in land use planning
HLO: % of cities with neighborhood organizations. 2 INTERMEDIATE OUTCOMES % participating citizens with improved understanding Customer satisfaction ratings 3C Impact GOAL: Citizen involvement (C.I.) in land use planning 1 OUTPUTS # citizens trained. # C.I. guidelines distributed. 3B Agency Performance Measures 3 STRATEGY Jointly sponsor, with cities, regional educational events for private citizens every quarter. 3A 29
 in land use planning. 1. OUTPUTS # citizens trained. # C.I. guidelines distributed. 3B. Agency Performance Measures. 3. STRATEGY. Jointly sponsor, with cities, regional educational events for private citizens every quarter. 3A. 29.")
30
Logic model example #2 – Juvenile crime
HLO Juvenile Arrests (OBM#61) 2 INTERMEDIATE OUTCOMES % of juveniles in JCP programs with significantly mitigated risk factors. 3C Impact GOAL Reduce juvenile crime. 1 OUTPUTS # grants awarded by county # days of TA delivered by county 3B Agency Performance Measures 3 STRATEGY Award grants to local contractors to conduct “best practice” juvenile crime prevention programs (JCP). 3A 30
 2. INTERMEDIATE OUTCOMES. % of juveniles in JCP programs with significantly mitigated risk factors. 3C. Impact. GOAL. Reduce juvenile crime. 1. OUTPUTS # grants awarded by county. # days of TA delivered by county. 3B. Agency Performance Measures. 3. STRATEGY Award grants to local contractors to conduct best practice juvenile crime prevention programs (JCP). 3A. 30.")
31
Logic model example #3 – Healthy, thriving children
HLO: % of kindergarteners ready to learn (Benchmark #18) 2 INTERMEDIATE OUTCOMES % of children from participating (trained) families entering school ready to learn 3C Impact GOAL Healthy, thriving children. 1 OUTPUTS # grants awarded by county 3B Agency Performance Measures 3 STRATEGY Award grants to local contractors to design/deliver “best practice” parent education classes 3A 31
 2. INTERMEDIATE OUTCOMES. % of children from participating (trained) families entering school ready to learn. 3C. Impact. GOAL Healthy, thriving children. 1. OUTPUTS # grants awarded by county. 3B. Agency Performance Measures. 3. STRATEGY Award grants to local contractors to design/deliver best practice parent education classes. 3A. 31.")
32
PART 2: Small group exercise – 20 min.
Pick an organization from within your group Pick a goal from that organization Work through the logic model as a team Select two key measures – the most important – for box #3 Select a spokesperson to report out 32

33
Performance Measurement 101: Part 3
Oregon Public Performance Measure Association (OPPMA) Annual Meeting 8:45 – 11:45 Session with Rita Conrad, Ken Smith and Laura Wipper Willamette University, Salem, OR 33
 Annual Meeting. 8:45 – 11:45 Session. with Rita Conrad, Ken Smith and Laura Wipper. Willamette University, Salem, OR. 33.")
34
Part 3 – Making it Happen Performance Management
Integrated across many systems/disciplines Multiple Steps that usually include: Strategy Reports with data Discuss/Argue Learn/Change Revisit Strategy No single dominant view – but common tools: Balanced Scorecard, Strategy Maps, LEAN, Six Sigma, TQM, Variance Analysis, Organization Alignment/Incentives, etc. Numerous barriers, challenges and gaps

35
Some Models for Measurement
Cell Organ Person

36
Background Laura has worked in ODOT and other agencies for almost 20 years Ken has studied performance reporting by cities and states for over 17 years

37
Why create a “model” Our hope is to help participants create their own mental models of: Where they and their organization are at What are the next steps/models they can use What choices and priorities they should consider as they move forward The models are not intended to be judgmental – where one level is always better or more appropriate….the costs/benefits for each approach need to be carefully considered….not every model works for every person

38
Measuring to Managing Measures Integrated Operating Unit Approach
System Integrated Macro System Unconnected Measures: Quantitative or Qualitative Only Integrated Measures: Goal-Based Leading & Lagging Macro & Micro Inter-Connected Measures: Organization-Based Program-Based

39
Operating Unit “system” Integrated MACRO System
Three Models Overview Single Measures Operating Unit “system” Integrated MACRO System Description Lists one or many measures – does NOT show logic model how the measures connect in a logical fashion Illustrates or describes how various measures or explanatory information impacts the desired outcome for a single entity or system Illustrates or describes how various measures or explanatory information impacts the desired outcome for a several interacting entities/systems Examples Some of the Oregon APPR’s Balanced Scorecard Oregon Benchmarks “actual” Carl DeMaio’s “Perf Logic Model” GASB “ideal” with explanatory info Oregon Benchmarks “ideal” City of Coral Springs – case study Strengths Easy – can be great place to start Collecting and sharing raw data often starts good conversations Logic model connections internal to the system/entity Exhaustive model Weaknesses Lack of logic model limits usage – and allows different interpretations No connection to explanatory factors outside the entity such as other orgs & socio-economic environment Very complicated – especially if using statistical tools like regression Equation If we measure – performance will improve Outcome = org measure 1 org measure 2 org measure 3 Outcome = Org measures + Outside Orgs + Environment

40
A Model for Integrated Measures
DV = IV + IV + IV Organization's Measures Societal Outcomes Environmental Measures Other Orgs' Measures DV: Dependent Variables IV: Independent Variables

41
An Example using Education
Measures Approach Operating Unit System Integrated Macro System % At Grade Level Adequate Progress After School Programs Demographics & Behavior Test Scores Attendence Parent Volunteers % At Grade Level Literacy Rates Literacy Strands = + +

42
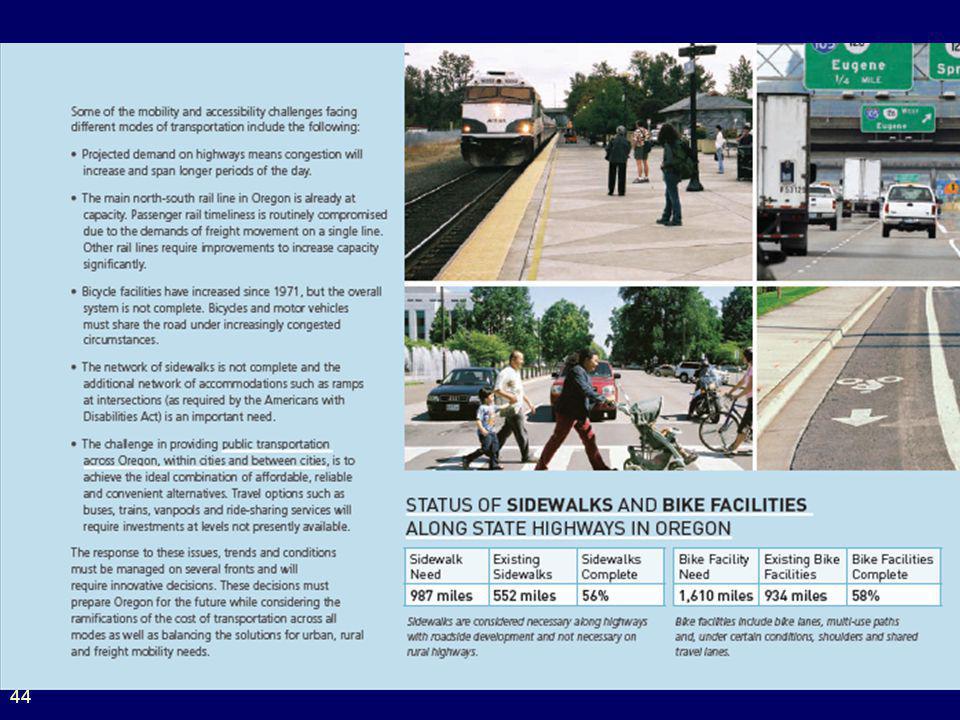
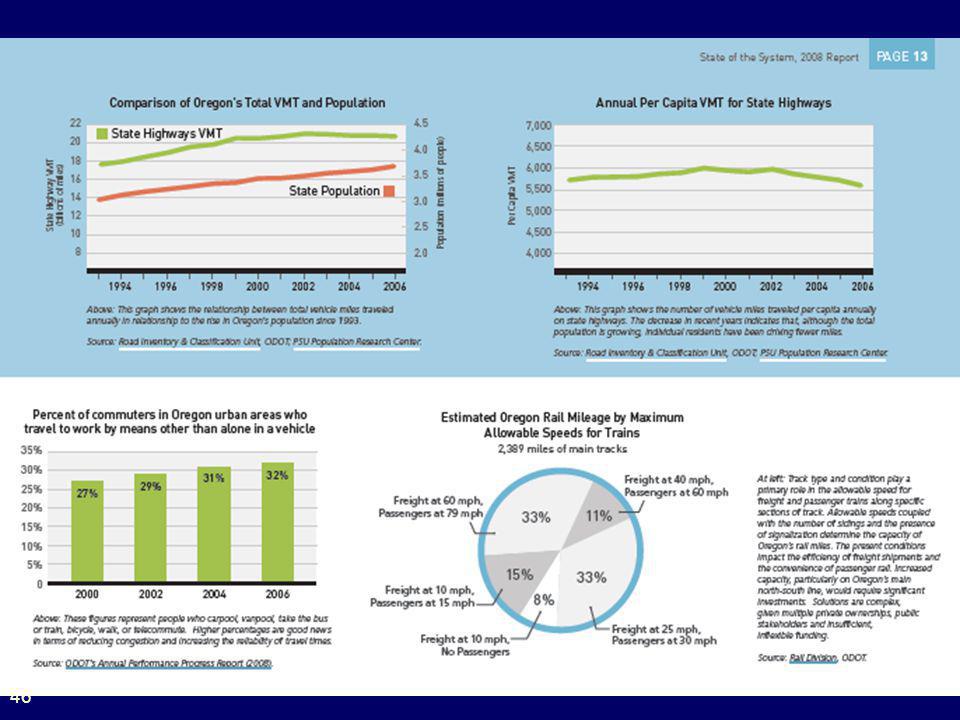
An Example using ODOT

47
DV = IV + IV + IV Organization's Measures Other Orgs' Environmental Societal Outcomes = + +

48
“5 Principles” by Bob Paladino
Similar to many other models – I like his since he uses both government and business examples – and book available on Amazon $25 I also like his model since it focuses explicitly on the need for: a Chief Performance Officer (CPO) Using multiples tools (BSC, LEAN, Maps, etc) p.s. I also like him because he is a CPA
 Using multiples tools (BSC, LEAN, Maps, etc) p.s. I also like him because he is a CPA.")
49
Five Key Principles Establish CPM (Corporate Performance Management) Office and Officer Refresh and Communicate Strategy Cascade and Manage Strategy Improve Performance Manage and Leverage Knowledge

50
Illustration of “5 Key Principles”

51
Challenges/Barriers “9 out of 10 companies fail to implement their business strategies” Paladino p. 11 Hey there government folks – the so called “business sector” struggles with putting these good ideas into action just like we do

52
Paladino’s Four Barriers to Implementation
Vision Only 5% of the workforce understands the strategy Management 85% of executive teams spend less than one hour per month discussing strategy Resource 60% of organizations don’t link budgets to strategy People Only 25% of managers have incentives linked to strategy

53
Bob Behn - Harvard lecturer (Has a nice monthly newsletter)
Why Performance Management is NOT sweeping the world? (2002) Practical reasons: It just does not work Political reasons: Does not win elections Managerial reasons: It is da?n hard Psychological reasons: Creates legit fear and Requires organization changes Behn argues that performance management has NOT swept the world – that there are many instances where a deep investment and activity in performance management has NOT occurred – though he certainly acknowledges that many people talk about it and that there do appear to be isolated instances of quality application. Behn suggests four plausible reasons why not everyone has “jumped on the performance bandwagon” – 4 of these have been written about or discussed by other authors (Practical, Political, Managerial and Psych fear). He adds his background in organization psychology to discuss additional barriers from the ORGANIZATION CHANGE view – that performance management is a huge paradigm shift and difficult for people and their organizations to quickly shift ot the a new mentality…..new mentalities include preferring learning over success – willingness to try new things – being transparent with information and progress in a timely fashion – among others….. The bottom line from this article is there are valid reasons to be skeptical about performance management – and to honestly look for the real reasons why it is hard (and worthwhile) in order to overcome certain hurdles and avoid others altogether.
 Practical reasons: It just does not work. Political reasons: Does not win elections. Managerial reasons: It is da n hard. Psychological reasons: Creates legit fear and. Requires organization changes. Behn argues that performance management has NOT swept the world – that there are many instances where a deep investment and activity in performance management has NOT occurred – though he certainly acknowledges that many people talk about it and that there do appear to be isolated instances of quality application. Behn suggests four plausible reasons why not everyone has jumped on the performance bandwagon – 4 of these have been written about or discussed by other authors (Practical, Political, Managerial and Psych fear). He adds his background in organization psychology to discuss additional barriers from the ORGANIZATION CHANGE view – that performance management is a huge paradigm shift and difficult for people and their organizations to quickly shift ot the a new mentality…..new mentalities include preferring learning over success – willingness to try new things – being transparent with information and progress in a timely fashion – among others….. The bottom line from this article is there are valid reasons to be skeptical about performance management – and to honestly look for the real reasons why it is hard (and worthwhile) in order to overcome certain hurdles and avoid others altogether.")
54
Building Your Plan Three different tools – same basic idea to self-evaluate using a Gap Analysis ActiveStrategy online “Strategy Activator” 19 questions Paladino Chapter 9 – “3 Step Self-Diagnostic” 35 best practices (Score yourself – Gap – Action) Weidner “Accountability and Transparency” 17 questions We will illustrate each of these approaches. The online quiz is certainly intended to generate consulting business – and I have had no prior experience with this particular consulting firm. The thing I like about their approach is they seem to appreciate the importance of: 1) Making the strategy explicitly visual via cascaded scorecards 2) Common data elements using tools like XML 3) Need for lots of training in both technical and leadership/buy-in topics Paladino’s self-assessment is useful in that it ties directly to his Five Key Principles. His model is a comprehensive one – certainly close to what we call the integrated approach – and is similar to Active Strategy in the importance of top level buy-in, the need for explicit visual strategy maps, and the importance of taking action. Paladino focuses a bit more on organizational learning while Active Strategy focuses on technical data issues – both are often underappreciated and underinvested. Weidner is interesting in that it comes from someone that used the GASB approach during his early work in the city/county government of Nashville/Davidson County Tennessee.
 Weidner Accountability and Transparency 17 questions. We will illustrate each of these approaches. The online quiz is certainly intended to generate consulting business – and I have had no prior experience with this particular consulting firm. The thing I like about their approach is they seem to appreciate the importance of: 1) Making the strategy explicitly visual via cascaded scorecards. 2) Common data elements using tools like XML. 3) Need for lots of training in both technical and leadership/buy-in topics. Paladino’s self-assessment is useful in that it ties directly to his Five Key Principles. His model is a comprehensive one – certainly close to what we call the integrated approach – and is similar to Active Strategy in the importance of top level buy-in, the need for explicit visual strategy maps, and the importance of taking action. Paladino focuses a bit more on organizational learning while Active Strategy focuses on technical data issues – both are often underappreciated and underinvested. Weidner is interesting in that it comes from someone that used the GASB approach during his early work in the city/county government of Nashville/Davidson County Tennessee.")
55
Additional Case Studies: (time permitting)
City of Coral Springs, Florida North Carolina Benchmarking Project ExPeRT Willamette

56
A few links to useful sources
BOOKS Balanced Measures for Strategic Planning, by Kathleen Monahan (2000) Balanced Scorecard, by Robert Kaplan and David Norton (1st book in 1992 – several additional books and articles) Five Key Principles of Corporate Performance Management, by Bob Paladino (2007) BLOGS Governing.com is very good – 10 or so writers like Miller, Metzenbaum, etc. COMPUTER CONSULTANTS Active Strategy – 9 phase model ORGANIZATIONS National Performance Management Advisory Commission There are undoubtedly many other links in each category. These are just a few that are particularly relevant to the presentation given today – or to ones that I have directly communicated with. The themes within each are very stable across other books, consultants and professional organizations.
 Balanced Scorecard, by Robert Kaplan and David Norton (1st book in 1992 – several additional books and articles) Five Key Principles of Corporate Performance Management, by Bob Paladino (2007) BLOGS. Governing.com is very good – 10 or so writers like Miller, Metzenbaum, etc. COMPUTER CONSULTANTS. Active Strategy – 9 phase model. ORGANIZATIONS. National Performance Management Advisory Commission. There are undoubtedly many other links in each category. These are just a few that are particularly relevant to the presentation given today – or to ones that I have directly communicated with. The themes within each are very stable across other books, consultants and professional organizations.")
57
Contact Information Rita Conrad Ken Smith Laura Wipper

Similar presentations


>")


 Grants Chapter 6.>")