Download presentation
Presentation is loading. Please wait.

1
WATER QUALITY Thursday 7 July: Session 1
Water quality issues for groundwater and their relationship to sanitation and health. Dr. L Katiyo (IWSD)
")
2
3/31/2017 WHO Definition Defines safe drinking water as water that “does not represent any significant risk to health over the lifetime of consumption, including different sensitivities that may occur between life stages.”

3
Guidelines vs. Standards
3/31/2017 Guidelines vs. Standards Guideline: a recommended limit that should not be exceeded Standard: a mandatory limit that must not be exceeded (often reflects legal duty or obligation) WHO Guidelines for Drinking Water Quality (2006) Guideline values to ensure safety of drinking water Standards vary among countries and regions
 WHO Guidelines for Drinking Water Quality (2006) Guideline values to ensure safety of drinking water. Standards vary among countries and regions.")
4
Why Do We Do Water Quality Testing?
3/31/2017 Why Do We Do Water Quality Testing? Ensure safe drinking water Identify problems Adopt precautionary measures Raise awareness Determine the effectiveness of water treatment technologies Select an appropriate water source Influence policies to supply safe water

5
Categories of Contaminants
3/31/2017 Categories of Contaminants Chemicals Microbiological Physical

6
Categories of Contaminants
3/31/2017 Categories of Contaminants Chemicals Organic Inorganic pH Microbiological Bacteria Virus Protozoa Helminths Physical Turbidity Colour Odor Taste

7
Water Sampling Microbiological sampling
Indicator organisms for pathogen presence Physical sampling turbidity, conductivity, total dissolved solids etc Chemical sampling - pH, dissolved oxygen, phosphates, chemical oxygen demand, biological oxygen demand, mineral impurities (iron, manganese, chloride, lead, sodium etc)
")
8
Types of Testing Observation Field testing Advantages: Limitations:
3/31/2017 Types of Testing Observation Advantages: Quick and easy Inexpensive Limitations: Qualitative – low precision and accuracy Field testing Easy to use and portable Rapid results Less expensive Less precision and accuracy Less quality assurance

9
Types of Testing Mobile laboratories Laboratory testing Advantages:
3/31/2017 Types of Testing Mobile laboratories Advantages: Controlled environment, High level of precision and accuracy Limitations: Relatively expensive Requires skilled laboratory technicians Laboratory testing Expensive Lack of flexibility to conduct own testing

10
Selecting Test Methods
3/31/2017 Selecting Test Methods Depends on: Objectives Range of concentration Required accuracy and precision Time period between sampling and analysis Technical skills and equipment required Familiarity with the method Availability of resources

11
Where Do We Sample? Source water
3/31/2017 Where Do We Sample? Source water Transport container (before treatment) Treated water Stored water (after treatment) Point of use See Manual Section 3 on how to sample different sources.
 Treated water. Stored water (after treatment) Point of use. See Manual Section 3 on how to sample different sources.")
12
MICROBIOLOGY OF WATER

13
micro-organism that cause disease
Pathogens micro-organism that cause disease 4 types of pathogens Bacteria Virus Protozoa Helminths Zoom: Bacteria on the tip of a pin

14
Size Comparison Smallest Largest Virus (0.02 to 0.2 micron) Virus
Bacteria Bacteria (0.2 to 5 microns) Protozoa Helminth Protozoa 4 to 20 microns Largest Helminth 40 to 100 microns Representation of the relative sizes of different pathogens, and the pore size in a sand filter. Pathogen size is very relevant to understanding filter technology. Pore size in a sand filter (1 micron)
 Protozoa. Helminth. Protozoa. 4 to 20 microns. Largest. Helminth. 40 to 100 microns. Representation of the relative sizes of different pathogens, and the pore size in a sand filter. Pathogen size is very relevant to understanding filter technology. Pore size in a sand filter (1 micron)")
15
Viruses Hepatitis (A and E are faecal-oral) Dengue Fever Polio
Viruses depend on the host cells that they infect to replicate When stimulated, new viruses are formed, and burst out of the host cell, killing it and going on to infect other cells Some viruses can remain viable outside of a host for long periods, also in dry conditions Viruses can survive but will not grow in food There is a dispute over whether viruses are living or not. Generally accepted that viruses are not living but contain a “recipe” for a form of life; require a host cell, contain genes, self assemble rather than reproduce, evolve and adapt through a process of natural selection.

16
Bacteria Cholera E-Coli Salmonella Shigella Typhoid Trachoma
Most of the organisms found in feces are bacteria. There are several billion bacteria in every gram of feces. The diseases they cause generally spread rapidly, and consequently bacteria have been responsible for most of the world’s major epidemics derived from water. Two of the most well known diseases caused by bacteria are typhoid fever and cholera. Can you think of any more? They are the simplest, wholly contained life systems. There are many different types of bacteria. They have different sizes and shapes, but are generally between 0.3 and 100 microns in size. There are many more bacteria that do not normally cause disease – e.g. yeasts, cheese, beer. Food safety standards for cold sliced meats – <10,000,000 heterotrophic bacteria per gram. Most dominant organism found in faeces Most diverse group of micro-organisms Simplest, wholly contained life system Abundant in faeces (1g = billions of bacteria)
")
17
FACTORS AFFECTING NUMBER AND TYPE OF BACTERIA IN WATER
Type of water: Surface or deep Mineral springs Presence of organic matter Temperature Light pH Dissolved oxygen Rainfall Season Storage Filtration

18
Protozoa Single celled organisms
Able to form cysts which are resistant to chlorine Some can stay alive outside of a host Protozoa are larger than bacteria or viruses. They are single celled organisms which can form cysts or vegetative states that can survive in inhospitable environments. Because of this, they are difficult to kill with chlorine. Most of the major waterborne disease epidemics in the North America over the last ten years are due to protozoa. This is because they can survive the chlorination process used in municipal water treatment plants. Two of the more well known protozoa are giardia and cryptosporidia. Giardia Cryptosporidium Malaria

19
Helminths Roundworm Hookworm Guinea Worm Schistosomiasis (Bilharzia)
Worm from a human intestine (20 feet in length) Can live for many years in the body Most do not multiply within the human host Derives sustenance at hosts expense Most helminths are passed in faeces Helminths are parasitic worms. One of the most well known diseases caused by helminths is schistosomiasis which is prevalent in most parts of Africa. Many worms can survive in the body for several years. They make their host weaker by using his food supply to grow. They generally do not multiply within the human host. Most helminths are passed in faeces. Protozoa and helminths are known as parasites.
 Can live for many years in the body. Most do not multiply within the human host. Derives sustenance at hosts expense. Most helminths are passed in faeces. Helminths are parasitic worms. One of the most well known diseases caused by helminths is schistosomiasis which is prevalent in most parts of Africa. Many worms can survive in the body for several years. They make their host weaker by using his food supply to grow. They generally do not multiply within the human host. Most helminths are passed in faeces. Protozoa and helminths are known as parasites.")
20
Fecal pollution: Introduces varieties of pathogens.
Bacterial: Cholera Typhoid fever Shigellosis Diarrhoea E.coli Y.enterocolitica C.fetus Leptospirosis Viral: Hepatitis A , E Rota viral diarrhoea Poliomyelitis Helminthes: Round worm Thread worm Whip worm Hydatid disease Guinea worm disease Fish tape worm Schistosomiasis Protozoal: Amoebiasis Giardiaisis Balantidiasis

21
Microbiological Testing
Testing for every pathogen is time consuming and expensive

22
Bacterial Indicator Organisms
Test for bacterial indicator organisms instead: Cheaper Easier to perform Faster results Does not require highly trained personnel

23
Bacterial Indicator Organisms
Good indicators should: Be present whenever pathogens are present Present in the same or higher numbers than pathogens Specific for faecal contamination Non-pathogenic (harmless) Have a survival time equal to pathogens Not reproduce in water
 Have a survival time equal to pathogens. Not reproduce in water.")
24
Bacteria Heterotrophic Bacteria: Most bacteria in nature, includes all pathogens Total Coliforms: Presence in water may indicate contamination Thermotolerant Coliforms: Found in intestines of warm-blooded animals E. coli: Indicator of fecal contamination

25
Indicator organisms: Esch.coli. Faecal coliforms Faecal streptococci. Clostridium perfringens. Presence of fecal streptococci along with coliforms in the absence of E.coli is also confirmatory of fecal pollution.

26
Escherichia coli (E. coli)
Found mainly in faeces of warm-blooded animals Majority of E. coli is harmless (non-pathogenic) Meets criteria for a good indicator and is the most important Most specific for faecal contamination Limited ability to survive and reproduce in water Non-pathogenic E. coli O157:H7 is an exception – causes severe diarrhoea E. coli O157:H7 does not produce this enzyme and cannot be detected by normal test methods
 Meets criteria for a good indicator and is the most important. Most specific for faecal contamination. Limited ability to survive and reproduce in water. Non-pathogenic. E. coli O157:H7 is an exception – causes severe diarrhoea. E. coli O157:H7 does not produce this enzyme and cannot be detected by normal test methods.")
27
WHO Guidelines Number of E. coli Present (CFU/100 mL) Risk 0 - 10
Reasonable Quality Polluted ,000 Dangerous > 1,000 Very Dangerous Source: WHO, 1997; Harvey, 2007

28
Microbiological Testing Methods
3 methods to determine presence of bacteria in water: Presence-Absence (P-A) Most Probable Number (MPN) Membrane Filtration
 Most Probable Number (MPN) Membrane Filtration.")
29
Presence-Absence (P-A)
Simplest method Add water sample to a bottle containing broth and let it sit for hours Color will change if indicator organism is present Does not show numbers of bacteria! If the sample is positive, the water should be re-tested using membrane filtration to determine the number of bacteria Not recommended by WHO for analysis of surface water and untreated community water supplies Not recommended for testing the efficiency of household water treatment technologies (e.g. biosand filter)
")
30
Positive for Coliforms
Presence-Absence Positive for Coliforms Positive for E. coli Negative

31
Most Probable Number (MPN)
Tells the number of bacteria that are most likely to be in the water sample Add water sample or diluted sample to 5 or 10 or test tubes (or larger tray 50 – 96 tubes) Incubate for hours Gas production and/or cloudiness will be visible if the indicator organism is present Using a table provided, report the number of positive tubes as number of colonies per 100 mL of sample Typically used for wastewater or turbid samples
 Incubate for hours. Gas production and/or cloudiness will be visible if the indicator organism is present. Using a table provided, report the number of positive tubes as number of colonies per 100 mL of sample. Typically used for wastewater or turbid samples.")
32
Most Probable Number (MPN)
# Positive Tubes MPN Index (CFU/100mL) <1.1 1 1.1 2 2.2 3 3.6 4 5.1 5 6.9 6 9.2 7 12.0 8 16.1 9 23.0 10 >23.0 Sample Table for 10 tube test
 < >23.0. Sample Table for 10 tube test.")
33
Most Probable Number (MPN)
Characteristics: Quantitative results Simple to understand and use Relatively inexpensive Can be used with turbid water More labor-intensive than P-A Requires some training Requires incubator & other equipment

34
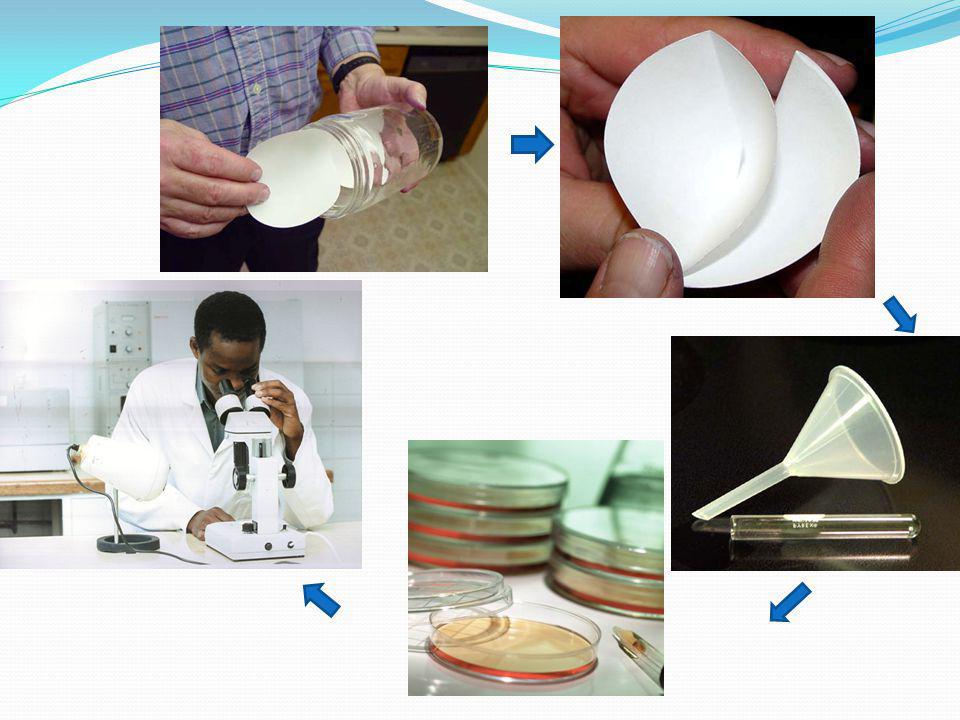
Membrane Filtration Most accurate method to count bacteria
Filter 100 mL of a water sample Add broth to a Petri dish which provides nutrients for the indicator organism to grow Filter the water using the filtration equipment Transfer the filter paper to the Petri dish Incubate for hours depending on the broth If the indicator organism is present, colonies will appear on the filter paper and can be counted Results are reported as the number of colonies per 100 mL of water sample (CFU/100mL) CFU = colony forming units
 CFU = colony forming units.")
35
Membrane Filter Technology
35 Membrane Filter Technology A membrane is a thin material that has pores (holes) of a specific size Membranes trap larger particles that won’t fit through the pores of the membrane, letting water and other smaller substances through to the other side
 of a specific size. Membranes trap larger particles that won’t fit through the pores of the membrane, letting water and other smaller substances through to the other side.")
38
Transporting Samples Bacteria do not survive well in water
3/31/2017 Transporting Samples Bacteria do not survive well in water Temperature can affect bacteria die off Samples should be placed on ice in an insulated container if they cannot be tested right away Ideally – all samples should be tested within 6 hours of sampling If the time exceeds 6 hours, note this in your report Samples exceeding 30 hours (between collection and testing) should not be tested
 should not be tested.")
39
Membrane Filtration Equipment
Field Kits

40
Membrane Filtration Equipment
Incubator

41
Membrane Filtration Equipment
Nalgene Testing Kit

42
Membrane Filtration Advantages: Able to count the number of bacteria
Most accurate test method Ability to test many samples at once Internationally recognized method Rapid Easy & Economical. Gives direct result. Useful in rural areas. Samples can be tested in the field

43
Membrane Filtration Limitations: More labour intensive than MPN, P-A
Requires more training Requires additional equipment Cost of consumables can be high in many countries Turbid water interferes with bacterial growth. Noncoliforms interferes with counting of coliforms. Toxic substances in the water may be absorbed by filter and interferes with bacterial growth.

44
Sampling from a dugwell:
Sampling from a dugwell: A suitable size stone has to be attached to the sampling bottle. A 20 meter length of clean string is tied on the bottle and a stick. Bottle is immersed completely in the water and lowered down to the bottom of the well. Once the bottle is filled ,it is pulled out. Little water is discarded to provide air space.

45
Sampling bottles and bags
3/31/2017 Sampling bottles and bags Whirl-pak® bag (from 120 to 720mL) Plastic Sample Bottles (from 200mL to 1500mL) Convenient Single Use More robust Re-usable
 Plastic Sample Bottles. (from 200mL to 1500mL) Convenient. Single Use. More robust. Re-usable.")
46
Processing of the sample:. Should be processed within 6 hours
Processing of the sample: Should be processed within 6 hours. In case of delay ,water can be filtered by using a membrane filter. Filter paper has to be transported on an absorbent pad saturated with transport medium.

47
Physical sampling:

49
What is Turbidity? A measure of water clarity
The murkier the water, the higher the turbidity. Turbidity reduces the transmission of light into water. Turbidity increases as a result of suspended solids in the water.

51
Sources of Turbidity Phytoplankton blooms Soil erosion Waste discharge
Urban runoff Abundant bottom feeders

52
How is Turbidity Measured?
Secchi disk Measures water transparency Measures depth at which disk is no longer visible Useful for deep water

53
Turbidity in the lab and field
Turbidimeter optical device that measures scattering of light (most accurate) Measure in NTU (nephelometric turbidity units) or JTU (Jackson turbidity units)
 Measure in NTU (nephelometric turbidity units) or JTU (Jackson turbidity units)")
54
Typical Turbidity Data
Water Source Turbidity Level Water bodies with sparse plant and animal life 0 NTU Drinking water <0.5 NTU Typical groundwater <1.0 NTU Water bodies with moderate plant and animal life 1 - 8 NTU Water bodies with large plumes of planktonic life 10 – 30 NTU Muddy water or winter storm flows in rivers NTU

55
So what? Degrades drinking water quality.
Water treatment costs increase. Decreases light penetration in water.

56
Conductivity Conductivity is the measure of water’s ability to conduct an electric current. Estimates amount of total dissolved minerals (ions).
.")
57
Conductivity

58
Conductivity in water Dissolved salts (ions) conduct electrical current in water. Absolutely pure water is a poor electrical conductor.

59
How do we measure Conductivity?
Test with a Conductivity meter Measured in Siemens or mhos/cm

60
Conductivity Units Mhos is ohms backwards! (Mhos is the reciprocal of ohms –if you have to know) So….ohms is a measure of the resistance to a current. The less the resistance, the greater the conductivity. Conductivity in drinking water is low, so we use µmhos/cm or 1 x 10⁻⁶ mhos/cm! Units are sometimes expressed as microsiemens (µS).
.")
61
So What? Increased concentration of salts increases the conductivity
Salts cannot be filtered out Higher conductivity can.… Foul irrigation water (leads to high salinity soils) Kill wildlife Create water shortages
 Kill wildlife. Create water shortages.")
62
Total dissolved solids

63
pH testing tap water Tap water is probably close to being neutral (pH 7), so we will use the two test papers that include pH 7 in their range. pH will be good if the water is somewhat acidic. pH will be good if the water is very slightly acidic to somewhat alkaline.
, so we will use the two test papers that include pH 7 in their range. pH will be good if the water is somewhat acidic. pH will be good if the water is very slightly acidic to somewhat alkaline.")
64
pH testing tap water Let's say we start off with the pH paper. Dip the paper into the beaker with the tap water for just a couple of seconds. Then take it to the chart.

65
pH testing tap water It looks like the pH is between 6.8 and 7.1. So it's looks pretty much neutral. We can now try the other test paper (pH ) for confirmation.
 for confirmation.")
66
pH testing tap water This is the pH paper for the range. Dip in the tap water for a couple of seconds and take it to the chart.

67
pH testing tap water The pH paper turns dark blue which indicates that it was close to the 7.0 pH reading. So it appears that the two different pH test papers both point to a pH close to the neutral pH of 7. This is usual for tap water unless there is something wrong with the water supply.

68
Testing Nitrite, Nitrate and Chlorine

69
Negative test for nitrite

70
Hardness When hard water dries, you see a lot of these salts left behind. When it dries on a window, it's all spotted. The salts are mostly calcium carbonate (chalk), calcium chloride (deicing salt), and sodium chloride (french-fries salt).
, calcium chloride (deicing salt), and sodium chloride (french-fries salt).")
71
Hardness and Alkalinity
A hardness test is mostly measuring the amount of calcium in the water. An alkalinity test is measuring the amount of carbonate in the water. So both tests are targeting calcium carbonate; one measuring calcium and the other measuring the carbonate. So they both are very similar.

72
Hardness and alkalinity
A hardness test is mostly measuring the amount of calcium in the water. An alkalinity test is measuring the amount of carbonate in the water. So both tests are targeting calcium carbonate; one measuring calcium and the other measuring the carbonate. So they both are very similar.

73
Odor and Taste? What are some common odors/tastes? How is it measured?
Earthy, musty, moldy Can be produced by some types of bacteria (actinomycetes) May occur after adding chlorine Grass, hay, straw, wood Associated with algal byproducts – decaying vegetation Marshy, swampy, septic, sewage, rotten egg Sulphur – human or natural Chlorine Residual from water treatment How is it measured? Use your senses Do not breathe in the smell directly, use your hand to waft vapors towards your nose
 May occur after adding chlorine. Grass, hay, straw, wood. Associated with algal byproducts – decaying vegetation. Marshy, swampy, septic, sewage, rotten egg. Sulphur – human or natural. Chlorine. Residual from water treatment. How is it measured Use your senses. Do not breathe in the smell directly, use your hand to waft vapors towards your nose")
74
Colour? Reddish, brown, or yellow Black Dark brown or yellow Foam iron
bacteria growth manganese Dark brown or yellow Industrial waste from tanning industry, pulp and paper Decaying vegetations Foam detergents

76
Chemical testing of water
Chemical Testing Methods Test strips Colour disc comparators Colorimeters & photometers Digital meters Arsenic specific kits

77
Chemical Tests There are many different chemicals that can be found in our drinking water Difficult and expensive to test for all chemicals so we need to select a few that are a priority in the local area Iron, Manganese Arsenic, Fluoride Chlorine Total Dissolved Solids

78
Iron and Health Need small amounts of iron in food to be healthy
No health impact, no WHO Guideline value > 0.3 mg/L of iron Causes a bad taste Stains water pipes and well aprons Stains clothes during washing

79
Manganese Naturally found in groundwater
Water has a black colour or black flakes Common to find manganese and iron together in water

80
Manganese and Health Need some manganese in food to be healthy
Too much or too little manganese can make people sick WHO Guideline value < 0.4 mg/L > 0.15 mg/L of manganese Causes a bad taste Stains water pipes and creates a coating that comes off as small black flakes Stains clothes during washing Stains food during cooking

81
Arsenic Naturally occurring in groundwater

82
As: Where does it come from?
Anthropogenic or Man-Made: Drilling Wells Mineral Extraction Processing Wastes Pesticides Levels of As in water depend on: Level of human activity Distance from pollution sources

83
Arsenic and Health Light or dark spots on skin
Hardening skin on palms and feet Causes cancer Babies and young children are most vulnerable Biggest chemical issue in developing countries, high priority for WHO WHO Guideline < 0.01 mg/L Standards vary between countries

84
Non-Cancer Health Effects
Long-term As exposure was found to be associated with cardiovascular effects (Utah and Taiwan) As exposure has also been reported to cause hypertension, anemia, liver disorders, kidney damage, headache, & confusion. Among children there have been reports of intellectual impairment when As in drinking water exceeded 50 µg/L (Bangladesh)
 As exposure has also been reported to cause hypertension, anemia, liver disorders, kidney damage, headache, & confusion. Among children there have been reports of intellectual impairment when As in drinking water exceeded 50 µg/L (Bangladesh)")
85
Arsenic and Health

86
Fluoride Naturally occurring in groundwater

87
Fluoride and Health Helps make teeth strong and prevents decay at low doses (0.5 – 1.0 mg/L) Higher doses are not good for teeth (1.5 – 4.0 mg/L) Very high doses harms the skeleton (> 10 mg/L) WHO Guideline < 1.5 mg/L
 WHO Guideline < 1.5 mg/L")
88
Chlorine Commonly use chlorine as a disinfectant to treat drinking water Not usually found naturally in water in amounts that can cause harm WHO Guideline < 5.0 mg/L High amounts of chlorine can hurt skin, eyes, throat and lungs if we touch it or breathe it

89
Chlorine for Disinfection
Two things happen when we add chlorine to water: Some chlorine reacts with organic matter to form new chemicals – Combined Chlorine Some chlorine is left over – Free Chlorine Total Chlorine = Combined + Free

90
Chlorine for Disinfection
Consumed chlorine is what kills pathogens in drinking water. Free chlorine is what protects drinking water from re-contamination. Ideal level of free chlorine in drinking water: 0.2 – 0.5 mg/L Typical levels of free chlorine in drinking water are mg/L

91
Chemical Test Methods Test (reagent) strips Colour disc comparators
Colorimeter and photometer Digital meters

92
Test (Reagent) Strips Designed to react with specific chemicals
pH, chlorine, hardness, etc. Compare colour on stick to colour chart Advantages: Inexpensive Easy and simple Provides rough estimate Limitations: Requires visual interpretation of colour Low accuracy +/- 10 %

93
Colour Disc Comparator
Designed to react with specific chemicals Chlorine, fluoride, nitrates, etc. Interchangeable colour discs Advantages: Can be done in moderate field conditions Better accuracy Limitations: Need reagents More expensive Requires visual interpretation of colour

94
Colorimeters & Photometers
Photometer (Wagtech) Uses light source to measure chemical concentration Test a range of chemicals Advantages: More accurate Limitations: More expensive Power source necessary Proper training required Colorimeter (HACH)
 Uses light source to measure chemical concentration. Test a range of chemicals. Advantages: More accurate. Limitations: More expensive. Power source necessary. Proper training required. Colorimeter (HACH)")
95
Arsenic Test Kits Designed specifically for arsenic Advantages:
Fairly accurate – range 2 to 100 ug/L Portable Relatively easy to use Limitations: Requires visual interpretation of colour Expensive

96
Sampling frequency… Depends on…
• The quality of the water source and the type of treatment • Size of the population served by the water source or distribution system • Outbreak of diseases in the community served. If outbreaks occur frequently then the sampling frequency should also be higher. • Resources available • Type of water source • Probability of contamination of water source • Use of water

97
What is Safe Water? 3/31/2017 Facilitator can ask the audience how they would describe good quality and poor quality water.

Similar presentations


>")


 and dissolved.>")
 S. D. Spence.>")


