Download presentation
Presentation is loading. Please wait.

1
Network Dynamics and Cell Physiology John J. Tyson Biological Sciences Virginia Tech

2
Collaborators Kathy Chen Jill Sible Bela Novak Attila Csikasz Funding Agencies DARPA McDonnell Found

3
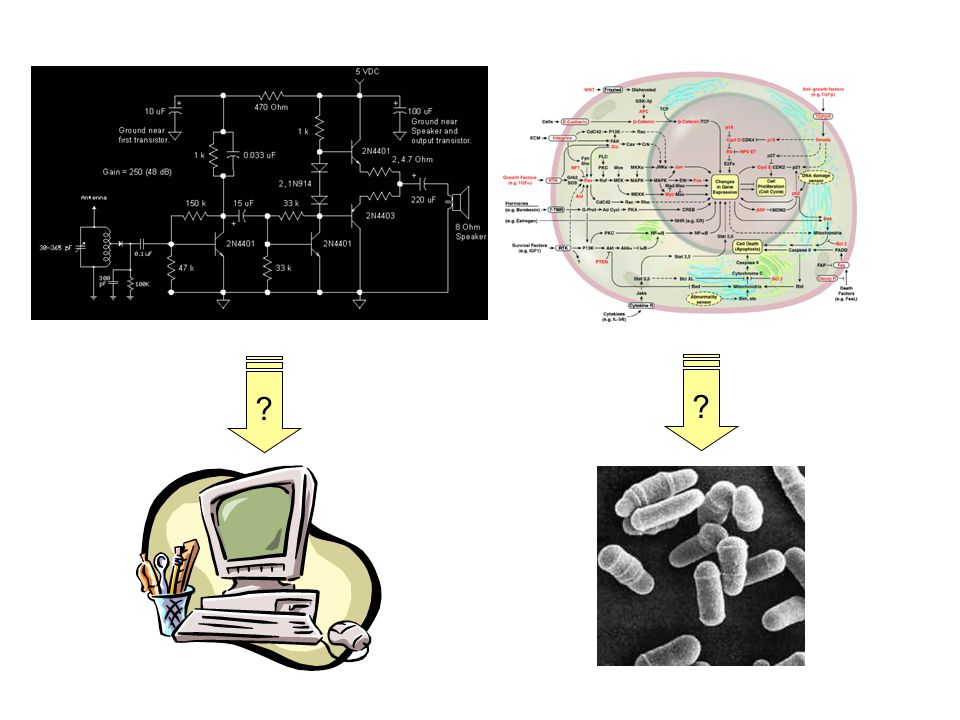
Hanahan & Weinberg (2000) Cell signaling External signals Information Processing System Death Division Reproduction Growth Development Internal Signals
 Cell signaling External signals Information Processing System Death Division Reproduction Growth Development Internal Signals")
4
Information Processing Systems LaptopCell SiliconCarbon Solid stateWatery ProgrammableHard-wired PreciseSloppy DigitalAnalog SequentialParallel ManufacturedSelf-reproducing DesignedEvolved SiliconCarbon Brain Carbon Membrany Learning Accurate Analog/digital Parallel Soma/germ Evolved Carbon $$

5
Hanahan & Weinberg (2000) Signal Transduction Network p21 Smad MAPK MKK MAPK-P PP2A
 Signal Transduction Network p21 Smad MAPK MKK MAPK-P PP2A")
6
R S response (R) signal (S) linear S=1 R rate (dR/dt) rate of degradation rate of synthesis S=2 S=3 Gene Expression Signal-Response Curve
 signal (S) linear S=1 R rate (dR/dt) rate of degradation rate of synthesis S=2 S=3 Gene Expression Signal-Response Curve")
7
R Kinase RP ATP ADP H2OH2O PiPi Protein Phosphorylation RP rate (dRP/dt) 0.25 0.5 1 1.5 2 Phosphatase response (RP) Signal (Kinase) Buzzer Goldbeter & Koshland, 1981 1 R 0
 Phosphatase response (RP) Signal (Kinase) Buzzer Goldbeter & Koshland, R 0")
8
R S EP E R rate (dR/dt) S=0 S=8 S=16 response (R) signal (S) Protein Synthesis: Positive Feedback Fuse Bistability Closed Open Griffith, 1968
 S=0 S=8 S=16 response (R) signal (S) Protein Synthesis: Positive Feedback Fuse Bistability Closed Open Griffith, 1968")
9
Example: Fuse response (R) signal (S) dying Apoptosis (Programmed Cell Death) living Eissing et al. (2004) J Biol Chem 279:36892
 J Biol Chem 279:")
10
R S = R total E EP 0 0.5 1 0 11.5 R E Coupled Buzzers response (R) signal (S) SN Toggle Bistability RP S=0.5 S=1.5S=1
 signal (S) SN Toggle Bistability RP S=0.5 S=1.5S=1")
11
Frog egg MPF Cdc25-P Cdc25 MPF-P Wee1 response (MPF) signal (cyclin) interphase metaphase (inactive) S = Total Cyclin CycB MPF = M-phase Promoting Factor
 signal (cyclin) interphase metaphase (inactive) S = Total Cyclin CycB MPF = M-phase Promoting Factor")
12
MPF activity depends on total cyclin concentration and on the history of the extract Cyclin concentration increasing inactivation threshold at 90 min MPF activity nM cyclin B M I I I II I MPF activity nM cyclin B M M M I/M I I I Cyclin concentration decreasing I M bistability Wei Sha & Jill Sible (2003)
")
13
Oscillations MPF cyclin MPF Cdc25-P Cdc25 MPF-P (inactive) cyclin synthesis cyclin degradation APC negative feedback loop signal (rate of cyclin synthesis) Hopf response (MPF) sss uss
 cyclin synthesis cyclin degradation APC negative feedback loop signal (rate of cyclin synthesis) Hopf response (MPF) sss uss")
14
Pomerening, Kim & Ferrell Cell (2005)
")
15
If knock-out positive feedback loop, then oscillations become faster and smaller amplitude… Figure 4. Pomerening, Kim and Ferrell With + feedback Without + feedback

16
P Wee1 P Cdc25 CycB P Cdc20 CycB APC-P APC TFB I TFB A Cdc14 Cdc25 MPF

17
P Wee1 P Cdc25 CycB P Cdc20 Cdh1 CKI CycB CKI CycA APC-P APC TFB I TFB A TFE A TFE I CycE TFI A TFI I Cdc20 Cdc14 CycA CycB CycD Cdh1 CycD Cdc25 SPF

18
primed RC fired RC primed MEN fired MEN Cdk1 CycB high MPF low MPF high SPF low SPF Cdk2 CycA Cell Cycle Regulation

19
Cdk2 CycA Licensing Factor Replication Complex time Csikasz-Nagy & Novak, 2005 SPF Cock-and-Fire

20
Cdk1 CycB Primer Mitotic Exit Network time Csikasz-Nagy & Novak, 2005 MPF

21
P Cdc25 Wee1 P Cdc25 CycB P Cdc20 Cdh1 CKI CycB CKI CycA APC-P APC TFB I TFB A CycE CycD TFE A TFE I Cyc E,A,B CycE TFI A TFI I Cdc20 CKI CycE Cdc14 CycA CycB CycD Cdh1 CycD mass/nucleus Fission Yeast bistable switch neg fdbk osc

22
P Cdc25 Wee1 P Cdc25 CycB P Cdc20 Cdh1 CKI CycB CKI CycA APC-P APC TFB I TFB A CycE CycD TFE A TFE I Cyc E,A,B CycE TFI A TFI I Cdc20 CKI CycE Cdc14 CycA CycB CycD Cdh1 CycD G1 M S/G2 M mass/nucleus M Fission Yeast

23
012345 0 0.4 0.8 3.0 mass/nucleus Cdk1:CycB G1 S/G2 M Wild type SNIC

24
SNIC Bifurcation Invariant Circle Limit Cycle x2x2 p1p1 node saddle Saddle-Node on an Invariant Circle max min max SNIC

25
012345 0 0.4 0.8 3.0 mass/nucleus Cdk1:CycB G1 S/G2 M Wild type cell division G1 S/G2 enter M exit M

26
Genetic control of cell size at cell division in yeast Paul Nurse Department of Zoology, West Mains Road, Edinburgh EH9 3JT, UK Nature, Vol, 256, No. 5518, pp. 547-551, August 14, 1975 wild-type wee1

27
P Cdc25 Wee1 P Cdc25 CycB P Cdc20 Cdh1 CKI CycB CKI CycA APC-P APC TFB I TFB A CycE CycD TFE A TFE I Cyc E,A,B CycE TFI A TFI I Cdc20 CKI CycE Cdc14 CycA CycB CycD Cdh1 CycD

28
wee1 mass/nucleus Cdk1:CycB G1 S/G2 M wee1 cells are about one-half the size of wild type

29
Two-parameter Bifurcation Diagram cell mass (au.) Wee1 activity wild-type B SN2 SN1 wee1 - <30 60 90 120 150 180 210 240 270 300 period (min) 300< HB1 2 x wee1 + Genetics Physiology wee1 +/-
 Wee1 activity wild-type B SN2 SN1 wee1 - < period (min) 300< HB1 2 x wee1 + Genetics Physiology wee1 +/-")
30
??
31
Tyson, Chen & Novak, Network dynamics and cell physiology, Nature Rev. Molec. Cell Biol. 2:908 (2001). Tyson, Csikasz-Nagy & Novak, The dynamics of cell cycle regulation, BioEssays 24:1095 (2002). Tyson, Chen & Novak, Sniffers, buzzers, toggles and blinkers, Curr. Opin. Cell Biol. 15:221 (2003). Csikasz-Nagy et al., Analysis of a generic model of eukaryotic cell-cycle regulation, Biophys. J. 90:4361 (2006). References
. Tyson, Csikasz-Nagy & Novak, The dynamics of cell cycle regulation, BioEssays 24:1095 (2002). Tyson, Chen & Novak, Sniffers, buzzers, toggles and blinkers, Curr. Opin. Cell Biol. 15:221 (2003). Csikasz-Nagy et al., Analysis of a generic model of eukaryotic cell-cycle regulation, Biophys. J. 90:4361 (2006). References.")
Similar presentations


