Download presentation
Presentation is loading. Please wait.

1
City Statistics Illustrated
Gorja BARTSCH Eurostat E4 Regional statistics and geographical information

4
Objectives Increase the visibility and use of European statistics on cities Present the latest Urban Audit data in a visual, more user-friendly way Enable easy comparisons of cities Thus implementing the Eurostat strategy to complement exisiting publications with interactive, web-based tools

5
Main features Data for 941 core cities (EU28, TR, NO, CH)
20 indicators based on relevance/availability Data refer to 2012 or the latest available year (back to 2008) Search function for city names
 Search function for city names.")
6
Indicators pre-selected
Population on 1 January (T/M/F) Population change over 1 year (%) Women per 100 men Young-age dependency ratio (%) Old-age dependency ratio (%) Age dependency ratio (%) Nationals as proportion of population (%) Foreigners as proportion of population (%) EU foreigners as proportion of population (%) Non-EU foreigners as proportion of population (%)
 Population change over 1 year (%) Women per 100 men Young-age dependency ratio (%) Old-age dependency ratio (%) Age dependency ratio (%) Nationals as proportion of population (%) Foreigners as proportion of population (%) EU foreigners as proportion of population (%) Non-EU foreigners as proportion of population (%)")
7
Indicators pre-selected (2)
Crude birth rate (per 1000 inhabitants) Crude death rate (per 1000 inhabitants) Infant mortality rate (per 1000 live births) Average size of households Proportion of households that are 1-person households (%) Students in higher education (ISCED level 5-6), total Unemployment rate (M/T/F) (%) Activity rate (M/T/F) (%) Number of registered cars (per 1000 population) People killed in road accidents (per population)
 Crude death rate (per 1000 inhabitants) Infant mortality rate (per 1000 live births) Average size of households Proportion of households that are 1-person households (%) Students in higher education (ISCED level 5-6), total Unemployment rate (M/T/F) (%) Activity rate (M/T/F) (%) Number of registered cars (per 1000 population) People killed in road accidents (per population)")
8
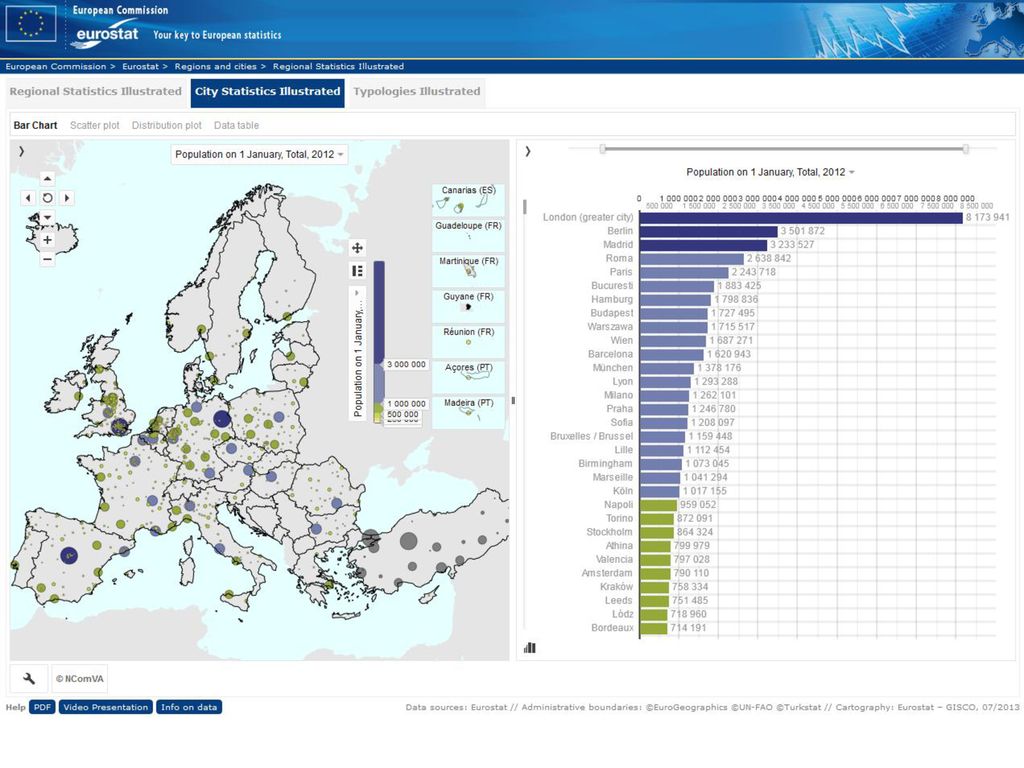
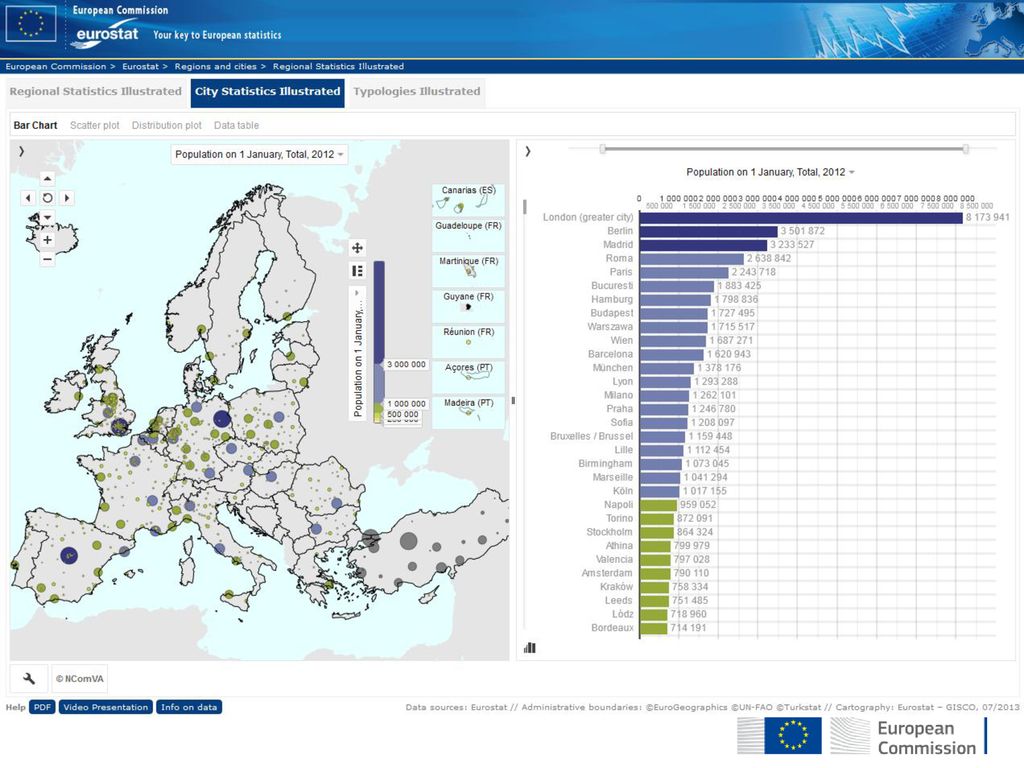
Interactive visualisations

9
Fixed size of circles based on population
<= – – – – > Colour legend to show the values (6 classes)
")
10
Mouse-over to display the exact value

12
Selection of cities per country

13
Bar chart

14
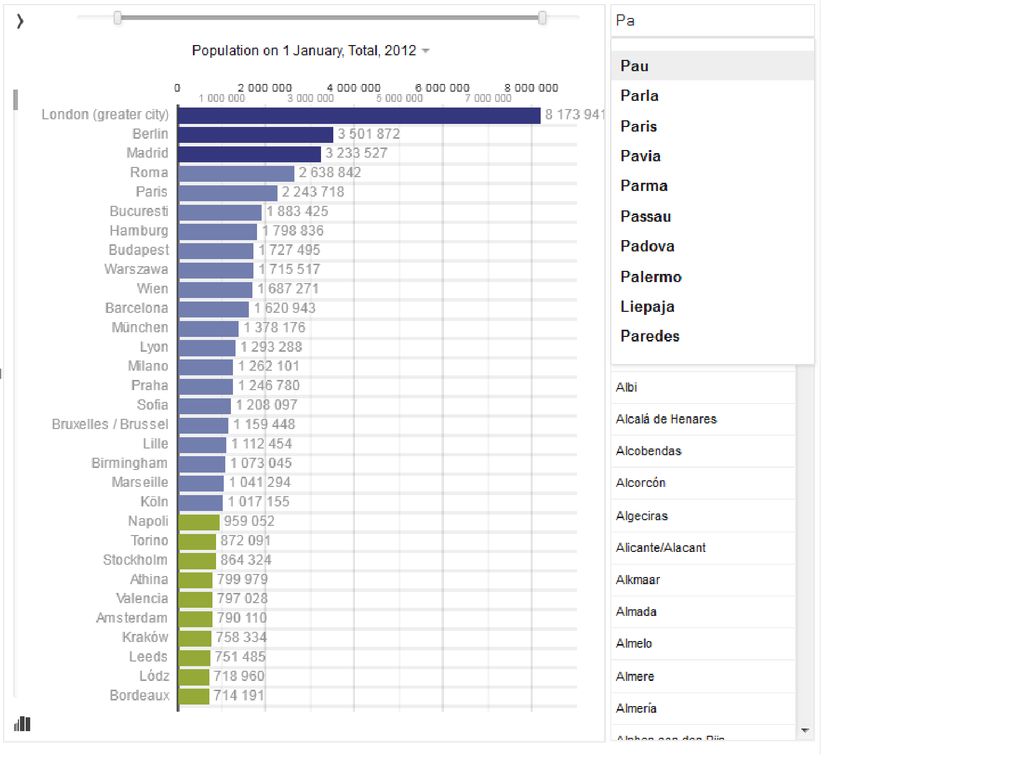
Search function

16
Compare selected cities with Ctrl key

17
Advanced functions to compare different indicators

18
Scatter plot

19
Zoom in and display city names

20
Distribution plot

21
Data table

22
Search function

23
Pivot function

25
Next steps Looking forward to YOUR feedback!
Final testing and bug-fixing Go live by end of June Presentation at the European Week of Regions and Cities in Brussels (October) Data updates every 6 months Integration of additional indicators and/or time series based on availability
 Data updates every 6 months. Integration of additional indicators and/or time series based on availability.")
26
Points for Discussion Your experiences with similar tools
Feedback on the features and visualisations Use of static data: right approach to cope with gaps regarding coverage/timeliness?

Similar presentations


>")

 Age structure: 0-14 years: 17.6% (male 2,992,811/female 2,848,388) 15-64 years: 69% (male 11,482,452/female.>")

