Download presentation
Presentation is loading. Please wait.

1
Using Gender Statistics: a toolkit for training data users Overview Jessica Gardner UNECE Consultant jessica@stats2info.com

2
About the toolkit PurposeSupport statistical systems to increase understanding and use of gender statistics Target audiences Gender statistics units and focal points in national statistical offices Those training government officials and development practitioners in using statistics ContentsSix modules: Background on relevance of gender Description of key indicators One or two training activities per module

3
Process to date First draft prepared July- August 2015 Testing in Moldova September -October 2015 Regional Workshop November 2015 Testing in Armenia November 2015 Finalization

4
1. Basic skills in statistics 4. Education and training 2. Population 5. Health 6. Power and decision- making 3. Work and economic activity Six modules

6
Statistics New Zealand Audience Model Public Professional Technical Size of audience Amount and complexity of data Sources: http://www.stats.govt.nz/Census/2013-census/info-about-the-census/products-services-mix.aspxhttp://www.stats.govt.nz/Census/2013-census/info-about-the-census/products-services-mix.aspx www.unece.org/stats/documents/ece/ces/ge.22/2010/zip.52.e.pdf

7
Module 1: Basic skills in statistics a)Framework for developing ability to use statistics b)Key statistical concepts Indicator Concept Population Variable c)Overview of gender statistics d)Summary of available resources Gender Statistics Manuals (UNECE; UNSD) Indicators of Gender Equality (UNECE) Technical guidelines
Framework for developing ability to use statistics b)Key statistical concepts Indicator Concept Population Variable c)Overview of gender statistics d)Summary of available resources Gender Statistics Manuals (UNECE; UNSD) Indicators of Gender Equality (UNECE) Technical guidelines")
8
1. Basic skills in statistics 4. Education and training 2. Population 5. Health 6. Power and decision- making 3. Work and economic activity Six modules

9
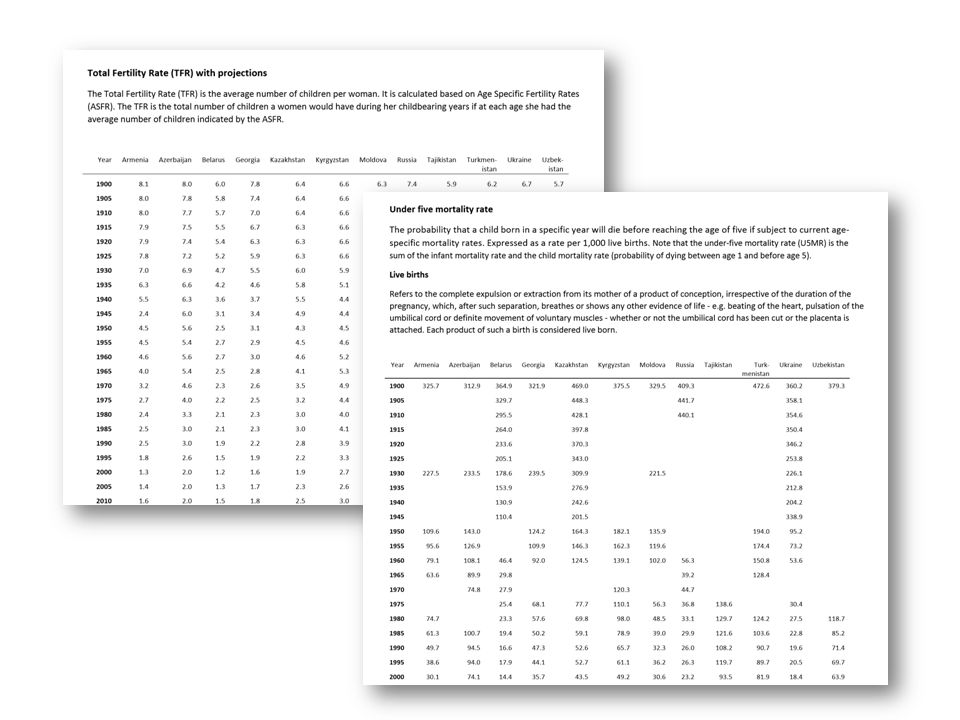
Module 2: Measuring the population a)Importance of demographic indicators for gender analysis b)Main data sources c)Indicators Sex ratio for total population Infant mortality Mean age at first marriage Total fertility rate Basic overview of each indicator How to calculate Data sources Standard definitions
Importance of demographic indicators for gender analysis b)Main data sources c)Indicators Sex ratio for total population Infant mortality Mean age at first marriage Total fertility rate Basic overview of each indicator How to calculate Data sources Standard definitions")
10
Tips on what to look out for when using this indicator Practical examples from the region

11
Help users understand what it means What to do about it

12
Practical activity

14
1. Basic skills in statistics 4. Education and training 2. Population 5. Health 6. Power and decision- making 3. Work and economic activity Six modules

15
What is the added value of this toolkit? Draws on existing resources Presents from a user perspective Steps through what they need to know Guide to interpretation Connection to policy issues Latest data and information Regional examples Practical activities Basis to construct own training

16
Indicators included in the toolkit: Why this selection? ModuleIndicators covered 2. PopulationSex ratio for total population Infant mortality Mean age at first marriage Total fertility rate 3. Work and economic activityInactivity rate Employment rate Status in employment Hourly gender pay gap Proportion of employed working part-time Unemployment rate 4. Education and trainingTertiary gross enrolment ratio Upper secondary gross enrolment ratio Distribution of 25-64 year olds by highest level of education attainment Young people not in employment and not in education or training 5. HealthHealthy life years at birth Causes of death Adolescent fertility rate 6. Power and decision-makingFemale legislators, senior officials and managers Women’s share of members of national parliaments Women’s share of senior civil servant positions

17
Work in progress Regional workshop to gather comments and ideas Testing in Moldova and Armenia Looking forward to your valuable feedback!

18
Skills for understanding statistics 1.Data awareness 2.Ability to understand statistical concepts 3.Ability to analyse, interpret and evaluate statistical information 4.Ability to communicate statistical information

19
Key statistical concepts in a user-friendly manner

20
Session outline 1.Indicators, variables and populations 2.Proportions and percentages 3.Ratios 4.Rates 5.Practical activity

21
Skills for understanding statistics 1.Data awareness 2.Ability to understand statistical concepts 3.Ability to analyse, interpret and evaluate statistical information and 4.Ability to communicate statistical information

22
2, 2.5, 3, 3.5, 4

23
Statistical terms DefinitionExamples ConceptA statistical concept is a characteristic of a time series or an observation. For example, ‘unemployment’, ‘birth’, and ‘tertiary enrolment’ are all concepts. To be measured accurately and consistently, concepts must have clear definitions. Unemployment Live births Children Marriage VariableA variable is a characteristic of a unit being observed that may assume more than one of a set of values to which a numerical measure or a category from a classification can be assigned Income Age Weight Occupation Industry Cause of death PopulationThe set of elements about which information is wanted and estimates are required total number of people in a country or town Youth (aged 15-24) married/partnered women aged 15-49 IndicatorAn indicator is a measure that signals the state or level of something. It represents statistical data for a specified time, place, and other characteristics. Indicators combine concepts, variables and populations to create a particular measure. Total Fertility Rate (average number of children per woman) Percentage of government budget spent on education Hourly gender pay gap Share of women in national parliament
 married/partnered women aged IndicatorAn indicator is a measure that signals the state or level of something. It represents statistical data for a specified time, place, and other characteristics. Indicators combine concepts, variables and populations to create a particular measure. Total Fertility Rate (average number of children per woman) Percentage of government budget spent on education Hourly gender pay gap Share of women in national parliament.")
24
Gender indicators - identify Proportion of women/men aged 15‐49 years, subjected to psychological violence in the past 12 months by the intimate partner Average hours spent in own‐use production work, by sex Employment rate of 25‐64 year‐olds, by sector of the economy and sex Share of females among graduates in science, engineering, manufacturing and construction Concept(s) Variable(s) Population(s) ?
 Variable(s) Population(s)")
Similar presentations


>")


