Download presentation
Presentation is loading. Please wait.

3
WEATHER & CLIMATE WEEK Instructor: Matt Letts (matthew.letts@uleth.ca, UHall C850) Office Hours: Tuesday 13h30 – 15h00 INTRODUCTION TO GEOGRAPHY SESSION GOALS: Geography majors Learn about the fundamentals of meteorology to prepare you for Weather & Climate 2015 Non Geography majors Understand the atmosphere around you and interpret a surface weather map
 Office Hours: Tuesday 13h30 – 15h00 INTRODUCTION TO GEOGRAPHY SESSION GOALS: Geography majors Learn about the fundamentals of meteorology to prepare you for Weather & Climate 2015 Non Geography majors Understand the atmosphere around you and interpret a surface weather map")
4
WEATHER & CLIMATE WEEK CONTENTS 1.Our Energy Source - The Sun - Radiation Emission - What Causes Seasons? - Earths Radiation Balance 2. Weather vs. Climate - Weather & Climate Defined (p. 233) - Why Study Weather? 3. Atmospheric Circulation - Air Pressure is Everywhere (p. 271-273) - Forces Acting to Create Wind (p. 274-281) - Global Atmospheric Circulation (p. 281-290)
 - Why Study Weather. 3. Atmospheric Circulation - Air Pressure is Everywhere (p ) - Forces Acting to Create Wind (p ) - Global Atmospheric Circulation (p ).")
5
WEATHER & CLIMATE WEEK CONTENTS 4.The Importance of Water Vapour - Specific & Relative Humidity - Vapour Pressure 5. Instability and Cloud Formation - Causes of Instability (p. 238) - Causes of Precipitation (p. 237-243) 6. Analysis of Surface Weather Maps - Understanding Weather Symbols (p. 244) - The Mid-latitude Cyclone (p. 243-256) Optional Reading: http://www.physicalgeography.net/fundamentals/chapter7.html
 - Causes of Precipitation (p ) 6. Analysis of Surface Weather Maps - Understanding Weather Symbols (p. 244) - The Mid-latitude Cyclone (p ) Optional Reading:")
8
Stefan-Boltzmann Law As the temperature of an object increases, more radiation is emitted each second Energy emitted = (T 0 ) 4
 4")
9
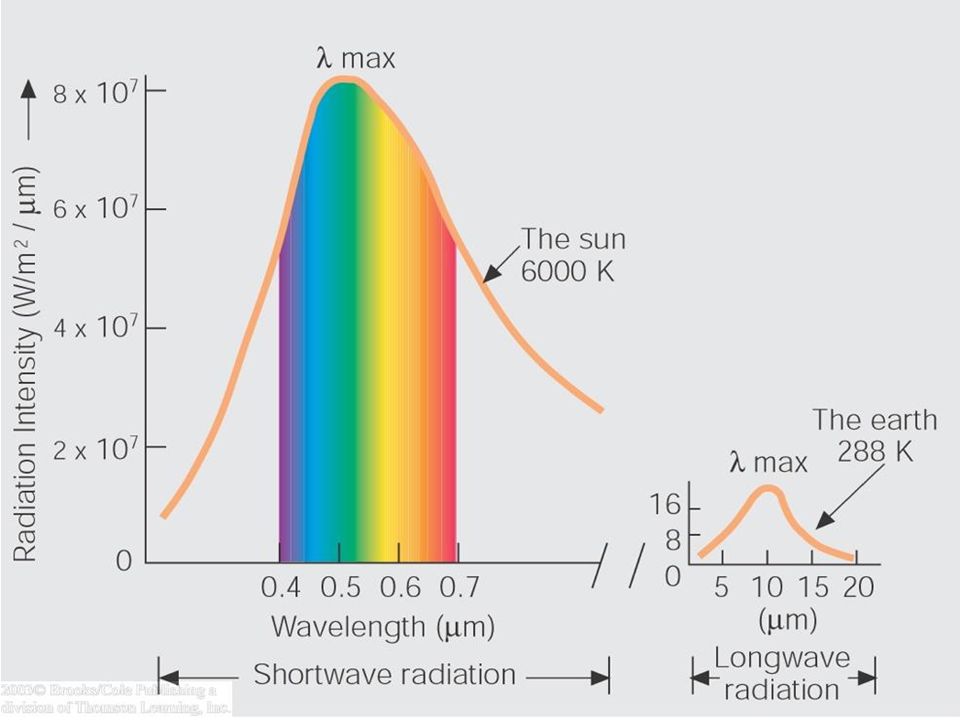
Wiens Displacement Law As the temperature of a body increases, so does the proportion of shorter wavelengths

13
See: http://weather.msfc.nasa.gov/cgi-bin/post-goes

14
Day and Night (09h00 MDT, Oct 23, 2006) http://www.fourmilab.ch/cgi-bin/uncgi/Earth/action?opt=-p
 opt=-p")
19
Source: NOAA ABSORPTION K TO SPACE=31 L <K !! Heat transfer 7+24=31 ! Compensates for radiation imbalance at surface L 46+19+4=69 L TO SPACE=69 100 46-15=31 100-31-69=0

20
White snow0.80-0.95 Old snow0.40-0.60 Vegetation0.15-0.30 Light colour soil0.25-0.40 Dark colour soil0.10 Clouds0.50-0.90 Calm water 0.10 (midday)
")
23
7.5 cm Air Temperature ( C) Aug 18Aug 19Aug 21Aug 22, 2005Aug 20 7.5 cm Air Temperatures at Lakeview Ridge, WLNP
 Aug 18Aug 19Aug 21Aug 22, 2005Aug cm Air Temperatures at Lakeview Ridge, WLNP")
28
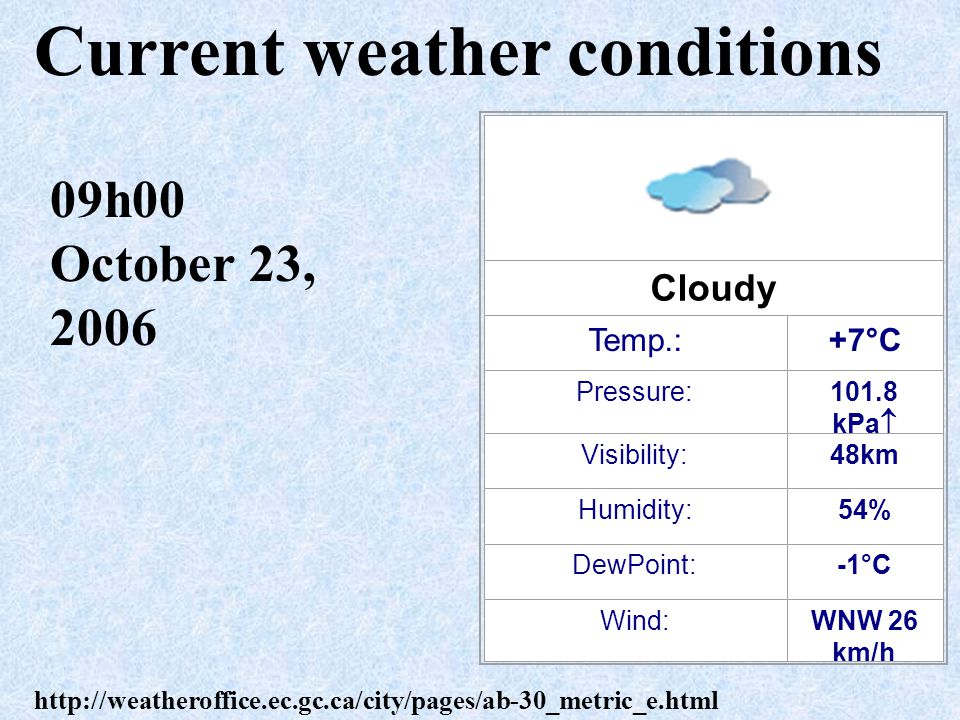
Current weather conditions Cloudy Temp.:+7°C Pressure:101.8 kPa Visibility:48km Humidity:54% DewPoint:-1°C Wind:WNW 26 km/h 09h00 October 23, 2006 http://weatheroffice.ec.gc.ca/city/pages/ab-30_metric_e.html

29
Thermometer (thermister) held within a Gill Radiation Shield SENSIBLE HEAT Radiation Sensors (PAR and K ) Raingauge Datalogger
 held within a Gill Radiation Shield SENSIBLE HEAT Radiation Sensors (PAR and K ) Raingauge Datalogger")
32
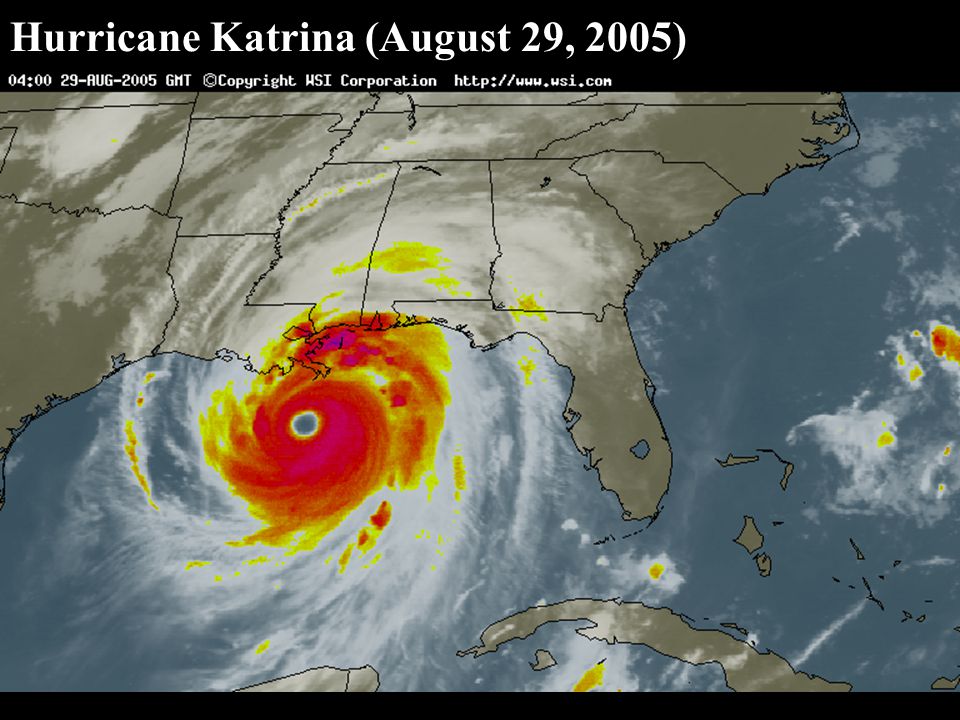
Hurricane Katrina (August 29, 2005)
")
34
Lethbridge, Alberta

37
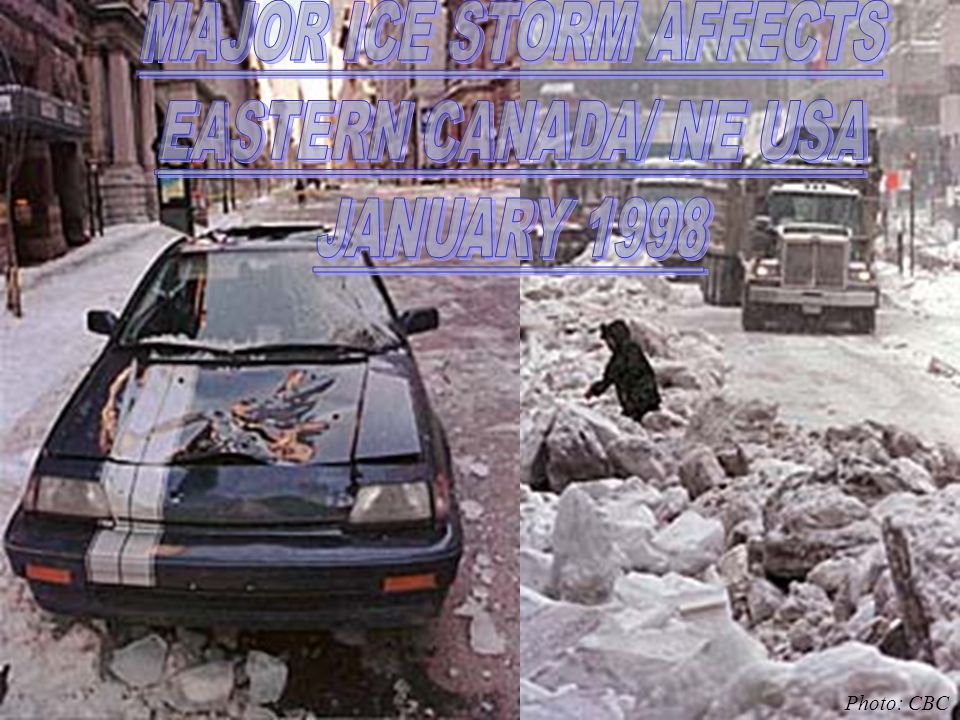
Photo: CBC

40
Photos: National Snow and Ice Data Center 1928 19792000

41
Upsala Glacier, Argentina

42
Source: IPCC

43
WeatherClimate a) air temperature Long term averages b) atmospheric pressure of weather (eg. 30 y) c) humidity d) clouds Means e) precipitation Extremes f) visibilityVariability g) wind
 c) humidity d) clouds Means e) precipitation Extremes f) visibilityVariability g) wind.")
44
LETHBRIDGE, ABVANCOUVER, BC

46
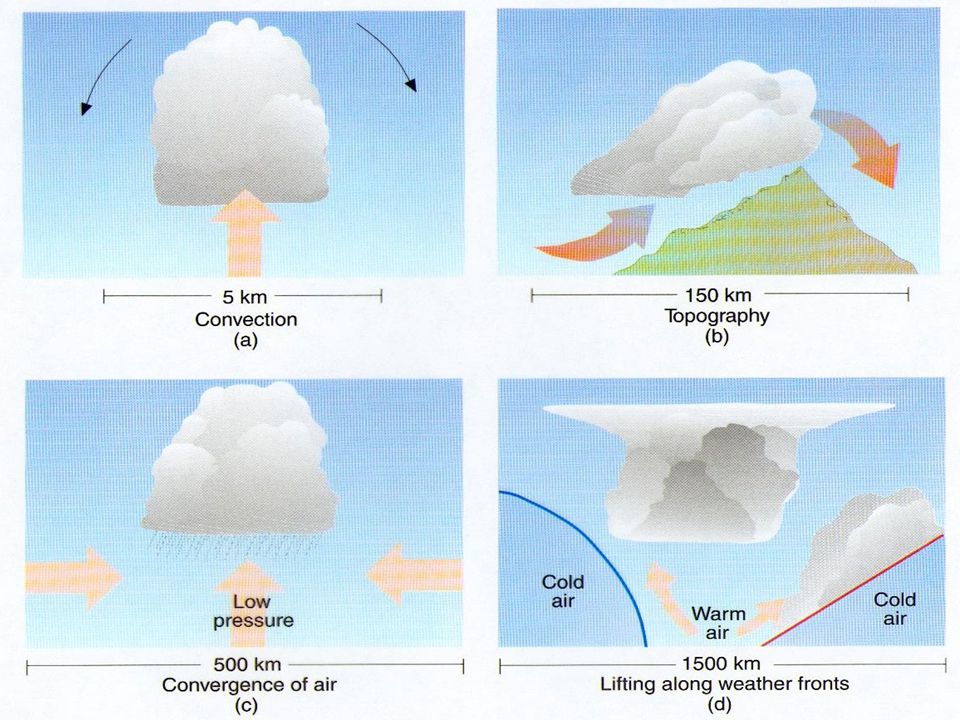
Source: Ahrens (1994)
")
48
Source: Solomon, 2000

50
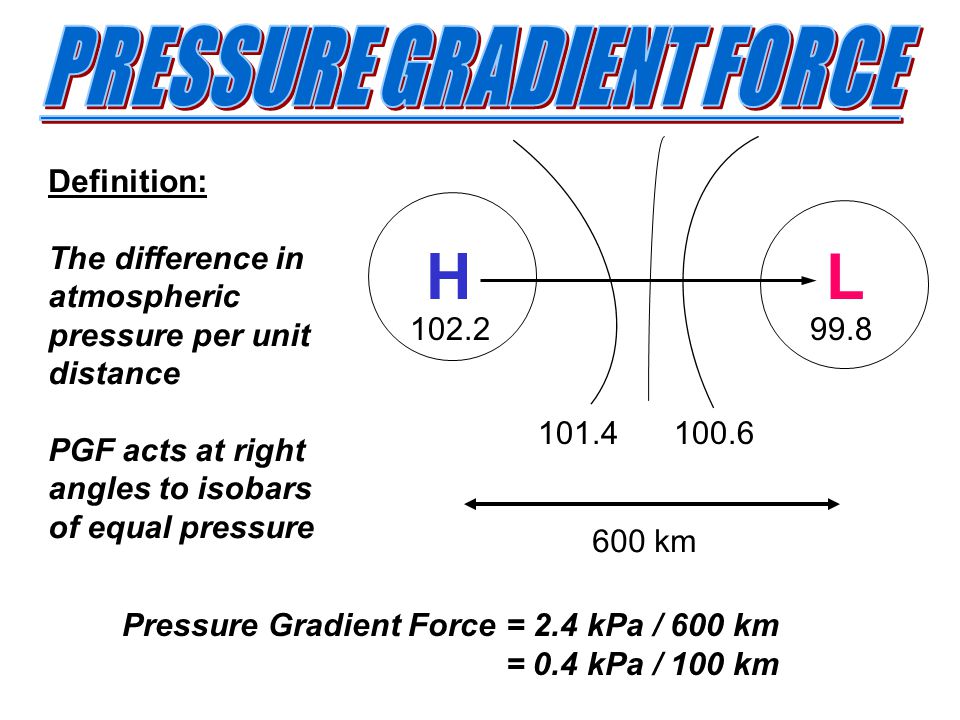
HL 102.299.8 101.4100.6 600 km Pressure Gradient Force= 2.4 kPa / 600 km = 0.4 kPa / 100 km Definition: The difference in atmospheric pressure per unit distance PGF acts at right angles to isobars of equal pressure

52
Dont try this at home

53
Where are winds strongest ? Oct 18, 2004 Solution: HUDSON BAY Check the spacing of the isobars of equal surface pressure

54
Source: NASA

55
Surface roughness decreases wind speed Reduces impact of Inertial Coriolis Force Winds cross isobars, spiralling out of ANTICYCLONES (H), and into CYCLONES (L) H L
, and into CYCLONES (L) H L")
56
weather.unisys.com

58
H L Air tends to be unstable in low pressure (tendency to rise) Air tends to be stable in high pressure (tendency to fall)
 Air tends to be stable in high pressure (tendency to fall)")
61
1.Equatorial Low Pressure Trough 2.Subtropical High Pressure Cells 3.Subpolar Low Pressure Cells 4.Weak Polar High Pressure Cells

65
A ratio that compares the amount of water vapour in the air to the maximum water vapour capacity at that temperature The relative humidity of saturated air is 100% RH = [H 2 0 vapour content/H 2 0 capacity] x 100
![A ratio that compares the amount of water vapour in the air to the maximum water vapour capacity at that temperature The relative humidity of saturated air is 100% RH = [H 2 0 vapour content/H 2 0 capacity] x 100](http://images.slideplayer.com/4/1447381/slides/slide_65.jpg "A ratio that compares the amount of water vapour in the air to the maximum water vapour capacity at that temperature The relative humidity of saturated air is 100% RH = [H 2 0 vapour content/H 2 0 capacity] x 100")
66
The portion of atmospheric pressure that is made up of water vapour molecules (mb or kPa) SATURATION VAPOUR PRESSURE: The pressure that water vapour molecules would exert if the air were saturated (at a given temperature)
 SATURATION VAPOUR PRESSURE: The pressure that water vapour molecules would exert if the air were saturated (at a given temperature)")
71
Absolute stability Temperature decreases with altitude more slowly than MALR (ELR > -6 C/km)
")
75
Temperature decreases with altitude more quickly than the DALR (ELR < -10 C /km)
")
77
VANCOUVERLETHBRIDGE 8°C8°C 12°C X X Cooling At MALR 6°C/km Warming At DALR 10 °C/km Cooling At DALR 10 °C/km Cooling At MALR 6°C/km Warming At DALR 10 °C/km More sensible heat

80
Cold advection Radiational cooling of clouds Solar heating of Earths surface Warm air advection at surface Air moving over a warm surface

91
See weather.unisys.com

94
SHARP COLD FRONT WARM, MOIST SOUTHERLY FLOW NORTH- EAST WINDS www.atmos.washington.edu 0600h GMT APRIL 5 2003

95
GROWING DEGREE DAYS CORN HEAT UNITS Cumulative index of daily T avg < 18 C Cumulative index of daily T avg > 18 C Cumulative index of daily T avg > 4 C Cumulative index of daily T avg > 10 C

Similar presentations


 Results in conduction, convection and long-wave emission 2.Transmission (transmissivity=>")


