Download presentation
Presentation is loading. Please wait.

1
“Analyses of Pre-therapy Peripheral Immunoscore and Response to
Vaccine Therapy,” by Farsaci et al. SUPPLEMENTARY FILES Materials and Methods: Custom software for the calculation of the peripheral immunoscore Supplementary Figure S1: Gating strategy to identify classic peripheral immune cell types and refined immune cell subsets with phenotypes reflecting immune function that were used to generate the peripheral immunoscores of patients treated with docetaxel plus or minus PANVAC. Supplementary Figure S2: Gating strategy to identify classic peripheral immune cell types and refined immune cell subsets with phenotypes reflecting immune function that were used to generate the peripheral immunoscores of patients treated with Quadramet plus or minus PROSTVAC. Supplementary Figure S3: Point assignment method used in generating peripheral immunoscores. Supplementary Table S1: Antibodies and panels used in flow cytometry analysis to identify immune cells. Supplementary Table S2: PBMC frequencies (min, median, max) and bin cutoffs used in generating peripheral immunoscores in breast cancer patients treated with docetaxel +/- PANVAC vaccine and prostate cancer patients treated with Sm-153 (Quadramet) +/- PROSTVAC vaccine. Supplementary Table S3: Summation of points assigned to individual subsets to generate peripheral immunoscore.
 and bin cutoffs used in generating peripheral immunoscores in breast cancer patients treated with docetaxel +/- PANVAC vaccine and prostate cancer patients treated with Sm-153 (Quadramet) +/- PROSTVAC vaccine. Supplementary Table S3: Summation of points assigned to individual subsets to generate peripheral immunoscore.")
2
Supplementary Figure S1
lympho mono CTLA-4+ CD8 PD-1+ CD8 Tim-3+ CD8 2B4+ CD8 CM CD8 CD8+ T cells CTLA-4+ CD4 PD-1+ CD4 Tim-3+ CD4 2B4+ CD4 CD4+ T cells CM CD4 B lympho mono CD4+ T cells CD25+ Treg CD49d- Treg C CD3-CD16- CD19-CD20-CD56- MDSC Lin- MDSC lympho mono NK CD56brCD16- NK Legend follows

3
Supplementary Figure S1: Gating strategy to identify classic peripheral immune cell types and refined immune cell subsets with phenotypes reflecting immune function that were used to generate the peripheral immunoscores of patients treated with docetaxel plus or minus PANVAC. One vial of frozen peripheral blood mononuclear cells (PBMC) per subject was thawed and then stained in 3 flow cytometry panels using antibodies indicated in Supplementary Table 1. Panel 1 (A) identified parental cell types of CD4+ and CD8+ T cells as well as markers involved in maturation (CCR7, CD45RA), and suppressive function (CTLA4, PD-1, Tim-3, 2B4). Panel 2 (B) identified the parental cell type of Tregs as well as CD49d- Tregs. Panel 3 (C) identified the parental cell types of MDSCs and NK cells, as well as Lin- MDSC (CD14-CD15-) and immature NK cells (CD56brCD16-). Samples were collected on an LSR II flow cytometer equipped with UV, red, blue, and violet lasers, and analyzed using FlowJo with gating set using fluorescence minus one controls.
 per subject was thawed and then stained in 3 flow cytometry panels using antibodies indicated in Supplementary Table 1. Panel 1 (A) identified parental cell types of CD4+ and CD8+ T cells as well as markers involved in maturation (CCR7, CD45RA), and suppressive function (CTLA4, PD-1, Tim-3, 2B4). Panel 2 (B) identified the parental cell type of Tregs as well as CD49d- Tregs. Panel 3 (C) identified the parental cell types of MDSCs and NK cells, as well as Lin- MDSC (CD14-CD15-) and immature NK cells (CD56brCD16-). Samples were collected on an LSR II flow cytometer equipped with UV, red, blue, and violet lasers, and analyzed using FlowJo with gating set using fluorescence minus one controls..")
4
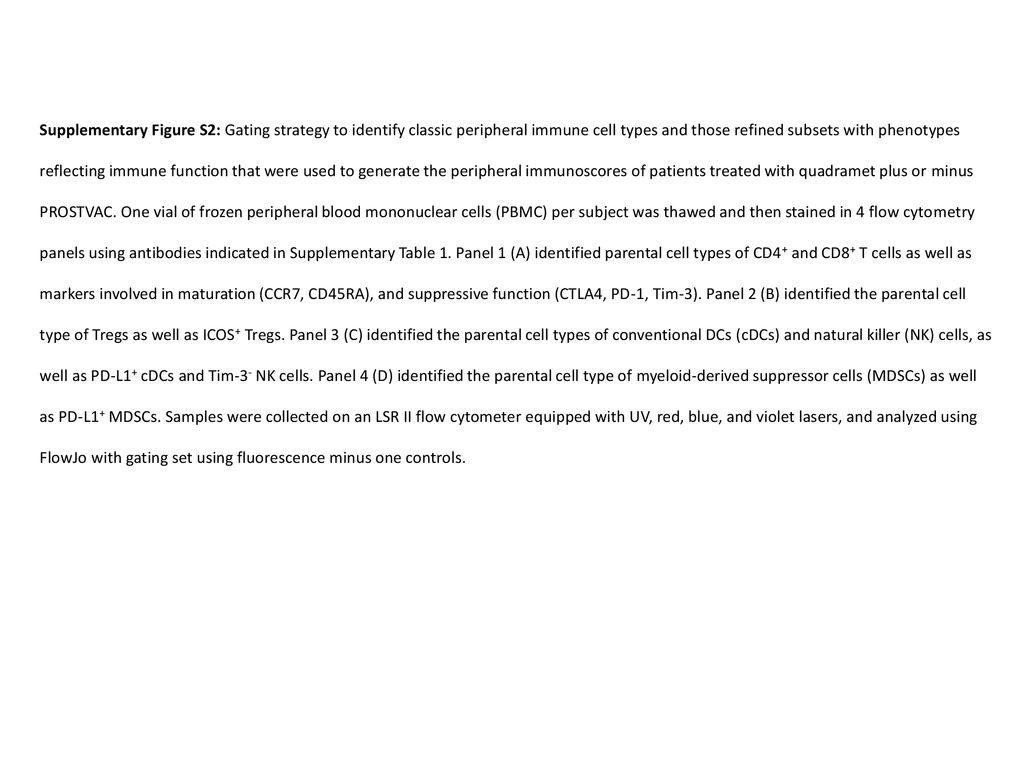
Supplementary Figure S2
CTLA-4+ CD8 PD-1+ CD8 Tim-3+ CD8 CM CD8 lympho mono CD8+ T cells CTLA-4+ CD4 PD-1+ CD4 Tim-3+ CD4 CD4+ T cells CM CD4 B CD25+ ICSO+ Treg CD4+ T cells Treg lympho mono C Non-lympho mono CD3-CD16- CD56- PD-L1+ cDC cDC lympho mono NK Tim3+ NK D PD-L1+ MDSC MDSC CD11b+ Legend follows

5
Supplementary Figure S2: Gating strategy to identify classic peripheral immune cell types and those refined subsets with phenotypes reflecting immune function that were used to generate the peripheral immunoscores of patients treated with quadramet plus or minus PROSTVAC. One vial of frozen peripheral blood mononuclear cells (PBMC) per subject was thawed and then stained in 4 flow cytometry panels using antibodies indicated in Supplementary Table 1. Panel 1 (A) identified parental cell types of CD4+ and CD8+ T cells as well as markers involved in maturation (CCR7, CD45RA), and suppressive function (CTLA4, PD-1, Tim-3). Panel 2 (B) identified the parental cell type of Tregs as well as ICOS+ Tregs. Panel 3 (C) identified the parental cell types of conventional DCs (cDCs) and natural killer (NK) cells, as well as PD-L1+ cDCs and Tim-3- NK cells. Panel 4 (D) identified the parental cell type of myeloid-derived suppressor cells (MDSCs) as well as PD-L1+ MDSCs. Samples were collected on an LSR II flow cytometer equipped with UV, red, blue, and violet lasers, and analyzed using FlowJo with gating set using fluorescence minus one controls.
6
Supplementary Figure S3
C B D Legend follows

7
Supplementary Figure S3: Point assignment method used in generating peripheral immunoscores. The distribution of predetermined classic peripheral blood mononuclear cell (PBMC) immune cell types at baseline, indicated as a percentage of total PBMC, were divided in mathematical tertile bins: low frequency, middle frequency, and high frequency bins. Points were assigned to each classic PBMC immune cell type based on the tertile distribution. If a classic PBMC immune cell type (e.g., CD4) was expected to positively correlate with progression-free survival (PFS), zero (0) points were assigned to the low bin, one (1) point for the middle bin, and two (2) points if in the high bin. If a subset (e.g., Treg) was expected to negatively correlate with PFS, zero (0) points were assigned to the high bin, one (1) point if in the middle bin, and two (2) points if in the low bin. CD4 (A) and Treg (B) in patients with breast cancer treated with docetaxel +/- PANVAC vaccine. CD4 (C) and Treg (D) in prostate cancer treated with Sm-153 (Quadramet) +/- PROSTVAC.
 immune cell types at baseline, indicated as a percentage of total PBMC, were divided in mathematical tertile bins: low frequency, middle frequency, and high frequency bins. Points were assigned to each classic PBMC immune cell type based on the tertile distribution. If a classic PBMC immune cell type (e.g., CD4) was expected to positively correlate with progression-free survival (PFS), zero (0) points were assigned to the low bin, one (1) point for the middle bin, and two (2) points if in the high bin. If a subset (e.g., Treg) was expected to negatively correlate with PFS, zero (0) points were assigned to the high bin, one (1) point if in the middle bin, and two (2) points if in the low bin. CD4 (A) and Treg (B) in patients with breast cancer treated with docetaxel +/- PANVAC vaccine. CD4 (C) and Treg (D) in prostate cancer treated with Sm-153 (Quadramet) +/- PROSTVAC..")
8
Docetaxel +/- PANVAC vaccine Quadramet +/- PROSTVAC vaccine
Supplementary Table S1: Antibodies and panels used in flow cytometry analysis to identify classic and refined immune cell types Docetaxel +/- PANVAC vaccine Quadramet +/- PROSTVAC vaccine Panel 1: T lymphocytes Panel 2: Tregs Panel 3: MDSC & NK NK & DC Panel 4: MDSC CD4 – AF700 RPA-T4 Biolegend CD3 – V500 UCHT1 BD Biosciences CD4 – BV605 CD3 – APC-Cy7 CD33 – APC WM53 CD8 – PE-Cy7 RPA-T8 CD25 – APC M-A251 CD56 – PE-Cy7 MEM-188 CD8 – APC CD56 – APC HLA-DR – BV605 L243 CD45RA – FITC HI100 FoxP3 – PE-Cy7 PCH101 eBioscience CD16 – PerCP-Cy5.5 3G8 CD45RA – AF700 H100 FoxP3 – Pacific Blue 206D CD16 – FITC CD11b – APC-Cy7 ICRF44 CCR7 – APC-Cy7 G043H7 CD127 – FITC A019D5 CD19 – FITC HIB19 CCR7 – PerCP-Cy5.5 150503 CD127 – APC-eF780 eBioRDR5 CD11c – BV605 3.9 PDL1 – PE-Cy7 MIH1 CTLA4 – PE* L3D10 CD49d – PerCP-Cy5.5 9F10 CD20 – FITC 2H7 CTLA4 – FITC ICOS – PerCP-Cy5.5 C398.4A CD303 – PerCP-Cy5.5 201A PD-1 – PerCP-Cy5.5 EH12 CD33 – AF700 PD-1 – PE MIH4 Tim-3 – BV421 F38-2E2 2B4 – APC Jan-65 CD14 – APC-Cy7 MφP9 CD15 – Pacific Blue W6D3 Clones and company are listed under each antibody. Intracellular antibodies are underlined. *Stained both extra- and intracellular. Tregs, T regulatory lymphocytes; MDSC, myeloid-derived suppressor cells; NK, natural killer cells; DC, dendritic cells.

9
Supplementary Table S2 A B C D
Criterion 1: Docetaxel +/- PANVAC Subset (% of PBMC) CD4 CD8 NK Treg MDSC Ratio CD4:Treg Ratio CD8:Treg Ratio CD4:MDSC Ratio CD8:MDSC min 3.48 3.49 2.91 0.31 0.18 8.85 3.41 1.88 1.85 median 27.13 15.71 9.40 0.85 1.21 31.92 19.88 22.44 11.43 max 52.40 40.45 57.60 2.17 7.13 150.89 90.09 243.15 202.25 Cutoffs for Low Bin ≤ 22.97 ≤ 12.86 ≤ 7.22 ≥ 0.972 ≥ 2.00 ≤ 23.99 ≤ 14.65 ≤ 11.88 ≤ 5.34 Cutoffs for Mid Bin >22.97, <31.02 >12.86, <20.12 >7.22, <11.60 >0.676, <0.972 >0.707, <2.00 >23.99, <41.54 >14.65, <24.36 >11.88, <40.30 >5.34, <21.92 Cutoffs for High Bin ≥ 31.02 ≥ 20.12 ≥ 11.60 ≤ 0.676 ≤ 0.707 ≥ 41.54 ≥ 24.36 ≥ 40.30 ≥ 21.92 B Criterion 2: Docetaxel +/- PANVAC Subset (% of PBMC) CD4 central memory CD8 central memory CD4 ≥2 suppressive markers CD8 ≥2 suppressive markers Treg CD49d- Lin- MDSC NK CD56hi CD16- Ratio CM CD4:Treg CD49d- Ratio CM CD8:Treg CD49d- Ratio CM CD4:Lin- MDSC Ratio CM CD8:Lin- MDSC Ratio CD4 CM:NK CD56br CD16- Ratio CD8 CM:NK CD56br CD16- min 0.300 0.000 0.008 0.009 0.298 0.059 0.023 0.920 0.850 0.890 median 2.500 0.031 0.074 0.797 0.322 0.389 3.160 0.350 7.760 0.690 5.130 0.530 max 9.600 1.900 0.401 1.644 1.989 2.105 1.580 12.840 3.360 8.990 39.130 Cutoffs for Low Bin ≤ 1.9 ≤ 0.100 ≥ 0.062 ≥ 0.252 ≥ 0.932 ≥ 0.427 ≥ 0.561 ≤ 1.99 ≤ 0.17 ≤ 4.82 ≤ 0.38 ≤ 2.91 ≤ 0.39 Cutoffs for Mid Bin >1.900, <3.000 >0.100, <0.500 >0.0230, <0.062 >0.048, <0.252 >0.652, <0.932 >0.189, <0.427 >0.250, <0.561 >1.990, <4.100 >0.170, <0.520 >4.820, <11.380 >0.380, <2.080 >2.910, <10.540 >0.390, <2.000 Cutoffs for High Bin ≥ 3.000 ≥ 0.5 ≤ 0.023 ≤ 0.048 ≤ 0.652 ≤ 0.189 ≤ 0.250 ≥ 4.100 ≥ 0.520 ≥ ≥ 2.08 ≥ 10.54 ≥ 2 C Criterion 1: Quadramet +/- PROSTVAC Subset (% of PBMC) CD4 Ratio CD4:MDSC Ratio CD4:Treg CD8 Ratio CD8:MDSC Ratio CD8:Treg MDSC NK Treg min 12.04 0.83 4.04 8.71 0.99 2.79 1.75 5.56 0.78 median 26.39 4.75 10.73 22.79 3.34 8.35 5.91 10.64 2.45 max 53.01 26.94 17.49 42.32 19.87 54.11 20.48 20.45 4.96 Cutoffs for Low Bin ≤ 23.67 ≤ 2.53 ≤ 9.36 ≤ 17.88 ≤ 2.87 ≤ 6.38 ≥ 10.19 ≤ 8.70 ≥ 3.03 Cutoffs for Mid Bin >23.67, <30.01 >2.53, <5.78 >9.36, <12.64 >17.88, <26.19 >2.87, <5.51 >6.38, <12.41 >4.06, <10.19 >8.70, <12.54 >2.12, <3.03 Cutoffs for High Bin ≥ 30.01 ≥ 5.78 ≥ 12.64 ≥ 26.19 ≥ 5.51 ≥ 12.41 ≤ 4.06 ≥ 12.54 ≤ 2.12 D Criterion 2: Quadramet +/- PROSTVAC Subset (% of PBMC) Central Memory CD4 Ratio Central Memory CD4 CM:Treg ICOS+ CD4 expressing ≥2 suppressive markers Central Memory CD8 Ratio Central Memory CD8: Treg ICOS+ CD8 expressing ≥2 suppressive markers cDC PDL1+ MDSC PDL1+ NK TIM3- Treg ICOS+ min 2.51 0.0371 0.68 0.0297 median 0.51 0.0729 2.43 max 0.282 5.6271 10.2 0.142 7.0376 Cutoffs for Low Bin ≤ 0.445 ≤ 0.37 ≥ 0.107 ≤ 2.095 ≤ 1.71 ≥ 0.077 ≥ 0.118 ≥ 2.775 ≥ ≥ 1.525 Cutoffs for Mid Bin >0.445, <0.975 >0.37, <0.79 >0.067, <0.107 >2.095, <3.738 >1.71, <3.59 >0.052, <0.077 >0.025, <0.118 >0.897, <2.775 >6.535, <10.606 >0.976, <1.525 Cutoffs for High Bin ≥ 0.975 ≥ 0.79 ≤ 0.067 ≥ 3.738 ≥ 3.59 ≤ 0.052 ≤ 0.025 ≤ 0.897 ≤ 6.535 ≤ 0.976 Peripheral blood mononuclear cell (PBMC) frequencies (min, median, max) and bin cutoffs used in generating peripheral immunoscores in breast cancer patients treated with docetaxel +/- PANVAC vaccine (A, B), and prostate cancer patients treated with Sm-153 (Quadramet) +/- PROSTVAC vaccine (C, D). As bins were determined using tertiles within each of the patient populations, the cutoffs for a given immune cell type assessed in the breast and prostate cancer trials differed.
 CD4. CD8. NK. Treg. MDSC. Ratio CD4:Treg. Ratio CD8:Treg. Ratio CD4:MDSC. Ratio CD8:MDSC. min median max Cutoffs for Low Bin. ≤ ≤ ≤ ≥ ≥ ≤ ≤ ≤ ≤ Cutoffs for Mid Bin. >22.97, < >12.86, < >7.22, < >0.676, < >0.707, <2.00. >23.99, < >14.65, < >11.88, < >5.34, < Cutoffs for High Bin. ≥ ≥ ≥ ≤ ≤ ≥ ≥ ≥ ≥ B. Criterion 2: Docetaxel +/- PANVAC. Subset (% of PBMC) CD4 central memory. CD8 central memory. CD4 ≥2 suppressive markers. CD8 ≥2 suppressive markers. Treg CD49d- Lin- MDSC. NK CD56hi CD16- Ratio CM CD4:Treg CD49d- Ratio CM CD8:Treg CD49d- Ratio CM CD4:Lin- MDSC. Ratio CM CD8:Lin- MDSC. Ratio CD4 CM:NK CD56br CD16- Ratio CD8 CM:NK CD56br CD16- min median max Cutoffs for Low Bin. ≤ 1.9. ≤ ≥ ≥ ≥ ≥ ≥ ≤ ≤ ≤ ≤ ≤ ≤ Cutoffs for Mid Bin. >1.900, < >0.100, < >0.0230, < >0.048, < >0.652, < >0.189, < >0.250, < >1.990, < >0.170, < >4.820, < >0.380, < >2.910, < >0.390, < Cutoffs for High Bin. ≥ ≥ 0.5. ≤ ≤ ≤ ≤ ≤ ≥ ≥ ≥ ≥ ≥ ≥ 2. C. Criterion 1: Quadramet +/- PROSTVAC. Subset (% of PBMC) CD4. Ratio CD4:MDSC. Ratio CD4:Treg. CD8. Ratio CD8:MDSC. Ratio CD8:Treg. MDSC. NK. Treg. min median max Cutoffs for Low Bin. ≤ ≤ ≤ ≤ ≤ ≤ ≥ ≤ ≥ Cutoffs for Mid Bin. >23.67, < >2.53, <5.78. >9.36, < >17.88, < >2.87, <5.51. >6.38, < >4.06, < >8.70, < >2.12, <3.03. Cutoffs for High Bin. ≥ ≥ ≥ ≥ ≥ ≥ ≤ ≥ ≤ D. Criterion 2: Quadramet +/- PROSTVAC. Subset (% of PBMC) Central Memory CD4. Ratio Central Memory CD4 CM:Treg ICOS+ CD4 expressing ≥2 suppressive markers. Central Memory CD8. Ratio Central Memory CD8: Treg ICOS+ CD8 expressing ≥2 suppressive markers. cDC PDL1+ MDSC PDL1+ NK TIM3- Treg ICOS+ min median max Cutoffs for Low Bin. ≤ ≤ ≥ ≤ ≤ ≥ ≥ ≥ ≥ ≥ Cutoffs for Mid Bin. >0.445, < >0.37, <0.79. >0.067, < >2.095, < >1.71, <3.59. >0.052, < >0.025, < >0.897, < >6.535, < >0.976, < Cutoffs for High Bin. ≥ ≥ ≤ ≥ ≥ ≤ ≤ ≤ ≤ ≤ Peripheral blood mononuclear cell (PBMC) frequencies (min, median, max) and bin cutoffs used in generating peripheral immunoscores in breast cancer patients treated with docetaxel +/- PANVAC vaccine (A, B), and prostate cancer patients treated with Sm-153 (Quadramet) +/- PROSTVAC vaccine (C, D). As bins were determined using tertiles within each of the patient populations, the cutoffs for a given immune cell type assessed in the breast and prostate cancer trials differed.")
10
Supplementary Table S3 Points assigned to a given patient for each immune cell type included within the peripheral immunoscore TOTAL Score PT CD4 CD8 NK Treg MDSC Ratio eff CD4:Treg Ratio CD8:Treg Ratio CD4:MDSC Ratio CD8:MDSC 1 5 3 2 11 6 7 9 10 14 16 12 18 4 19 22 23 8 25 201 203 204 207 210 214 216 17 218 219 221 Summation of points assigned to individual subsets to generate peripheral immunoscore. The peripheral immunoscore for a given patient was the sum of points assigned to the individual peripheral blood mononuclear cell (PBMC) immune cell types that were included in a specific criterion used to build the immunoscore. Representative example of summation of points (Criterion 1) in breast cancer patients treated with Docetaxel + PANVAC vaccine.
 immune cell types that were included in a specific criterion used to build the immunoscore. Representative example of summation of points (Criterion 1) in breast cancer patients treated with Docetaxel + PANVAC vaccine.")
Similar presentations


>")
 enhances CD8 activation and decreases CD4 to a greater extent than commercially available anti-PD-L1 blocking.>")


