Download presentation
Presentation is loading. Please wait.

1
Exhibit 9.01

2
Exhibit 9.02

3
Exhibit 9.03

4
Exhibit 9.04

5
Exhibit 9.05

6
Exhibit 9.06

7
Exhibit 9.07

8
Exhibit 9.08

9
Exhibit 9.09

10
Exhibit 9.10

11
Exhibit 9.11

12
Exhibit 9.12

13
Exhibit 9.13

14
Exhibit 9.14

15
Exhibit 9.15

16
Exhibit 9.16

17
Exhibit 9.17

18
Exhibit 9.18

19
Exhibit 9.19

20
Exhibit 9.20

21
Exhibit 9.21

22
Exhibit 9.22

23
Exhibit 9.23

24
Exhibit 9.24

25
Exhibit 9.25

26
Exhibit 9.26

27
Exhibit 9.27

28
Exhibit 9.28

29
Exhibit 9.29

30
Exhibit 9.30

31
Exhibit 9.31

32
Exhibit 9.32

33
Exhibit 9.33

34
Exhibit 9.34

35
Exhibit 9.35

36
Exhibit 9.36

37
Exhibit 9.37 Mean: 110.00 MMDth Median: 110.02 MMDth Base Case: 109.15 MMDth

38
Exhibit 9.38

39
Exhibit 9.39

40
Exhibit 9.40

41
Exhibit 9.41

42
Exhibit 9.42

43
Exhibit 9.43

44
Exhibit 9.44

45
Exhibit 9.45

46
Exhibit 9.46

47
Exhibit 9.47

48
Exhibit 9.48

49
Exhibit 9.49

50
Exhibit 9.50 Mean: 5557.62 HDD Median: 5557.96 HDD Base Case: 5437.44 HDD

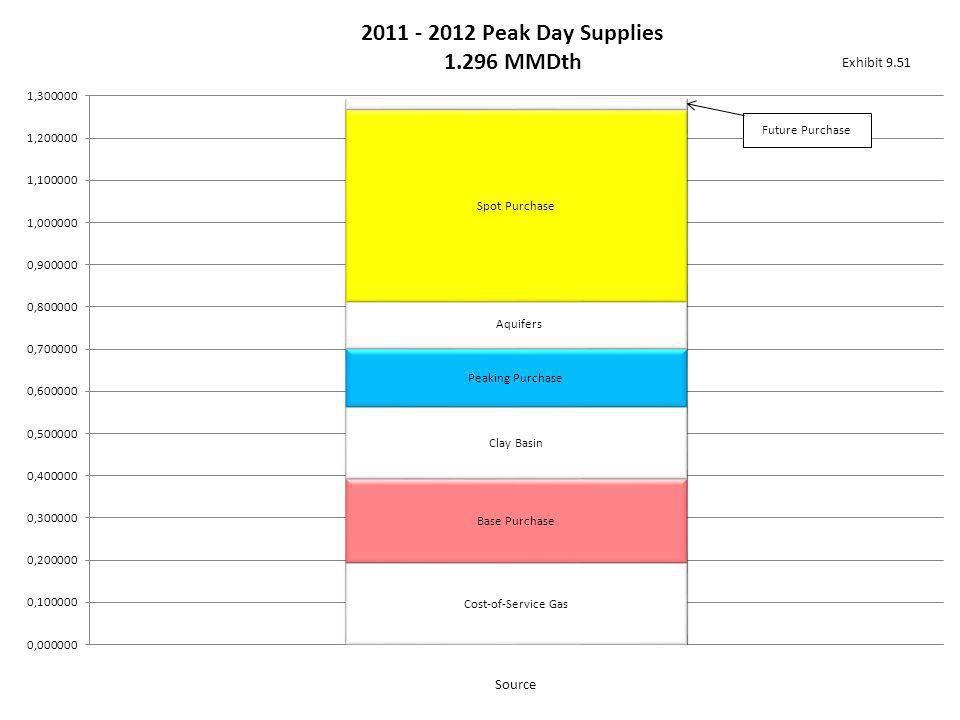
52
Exhibit 9.52 Mean: 0.91 MMDth Median: 0.90 MMDth Base Case: 0.95 MMDth

53
Exhibit 9.53

54
Exhibit 9.54

55
Exhibit 9.55

56
Exhibit 9.56

57
Exhibit 9.57

58
Exhibit 9.58

59
Exhibit 9.59

60
Exhibit 9.60

61
Exhibit 9.61

62
Exhibit 9.62

63
Exhibit 9.63

64
Exhibit 9.64

65
Exhibit 9.65 Mean: 45.71 MMDth Median: 45.69 MMDth Base Case: 45.25 MMDth

66
Monthly Gas Purchase Distribution 2011 Plan Year Scenario 1010 : 1198 Draws yearmonthmeanmaxp95p90medp10p5min 201160.412.051.100.910.250.15 201170.291.400.790.640.16 201180.230.670.420.370.190.16 201190.612.851.581.320.450.15 2011102.786.795.284.933.120.170.16 2011115.368.697.677.336.092.382.232.06 2011128.7913.6510.6310.519.196.706.425.63 2012110.1116.4912.6711.8210.31 8.14 7.605.31 201227.5911.499.749.447.885.334.612.68 201235.619.557.697.265.853.402.621.72 201243.429.336.756.123.470.540.390.15 201250.513.092.071.640.170.16 Exhibit 9.66

67
Exhibit 9.67

68
Exhibit 9.68

69
Exhibit 9.69

70
Exhibit 9.70

71
Exhibit 9.71

72
Exhibit 9.72

73
Exhibit 9.73

74
Exhibit 9.74

75
Exhibit 9.75

76
Exhibit 9.76

77
Exhibit 9.77

78
Exhibit 9.78

79
Exhibit 9.79 Mean: 70.03 MMDth Median: 70.06 MMDth Base Case: 70.13 MMDth

80
Monthly Cost-of-Service Gas Distribution 2011 Plan Year Scenario 1010 : 1198 Draws yearmonthmeanmaxp95p90medp10p5min 201165.365.37 5.36 4.89 201175.435.45 5.445.425.334.96 201185.295.485.375.355.285.235.225.02 201195.615.885.87 5.695.285.105.01 2011105.905.92 5.905.785.45 2011116.166.21 6.206.015.885.76 2011126.006.02 5.935.905.15 201216.026.03 5.995.60 201226.186.19 6.155.76 201236.116.12 6.096.065.76 201246.026.04 6.026.016.005.60 201255.965.98 5.975.965.855.55 Exhibit 9.80

81
Exhibit 9.81 Mean: 650.297 Million Dollars Median: 648.884 Million Dollars Base Case: 634.864 Million Dollars

82
Exhibit 9.82 Mean: 11.05 Billion Dollars Median: 11.05 Billion Dollars Base Case: 11.03 Billion Dollars

83
DemandSupply v. Requirements AreaClassJun-11Jul-11Aug-11Sep-11Oct-11Nov-11Dec-11Jan-12Feb-12Mar-12Apr-12May-12Total Ut KRGTGS_COM6.34.53.64.15.710.119.827.722.120.314.88.0147.0 Ut KRGTGS_RES9.29.69.513.419.232.651.562.846.937.026.812.7331.2 Ut KRGTL_and_U0.1 0.20.30.40.3 0.20.12.1 UT NPCGS_COM5.74.13.33.75.29.217.925.220.118.513.47.3133.6 UT NPCGS_RES8.48.78.612.217.529.746.857.142.733.724.311.6301.1 UT NPCL_and_U0.1 0.20.30.40.30.2 0.11.9 Ut/IdFS_COM374.4339.2293.5342.5372.4433.3546.9606.4495.1495.0443.9348.15090.4 Ut/IdFS_IND211.4199.5173.5188.8192.9228.4262.1306.6254.2253.7242.2189.12702.2 Ut/IdGS_COM1050.3748.4609.4722.61071.31980.84013.15692.44525.54072.62881.41463.028830.7 Ut/IdGS_RES1538.41607.81583.72343.63616.66419.210455.212913.99588.47454.05230.02317.465068.1 Ut/IdIS_COM51.341.430.533.735.360.891.8103.283.986.173.856.2747.9 Ut/IdIS_ELC2.720.10.02.00.20.10.0 25.0 Ut/IdIS_IND159.9229.4100.0155.0132.2147.6140.495.693.9111.0137.4130.01632.3 Ut/IdL_and_U14.613.712.016.323.440.066.985.064.853.838.819.4448.7 Wy QGCFS_COM14.110.2 13.815.119.928.232.025.524.821.514.0229.2 Wy QGCFS_IND1.31.51.2 1.61.71.61.4 1.316.7 Wy QGCGS_COM50.426.420.830.443.295.9186.5238.7182.3178.3131.868.01252.7 Wy QGCGS_RES46.029.529.489.8104.9196.3288.0342.1276.6218.1161.073.91855.6 Wy QGCIS_COM7.94.82.42.82.95.510.313.512.212.112.47.393.9 Wy QGCIS_IND6.18.83.05.23.95.35.24.12.94.54.73.156.9 Wy QGCL_and_U0.50.40.30.60.71.42.22.72.21.91.40.715.1 Wy WamGS_COM3.02.71.5 2.44.89.512.79.38.96.43.466.1 Wy WamGS_RES2.52.6 4.46.09.714.718.214.210.87.83.797.1 Wy WamL_and_U0.0 0.1 0.00.7 3564.43312.92898.93987.95672.59732.416259.320642.215764.913096.89475.64738.3109145.9 Off-System Demand 99102.3 99102.379.3134.18102.395.7102.399102.31120.0 Fuel Transport 330.9326.4312.2338.8352.1391.0452.7490.8487.8423.0370.1362.94638.6 Fuel Inject 28.940.539.137.537.642.58.70.0 39.119.3293.3 Fuel Withdrawal 0.30.70.0 8.598.442.825.90.00.2176.8 360.1367.7351.3376.3389.7433.4469.9589.2530.6448.9409.3382.45108.7 InjectAquifer 0.0 100.6318.4739.942.40.0 1201.3 InjectClay Basin 1640.82300.92222.81937.91803.21646.2465.20.0 2221.71097.315336.1 1640.82300.92222.82038.52121.62386.1507.60.0 2221.71097.316537.4 Total Required 5664.26083.85575.46501.78286.112631.217270.921333.716391.213648.012205.56320.3131912.0 Exhibit 9.89

84
Supply v. Requirements Jun-11Jul-11Aug-11Sep-11Oct-11Nov-11Dec-11Jan-12Feb-12Mar-12Apr-12May-12Total SupplyExisting 150.0155.0 150.0155.0750.0775.0 725.0775.0150.0155.04870.0 SupplyBase 0.0 900.02090.01271.71715.0930.00.0 6906.7 SupplySpot 0.0295.20.0524.82103.51670.31780.65086.4860.23249.04257.07.719834.7 SupplyPeak 0.0 3140.35707.4350.02708.60.01674.155.013635.5 150.0450.2155.0674.82258.56460.610353.17483.06008.74954.06081.1217.745246.8 StorageCompany 5366.25447.25302.95709.15909.46053.26021.86025.96191.26115.36011.15974.470127.5 StorageAquifer 0.0 42.41568.20.0 1610.6 StorageClay Basin 30.667.50.0 737.16140.94076.42464.60.015.713532.8 5396.85514.75302.95709.15909.46053.26801.313735.010267.68579.96011.15990.185270.9 Off-System Produce. 117.43118.96117.54117.82118.13117.45116.6115.75114.92114.09113.26112.451394.4 Total Required 5664.26083.85575.46501.78286.012631.217270.921333.816391.213648.012205.56320.3131912.1 Exhibit 9.90

Similar presentations


 Grants Chapter 6.>")