Download presentation
Presentation is loading. Please wait.

1
Presented by Dr Clare Hourigan University Planning & Statistics, Office of Planning & Quality The use of the general achievement test in student selection at Monash University: A preliminary evaluation

2
The Current Higher Ed Environment 2008 Review of Higher Education –Increase bachelor qualification attainment (40% of 25-34 year olds by 2025) –Increase participation of low SES students (20% of undergrad population by 2020). TEQSA –New round of quality audits are likely to focus on student performance

3
Role of Admission Policies Admission policies will play important role in meeting these challenges. Aim is to grow and diversify without compromising on quality. –Important to continue to select students that are likely to succeed –Must aim for a student population diverse in social background but not academic ability.

4
Use of Year 12 results in selection Year 12 results (ENTER in Vic) current primary tool used for undergrad student selection. Best predictor of university performance that we have but there is room for improvement. -Monash internal analysis shows it can account for 35.4% of variance in first year marks but varies by course/field of education (Hyndman & Akram, 2006)
.")
5
Use of Year 12 results in selection -Reliance on Year 12 results may be part of the reason why low SES students are under- represented at university. -Year 12 completion rates lower (James, Anderson, Bexley, Devlin, Garnett, Marginson & Maxwell, 2008) -and ENTER scores are lower among low SES students (Birrell, Rapson, Dobson, Edwards & Smith, 2002)
 -and ENTER scores are lower among low SES students (Birrell, Rapson, Dobson, Edwards & Smith, 2002).")
6
Use of Year 12 results in selection Why do Low SES students obtain lower year 12 results? –Aspirations/encouragement from peers/family/teachers (James, 2002) –School resources (Edwards, Birrell & Smith, 2005)
 –School resources (Edwards, Birrell & Smith, 2005).")
7
Use of Year 12 results in selection Less prepared for university or do their marks under-reflect their ability/potential? –Study of Monash students found, when ENTER was controlled for, students from non- selective Govt schools performed best (Dobson & Skuja, 2002) Challenge for universities is to compensate for disadvantage to the extent that it has resulted in Year 12 results that under-reflect likelihood of success at uni.
 Challenge for universities is to compensate for disadvantage to the extent that it has resulted in Year 12 results that under-reflect likelihood of success at uni..")
8
Current policies to compensate for disadvantage Special Entry Access Scheme in Vic –Bonus points given to applicants for different equity categories including socio-economic disadvantage. –Systematic approach but qualitative in judgement of extent to which Year 12 results have been affected.

9
Current policies to compensate for disadvantage Under-represented schools –Assumes all students from particular schools were disadvantaged in the same way.

10
-2004 Admissions to Higher Education Review UK -Recommended aptitude tests be considered by universities in student selection to help uncover hidden talent. Aptitude Tests

11
UK recommendation based on pilot of Scholastic Assessment Test (SAT). A levels and SAT both influenced by SES (high SES students do better) but measure different aspects of academic ability because some students do well on one but not the other. Students from schools with lower A levels least likely to score well on both tests (21% compared to 44%). If uni selection used both A levels and SAT results, uni offer rates for students from low attaining schools would double. Aptitude Tests
 but measure different aspects of academic ability because some students do well on one but not the other. Students from schools with lower A levels least likely to score well on both tests (21% compared to 44%). If uni selection used both A levels and SAT results, uni offer rates for students from low attaining schools would double. Aptitude Tests.")
12
Monash started considering using admission tests to enhance selection. –In 2007 trialed the UniTest at Berwick Campus but can be administratively costly and places extra burden on students. –GAT examined because its undertaken by all VCE students Aptitude Tests

13
Monash undertook analysis into predictive validity of the GAT on 1 st year marks. –ENTER is best predictor (35.4% of the variance) –GAT also strong predictor (32.3% of the variance) –Using both GAT and ENTER can improve predictability by 3% and predictive nature of GAT is stronger at lower ENTER ranges. General Achievement Test
 –GAT also strong predictor (32.3% of the variance) –Using both GAT and ENTER can improve predictability by 3% and predictive nature of GAT is stronger at lower ENTER ranges. General Achievement Test.")
14
-In 2008, Monash commenced 3 year pilot to use the GAT in middle band selection of VCE applicants with the aim to: -Differentiate between middle band applicants to select those most likely to succeed -Identify and select students likely to succeed at university but had underperformed in year 12 due to personal circumstances or educational disadvantage Use of GAT in selection at Monash

15
-In 2009, GAT predicted ENTERS (GPENTERS) were used in middle band selection. -Middle Band: Approx 20% of places set aside for assessment on range of extra criteria -Performance in selected VCE subjects -SEAS bonuses -Bonus aggregate points (2 to 9 points) where applicants GPENTER > ENTER Use of GAT in selection at Monash
 where applicants GPENTER > ENTER Use of GAT in selection at Monash.")
16
GAT Preliminary Evaluation Based on students who commenced in 2009 as selection method changed. Did use of the GAT assist in: –selecting applicants likely to succeed who otherwise would not have been selected? –diversifying Monashs commencing student cohort with regards to socio-economic status?

17
Performance of GAT offer students Type of OfferAv. Mark NSig.Progres s Rate NSig GAT based offer (A)60.411882.9121 Standard – app above clearly in (B)67.12733A C91.62754A C Middle band – app below clearly in (C) 61.942487.2428 Range of Critiera/no clearly-in (D)69.8548A B C 95.8551A B C Total66.7382391.43854 First semester average marks and progress rates among domestic VCE school leaver students commencing a bachelors pass degree at Monash University by offer type, 2009
 Standard – app above clearly in (B) A C A C Middle band – app below clearly in (C) Range of Critiera/no clearly-in (D) A B C A B C Total First semester average marks and progress rates among domestic VCE school leaver students commencing a bachelors pass degree at Monash University by offer type,")
18
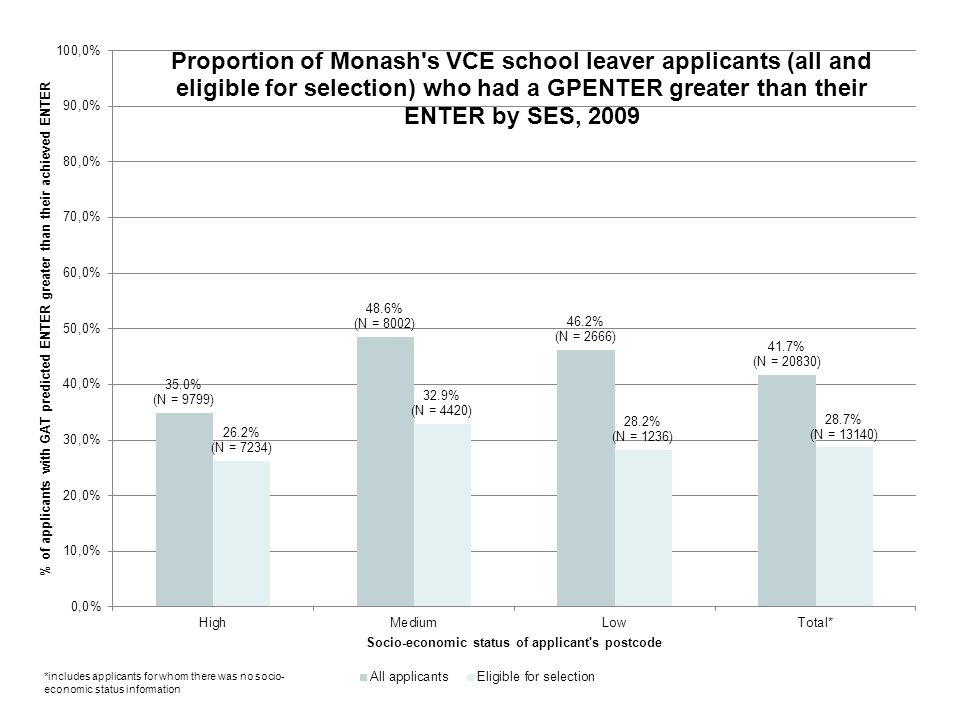
Can GAT mediate for effect of SES on ENTER? Examined relationship between SES and ENTER and SES and GPENTER

21
Can GAT mediate for effect of SES on ENTER? Perhaps differences in ENTER/GPENTER due to true differences in potential to succeed. –If true then uni performance should not differ by SES status when ENTER/GPENTER is controlled for. Used linear regression model to examine relationship between ENTER/GPENTER and SES status and uni performance (first semester marks).
..")
22
Can GAT mediate for effect of SES on ENTER? R Square = 0.21, Standard Error = 11.32 Extent to which year 12 results under-reflect uni performance similar for low and medium SES students Perhaps Year 12 results of high SES students are inflated

23
Can GAT mediate for effect of SES on ENTER? When GPENTER used: variation across SES status was not significant. GPENTER was not particularly strong predictor of uni peformance but less likely to under- reflect likelihood of success of low and medium SES students R Square = 0.08, Standard Error = 12.18

24
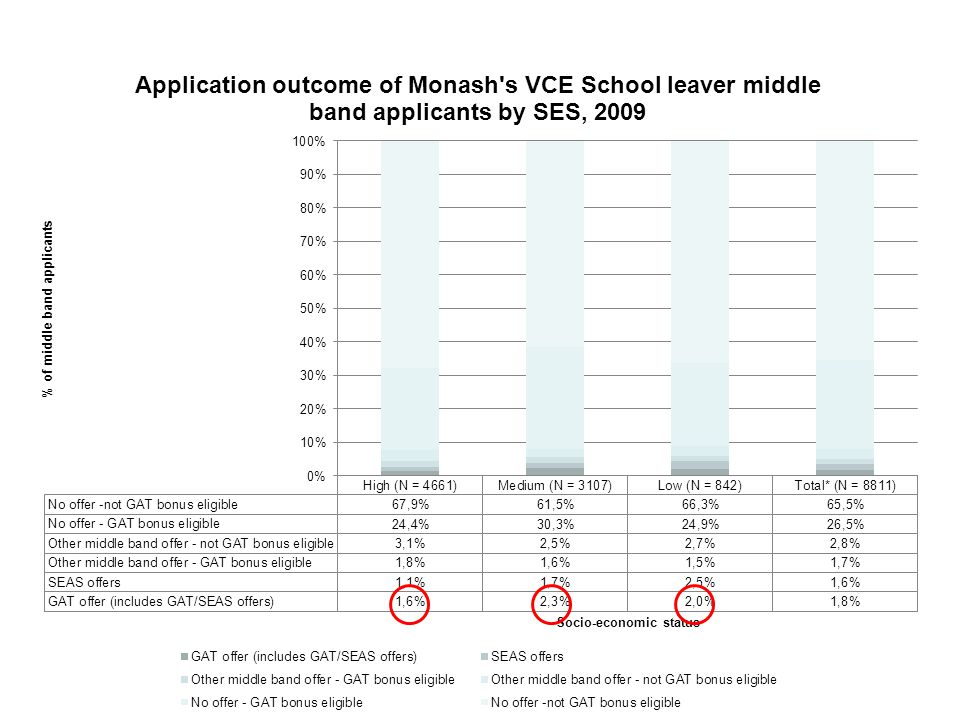
Did the GAT help Monash select more low SES students? 20,830 VCE school leavers applied to Monash in 2009 Examined eligibility for GAT bonus Middle band offer rates by SES status

26
Did the GAT help Monash select more low SES students? Overall, low (and medium) SES students more likely to be qualify for a GAT bonus However, many of the low SES applicants did not meet the eligibility score ruling. Among applicants above eligibility score, qualification for GAT bonus almost same for low and high SES applicants
 SES students more likely to be qualify for a GAT bonus However, many of the low SES applicants did not meet the eligibility score ruling. Among applicants above eligibility score, qualification for GAT bonus almost same for low and high SES applicants.")
28
Did the GAT help Monash select more low SES students? GAT offer rates among middle band applicants were: –Low: 2% –Medium: 2.3% –High: 1.6% GAT did not assist Monash in diversifying the student population with regards to low SES status predominately due to eligibility score ruling.

29
Conclusion Findings are preliminary and we will be monitoring this as the pilot progresses. Results are promising –163 students who would not otherwise have been selected were given an offer –These students performed as well as other middle band students.

30
Conclusion The use of the GAT did not help diversify Monashs student population with regards to SES. This was predominantly due to the eligibility score ruling. Many of the low SES applicants did not meet the eligibility score. –Results may differ for universities with wider range of eligibility scores

Similar presentations