Download presentation
Presentation is loading. Please wait.

1
Submitted October 25, 2010

2
Structural Spending Deficit

3
Our enrollment estimates are several hundred student higher per year than previously estimated The States new Evidence Based Funding Model works against Districts that are on the guarantee (formula doesnt work) The termination of the ARRA funding from the Federal Stimulus Bills Health Care costs continue to rise well above expectations
 The termination of the ARRA funding from the Federal Stimulus Bills Health Care costs continue to rise well above expectations")
4
Structural Operating Deficit

5
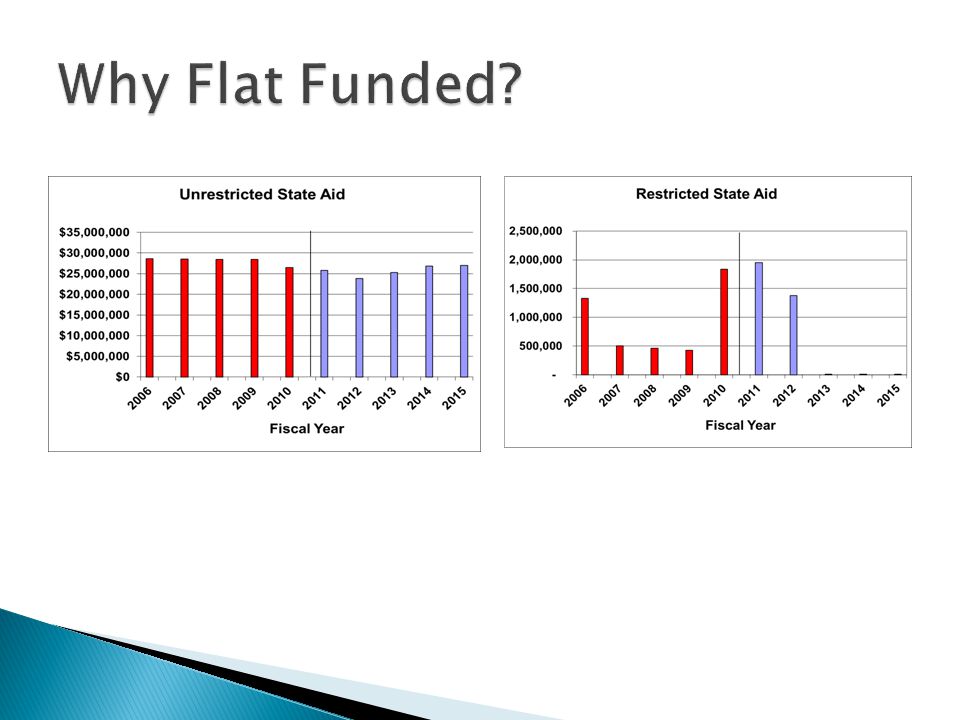
Flat Funding

9
OBMs estimates based on the following assumptions: ADM determined by a three year weighted average Property valuation decreases of.1% and 3.2% for FY2012 and FY2013 Flat funding scenario reduced PPE by $111 and $197 in FY2012 and FY2013 90% funding scenario reduced PPE by $446 and $531 in FY2012 and FY2013 5-year forecast estimates based on the following assumptions: ADM based on district calculations less current community school students of 353 Property valuation increases of.49% and.58% for FY2012 and FY2013 5-year forecast of 95% guarantee and 90% formula funding in FY2012 5-year forecast of 95% guarantee (prior to coming off the formula) and 95% formula funding in FY2013
 and 95% formula funding in FY2013")
12
In 2010 salaries of $1,527,726 were paid using ARRA funds An increase of $675,000 is estimated for 2012 all day kindergarten The implementation of the alternative programs estimated salary increases for 2011 are $209,250 and $450,750 in 2012 Step increases of 2% are factored in annually COLA of 0% are projected through 2015

13
Tuition reimbursement of $75,000 started in 2011 W/C premium increases annually Medical insurance rate increases of 36% September 1, 2009 and 31% September 1, 2010, 15% projected 2011 through 2015 Total salaries and benefits in 2010 of 80.1% and expected to increase to 84.5% in 2015 13

16
Structural Operating Deficit

17
NWLSD -3.46% As of May, 2010, over 450 districts projected their expenditures to exceed their revenue in fiscal year 2011. On average, expenditures exceeded revenue by -5.54% of operating revenue.

18
Total Per Pupil Expenditure Annual Percentage Change Per Pupil

19
The Superintendent and administrative team have begun work in addressing the structural deficit of the district We currently have a plan in place that has budget reductions in place through 2012 fiscal year which are included in this forecast We are reviewing this plan and will make modifications and recommendations to the Board of Education that will address the deficit spending with budget cuts and revenue ideas Without a change in action the district will face an operating deficit in 2013 of $5,741,425 as illustrated below while realizing major educational programing cuts The sooner reductions are made or revenue is increased, the less impact there will be for reducing or eliminating educational programs

Similar presentations