Download presentation
Presentation is loading. Please wait.

1
L. Andrew Bollinger PhD student Section Energy & Industry Faculty of Technology, Policy & Management TU Delft 26 March 2012 SPM 4530 ABM in practice – 2 models

2
Contents 1.A finished model – Metals and mobile phones 1.Problem formulation & actor identification 2.System identification & decomposition … 10.Model use 2.A model in progress – Adaptation of electricity infrastructures to climate change What is the problem? How am I using ABM to address it?

3
A finished model – Metals and mobile phones

4
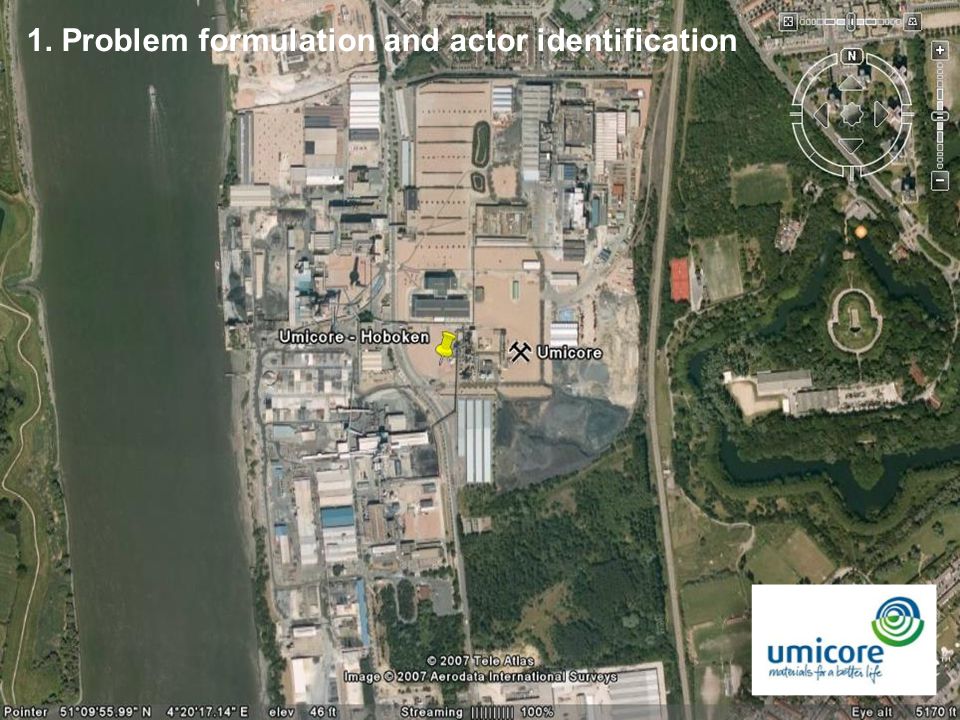
Gold: 0.026-0.033g Silver: 0.11-0.90g Palladium: 0.00-0.09g Copper: 9.30-20.68g In, Ta, Li, Ni, Zn, Sn, Al… 44% hibernating 41% reused 4% disposed 3% recycled Sources: R. Geyer, V.D. Blass, 2009; Nokia, 2008 How can we recover a larger proportion of metals in mobile phones? 1. Problem formulation and actor identification

6
OEMs and suppliers Retailers Consumers 3 rd party collectors Refurbishers Metal recoverers Service providers 2. System identification and decomposition System scope: global flows of metals in mobile phones

7
What are the relevant elements and relationships? 2. System identification and decomposition

9
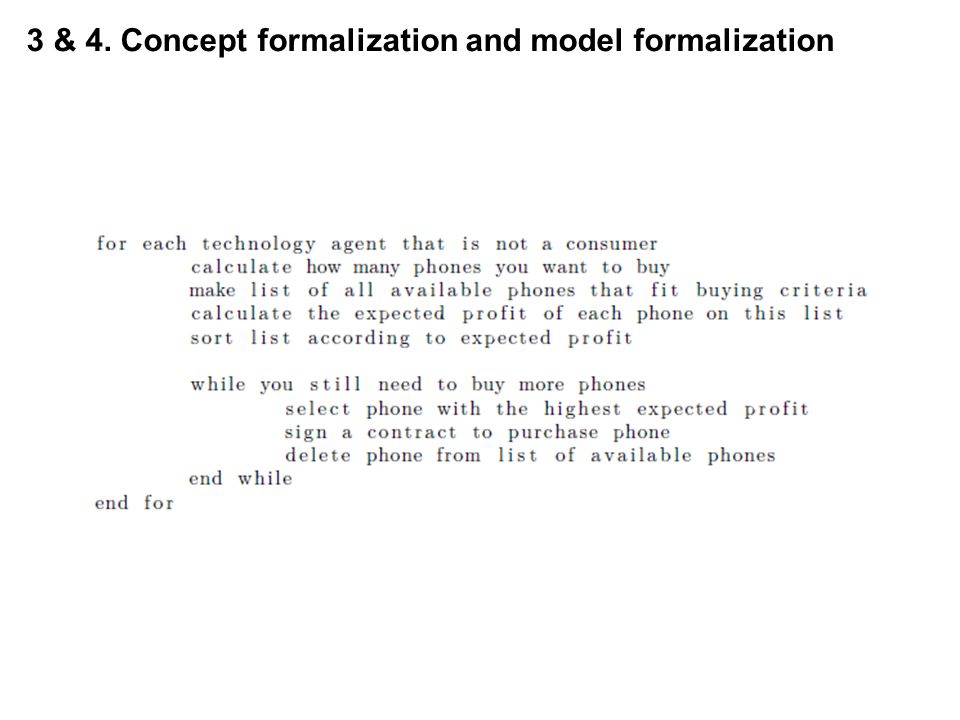
phoneManufactureA phoneManufactureB phoneManufactureC phoneManufactureD phoneRetailNSPCollection phoneRetailNSPCollectionPay usedPhoneRetail newPhoneConsumption newHighEndPhoneConsumption cheapPhoneConsumption cheapHighEndPhoneConsumption usedPhoneConsumption phoneCollection phoneTestingRefurbishingDisassembly industrialMetalRecovery backyardMetalRecovery Complete agent set Decision-making rules Purchasing Processing Investment for… if... then... else... while... Goods Mobile phones Components (batteries, circuit boards, other components) Metals (gold, copper, silver, palladium) 3 & 4. Concept formalization and model formalization
 Metals (gold, copper, silver, palladium) 3 & 4. Concept formalization and model formalization.")
11
private static void pickContractsForThisGoodName(OWLModel owlModel, OWLIndividual buyingAgent, OWLIndividual techInstance, String goodLabelNeeded, double totalNeeded) throws Exception { ArrayList contracts = new ArrayList (); //System.out.println("calculating expected profits"); calculateExpectedProfits(owlModel, buyingAgent, techInstance, goodLabelNeeded); String agentName = AgentWrapper.getLabel(owlModel, buyingAgent); //System.out.println("buyingAgent is " + buyingAgent); String query; query = "SELECT distinct ?physicalFlowContract " + "WHERE { " + //get where this comes from "?physicalFlowContract :from ?from." + //"?from :label ?sellerLabel." + //get the physical flow "?physicalFlowContract :physicalFlow ?physicalFlow." + //get the price "?physicalFlowContract :economicProperties ?econProp." + "?econProp rdf:type :Price." + "?econProp :value ?priceValue." + //get the mass //"?physicalFlow :physicalProperties ?physProp." + //"?physProp rdf:type :Mass." + //"?physProp :value ?massValue." + //don't pick contracts that have been signed already! "?physicalFlowContract :signedByBuyer false." + "?physicalFlowContract :signedBySeller false." + 5. Software implementation

12
public void MassBalanceCalculations(OWLModel owlModel){ double worldMarketStockOfGold = worldMarketStockOfGoldForMassBalanceCalculation(owlModel); double goldInInputStocksOfManufacturers = goldInInputStockOfManufacturersForMassBalanceCalculation(owlModel); double stockOfGoldInPhones = stockOfGoldInPhonesForMassBalanceCalculation(owlModel); double environmentStockOfGoldWaste = environmentStockOfGoldWasteForMassBalanceCalculation(owlModel); double industrialMetalRecoveryAgentsStockOfGold = industrialMetalRecoveryAgentsStockOfGoldForMassBalanceCalculation(owlModel); double backyardMetalRecoveryAgentsStockOfGold = backyardMetalRecoveryAgentsStockOfGoldForMassBalanceCalculation(owlModel); double industrialMetalRecoveryAgentsStockOfGoldWaste = industrialMetalRecoveryAgentsStockOfGoldWasteForMassBalanceCalculation(owlModel); double backyardMetalRecoveryAgentsStockOfGoldWaste = backyardMetalRecoveryAgentsStockOfGoldWasteForMassBalanceCalculation(owlModel); double massBalance = initialWorldMarketStockOfGold - worldMarketStockOfGold - goldInInputStocksOfManufacturers - stockOfGoldInPhones - environmentStockOfGoldWaste - industrialMetalRecoveryAgentsStockOfGold - backyardMetalRecoveryAgentsStockOfGold - industrialMetalRecoveryAgentsStockOfGoldWaste - backyardMetalRecoveryAgentsStockOfGoldWaste; System.out.println("Mass balance for gold is " + massBalance); 6. Model verification

13
Video 1 Video 2 7. Experimentation phoneManufactureA phoneManufactureB phoneManufactureC phoneManufactureD phoneRetailNSPCollection phoneRetailNSPCollectionPay usedPhoneRetail newPhoneConsumption newHighEndPhoneConsumption cheapPhoneConsumption cheapHighEndPhoneConsumption usedPhoneConsumption phoneCollection phoneTestingRefurbishingDisassembly industrialMetalRecovery backyardMetalRecovery Complete agent set

14
33,516 simulation runs 15 parameters varied 100 timesteps (quarters) each 400 GB of data collected How can we recover a larger proportion of metals in mobile phones? Technical lifetime of a mobile phone Mobile phone use time Metal content of a mobile phone Price of gold Price of copper Price of silver Price of palladium Price of components Price of batteries Accessibility of collection pathways Motivation of consumers Incentive cost Disposal tendency of consumers Cost of mobile phone manufacture Gold recovery rate of recyclers Preferences of consumers 7. Experimentation

15
8. Data analysis % query for the necessary data cursorA=exec(connA, [strcat('SELECT tick, age, price, remainingLifeTime, heldByName, goodname FROM andy_5dec2009_phonehistory WHERE runNumber = 60 order by goodname, tick;')]); %Get the data out cursorA=fetch(cursorA); DataMat = cursorA.Data; a = DataMat; tick = cell2mat(a(:,1)); age = cell2mat(a(:,2)); price = cell2mat(a(:,3)); remaininglifetime = cell2mat(a(:,4)); location = a(:,5); … quarterofmanufacture = tick - age; scatter(age,price); newtick = sprintf('%03.0f', tick(1)); saveas(gcf, strcat(num2str(newtick),'.png'));
]); %Get the data out cursorA=fetch(cursorA); DataMat = cursorA.Data; a = DataMat; tick = cell2mat(a(:,1)); age = cell2mat(a(:,2)); price = cell2mat(a(:,3)); remaininglifetime = cell2mat(a(:,4)); location = a(:,5); … quarterofmanufacture = tick - age; scatter(age,price); newtick = sprintf( %03.0f , tick(1)); saveas(gcf, strcat(num2str(newtick), .png ));.")
16
8. Data analysis

17
9. Model validation

18
10. Model use Bollinger, L.A., C. Davis, I. Nikolic and G.P.J. Dijkema. Modeling metal flow systems – Agents vs. equations. Journal of Industrial Ecology, In press. Nikolic, I.; L.A. Bollinger and C.B. Davis: Agent Based Modeling of large-scale socio-technical metal networks, pp. 1-10. In: Proceedings of the TMS Annual Meeting & Exhibition 2010, 14-18 Feb. (2010). At: Seattle, USA.
. At: Seattle, USA..")
19
A model in progress Climate change adaptation of electricity infrastructures

20
Source: Renewables International Minutes Average interruption time per customer per year (2007) Reliability of the Dutch electricity infrastructure
 Reliability of the Dutch electricity infrastructure")
21
Causes of power failures in the Dutch high-voltage grid Source: EnergieNed Impact of weather on the Dutch electricity infrastructure

22
(1)De Groot, 2006 (2)Wilbanks, et al, 2008 (3)Rothstein and Halbig, 2010 (4)Bresser, et al, 2005 The (anticipated) impacts of climate change
De Groot, 2006 (2)Wilbanks, et al, 2008 (3)Rothstein and Halbig, 2010 (4)Bresser, et al, 2005 The (anticipated) impacts of climate change")
23
Climate change and energy infrastructures (1)De Groot, 2006 (2)Wilbanks, et al, 2008 (3)Rothstein and Halbig, 2010 (4)Bresser, et al, 2005 The (anticipated) impacts of climate change on energy systems
De Groot, 2006 (2)Wilbanks, et al, 2008 (3)Rothstein and Halbig, 2010 (4)Bresser, et al, 2005 The (anticipated) impacts of climate change on energy systems")
24
2010 Pakistan floods: Damage to 10,000 transmission lines, Power shortfall > 3 GW, Shut down largest refinery 2005 Hurricane Katrina (Louisiana, USA): Power cut to 2.3 million homes, Destroyed significant oil and gas infrastructure 2006 drought / heat wave (Netherlands): Imposition of cooling water restrictions, reduced reserve capacity Extreme weather events and energy infrastructure
: Power cut to 2.3 million homes, Destroyed significant oil and gas infrastructure 2006 drought / heat wave (Netherlands): Imposition of cooling water restrictions, reduced reserve capacity Extreme weather events and energy infrastructure")
25
Netherlands Europe 3. Altered investment strategies in the power sector 1. Cooling water restrictions and a reduced reserve capacity in the electricity grid 2. Increased market penetration of air conditioners TenneT declares code red – Aug. 10, 2003 Europe Decides Air-Conditioning Is Not So Evil – NYT, Aug. 13, 2003 EU study: Investment needs for future adaptation measures in EU power plants due to effects of climate change – March, 2011 Effects of the 2003 drought / heat wave

26
Key characteristics of climate change and energy infrastructures: 1.The impacts of climate change occur on multiple timescales 2.Actors will adapt independently to perceived climatic changes 3.There exist significant uncertainties associated with the nature and severity of climate change Long-term evolution model Operational performance model Policy scenarios Climate scenarios (agent-based model) Modeling framework: Modeling framework Research question: How can we develop effective strategies to support the resilience of the Dutch electricity infrastructure to climate change?
 Modeling framework: Modeling framework Research question: How can we develop effective strategies to support the resilience of the Dutch electricity infrastructure to climate change")
27
Source: TenneT Quality and Capacity Plan 2010-2016 The high-voltage electricity grid in the Netherlands Proof-of-concept model

28
Consumers Power companies Grid operator Neighboring countries Agents Load Generators Transmission grid Loads & generators Technologies How much electricity to use How much electricity to produce When/where to repair/add capacity How much electricity to produce/use Decisions Proof-of-concept model - setup

29
Consumers Power companies Grid operator Neighboring countries Agents Load Generators Transmission grid Loads & generators Technologies How much electricity to use How much electricity to produce When/where to repair/add capacity How much electricity to produce/use Decisions Demand distribution Production distribution Network topology Voltages at nodes Power flows of lines Proof-of-concept model - setup

30
5 climate change scenarios: 1.No climate change 2.Mild 3.Moderate 4.Severe 5.Very severe 4 investment strategies: 1.No investment 2.Build new links 3.Increase capacity 4.Both Consumers Power companies Grid operator Neighboring countries Agents Load Generators Transmission grid Loads & generators Technologies How much electricity to use How much electricity to produce When/where to repair/add capacity How much electricity to produce/use Decisions Demand distribution Production distribution Network topology Voltages at nodes Power flows of lines Proof-of-concept model - setup

31
Climate change severity Investment strategy Mean consumer satisfaction Average line load Proof-of-concept model - results

32
Case study 2 Multiple spatial scales Case study 1 Case study 3 1.How might different grid planning procedures affect resilience to climate change? 2.How might long-term changes in wind patterns and solar radiation across Europe affect the ability to meet demand with renewables? 3.How might evolving infrastructure interconnections at the local level affect resilience?

33
Case studies - Implementation AgentSpring platform Base model Case study 1 Case study 2 Case study 3

Similar presentations