Download presentation
Presentation is loading. Please wait.

1
Stem/Leaf plots and frequency tables/Histograms
Objective: students will create an accurate stem/leaf plot and be able to answer questions based on the information. They will then construct a frequency table and from that make a histogram.

2
Information stem/leaf
Stem/leaf plot: display data by digits. Stem: 1st digits Leaf: last digit Ex: 34 3 is the stem 4 is the leaf To make: Create key Draw graph, i.d. stem and leaf Put stems in order

3
Stem Leaf plot 23, 25, 45, 21, 54, 60, 68, 49, 52 234, 245, 257, 249, 307, 238, 240, 265

4
Stem/Leaf plot 17, 11, 25, 58, 96, 28, 11, 19, 20 , 31 170, 152, 179, 182, 193, 158, 149, 160

5
Interpret Information from stem/leaf
Stem A , 2, 5, 4 1, 5, 9 5 0, 4, 5, 8 6 0, 2, 5 Stem B 3 0, 5, 9 4 0, 0, 2, 5, 5 5 4, 5, 8 6 5, 9 Compare Median prices. Which has more sneakers priced over $50? Which store has more sneakers priced between $30-$40?

6
Creating Frequency Table
Frequency: number of times event occurs. Frequency table: groups data into intervals to show frequency.

7
Create Frequency Table
3, 8, 14, 10, 11, 20, 12, 13, 11, 13, 12, 18, 12, 14

8
Create Frequency Table
7, 15, 4, 14, 8, 12, 5, 3, 6, 11

9
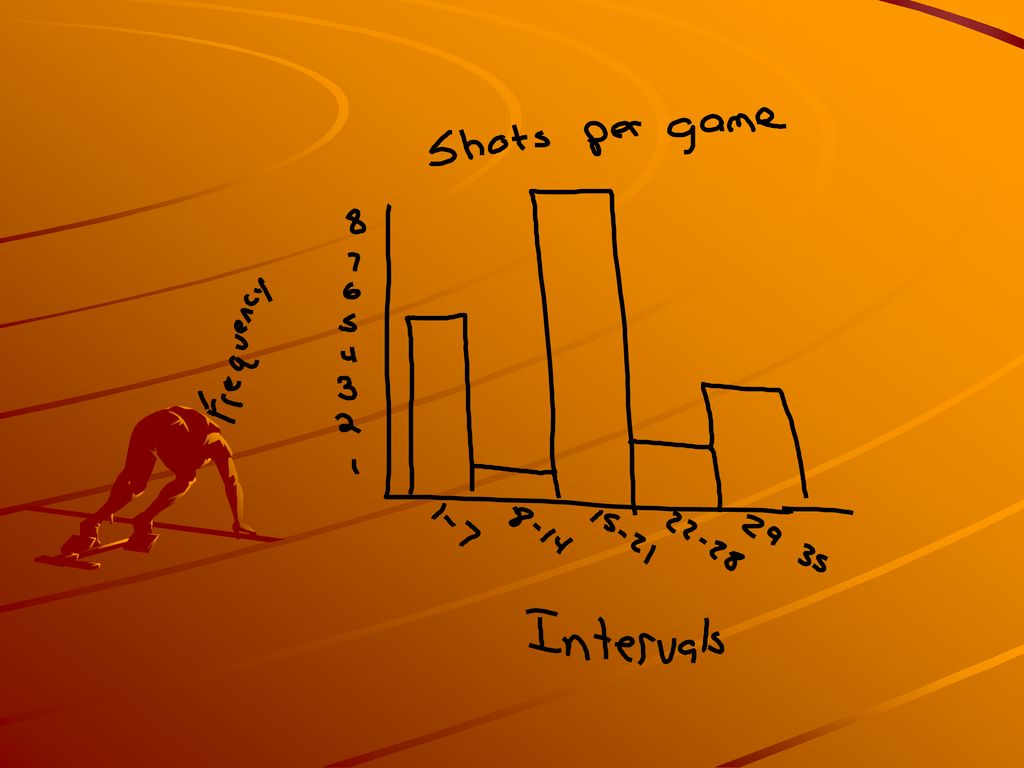
Creating Histogram To make: Information
intervals x-axis and frequency y-axis draw bars to frequency give histogram title Information Histogram: data display from frequency table. *one bar each interval *length = frequency *no gaps between bars.

11
Create histogram 12, 18, 43, 17, 35, 17, 10, 16, 16, 44, 19, 29, 22, 31, 16

12
Create Histogram 9, 15, 2, 4, 9, 11, 10, 1, 18, 4, 9, 2, 8, 7, 4, 11, 10, 9, 16, 5

Similar presentations