Download presentation
Presentation is loading. Please wait.

1
Constructing and Interpreting Graphs Objective – to draw, compare, and analyze bar graphs vs. stem and leaf plots. Pages 156-159

2
Scores for Test 1Scores for Test 2Stem Leaf 4 4 6 7 4 5 5 0 3 3 4 5 1 6 0 2 6 2 3 3 3 5 7 2 7 0 3 6 6 6 6 6 7 8 0 6 6 9 8 0 5 9 9 0 1 5 8 8 9 9 0 9 Turn to page 156 How are these graphs alike? How are they different?

3
Scores for Test 1Scores for Test 2Stem Leaf 4 4 6 7 4 5 5 0 3 3 4 5 1 6 0 2 6 2 3 3 3 5 7 2 7 0 3 6 6 6 6 6 7 8 0 6 6 9 8 0 5 9 9 0 1 5 8 8 9 9 0 9 They have the same data, BUT Bar graph has the data grouped in tens comparing Test 1 & 2. Stem & Leaf are separated but you can see all the numbers.

4
Take out your ruler and measure the span of your hand in centimeters. Round to the nearest centimeter. Write down your answer.

5
Let’s compile our data. Everyone write down this list as we go along. Girls Boys

6
Now it’s your turn to create a stem and leaf plot using our data. Neatly create two in your notebook, one for the boys and one for the girls. StemLeaf 012012 Your ones go in here in order from least to greatest.

7
Now it’s time to create a bar graph. What do you think our intervals should be? Every 10 centimeters? Every 5 centimeters? Something else? Organize your data, then use the provided paper to create a bar graph. Example: -> ◦Remember Title Label Axis Legend

8
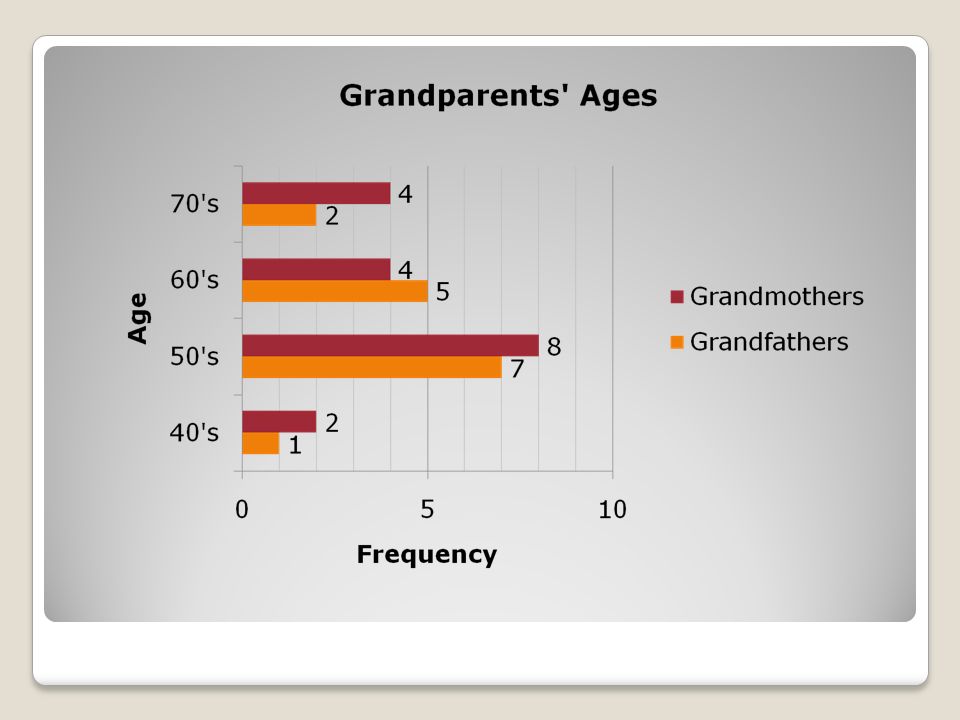
Page 157 Ages of grandparents of a grade 6 class. Grandmothers’ Ages 51 52 61 48 57 55 45 61 57 50 71 70 56 76 73 55 65 63 Grandfathers’ Ages 50 59 57 65 51 62 68 46 61 55 69 53 70 73 51

10
Grandparents’ Ages StemLeaf 45 6 8 50 0 1 1 1 2 3 5 5 5 6 7 7 7 9 61 1 1 2 3 5 5 8 9 70 0 1 3 3 6

11
Grandparents’ Ages StemLeaf 45 6 8 50 0 1 1 1 2 3 5 5 5 6 7 7 7 9 61 1 1 2 3 5 5 8 9 70 0 1 3 3 6 From which graph can you find the range? What is the range?

12
Grandparents’ Ages StemLeaf 45 6 8 50 0 1 1 1 2 3 5 5 5 6 7 7 7 9 61 1 1 2 3 5 5 8 9 70 0 1 3 3 6 From which graph can you find the range? The stem and leaf plot What is the range? 76-45=31

13
Practice Page 158 # 1, 2, 3

Similar presentations


 shows data by using X ’ s? 2.What type of graph(s) shows data by using bars? 3.What type of graph(s) shows data with.>")


