Download presentation
Presentation is loading. Please wait.

1
Nihal Jambotkar & Chris Canazaro

2
Background The US needs to invest $334.8 Billion in Drinking Water Infrastructure by 2026 An additional $322 Billion in Wastewater Infrastructure by 2030 Current infrastructure is inefficient and results in the loss of water resources

3
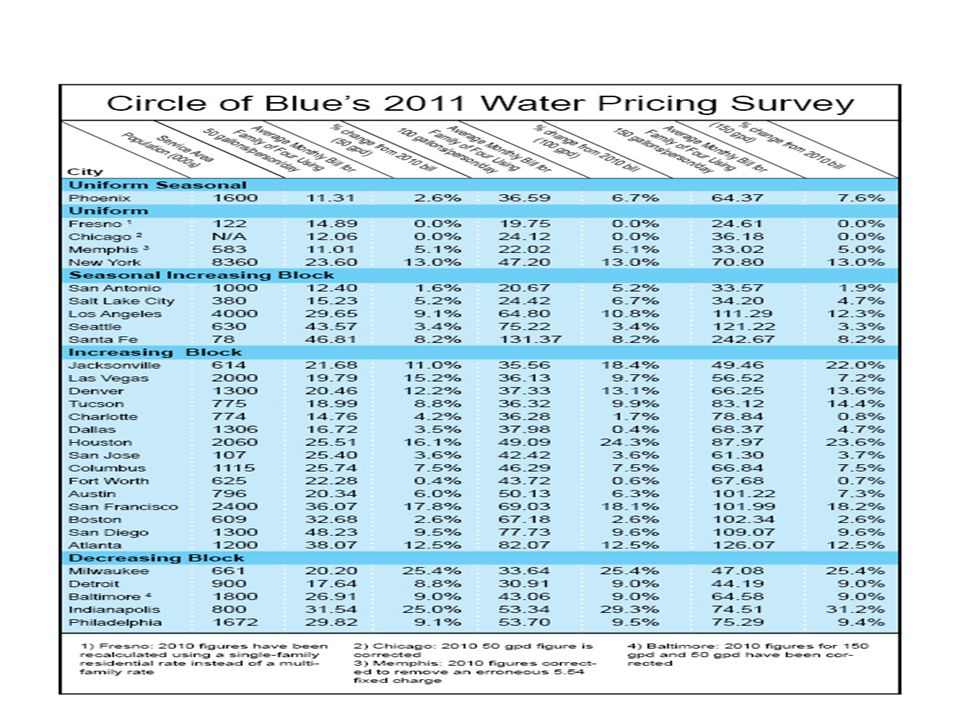
Water Rate History Water Rates increased by 9% on average last year. Water rates have increased by 2x CPI over the last 30 years No investment vehicle is currently available to invest in water resources

4
Solution Securitize Water Rate Payments into an Asset-Backed SecurityOffer Investors an Inflation-Adjusted Fixed Income VehicleReduce the Cost of Financing for MunicipalitiesProvide the Basis for Increased Knowledge of Efficient Water Pricing

5
Why an ABS? Convert illiquid assets into financial instruments that can be bought and sold freely Provide cheaper financing for entities due to a higher credit rating by decoupling borrowing costs from Municipal Credit Ratings Facilitates marketing of securities to investors with different risk appetites and investing time horizons

6
Impact Price Discovery Mechanism for Water Incentivize more effective usage and pricing by stakeholders Promote water conservation efforts Funds Infrastructure Investment Upgrading infrastructure will increase resource efficiency through reduction in use and loss of water in the system

7
Financial Benefits Inflation Hedge Currently – Best Inflation Indexed Security is US-TIP ABS offers an inflation protected return higher than US-TIP Funding Spread Provides cheaper funding for Municipalities than traditional GO & RV Muni-Bonds

8
Investment Structure Future Rate Payments to Utility Packaged as a 30 year lease between the Utility and Municipality Lease Transferred to Special Purpose EntitySPE Packages Lease as an Asset-Backed SecurityABS is Sold to Investors

9
Model NPV of Payments to the Municipality & InvestorsInflation-Adjusted Return to InvestorsCalculated Spread for Municipality Cash Flows Goal: Provide Higher Return Spread for the Municipality over Conventional Bonds Goal: Provide Higher Return for Investors over Inflation-Adjusted Treasuries

10
Investor Returns

11
Sensitivity Analysis

12
Legal Status In order to be competitive with municipal bonds this product will have to offer tax-free interest payments to investors. Due to the unprecedented nature of this investment vehicle it can not be guaranteed at this point. Product feasibility will require legal counsel and possibly result in litigation and regulatory hurdles prior to implementation.

13
Implementation Partnering with industry will be the differentiating factor for success. Having the technical ability to implement infrastructure projects will provide a competitive advantage over purely financial institutions.

14
Conclusion The ABS approach represents a new option for infrastructure financing that will offer better than market rates of return for both issuers and investors. Increased investment and price discovery will provide a positive impact for water use and conservation.

15
Assumptions Expected Annualized Water Rate Growth (x2 Inflation)6.000% Expected Inflation3.000% Current Muni Yield4.316% 30-year Inflation Indexed Treasury + 100bps3.125% 30-year Treasury current yield4.270% Current Expected Cashflows (per customer) time 012 Cash Flow received by Municipality $100.00 $6.00 $6.36 Cash Flow received by Security Holder $- $4.32 Difference (Spread) $100.00 $1.68 $2.04 PV of Spread (discounted at 30 year Treasury rate) $100.00 $1.62 $1.88 NPV of spread to Municipality $220.61 Repackaged as ABS (Inflation adjusted) time 012 Cash Flow received by Municipality $100.00 $6.00 $6.36 PV Cash Flow received by Municipality (discounted at Treasury Rate) $100.00 $5.75 $5.85 Inflation Index100.00103.00106.09 Cash Flow received by Security Holder $- $3.22 $3.32 PV Cash Flow received by Security Holder (discounted at adjusted Treasury Rate) $- $3.00 $2.87 Difference (Spread) $100.00 $2.78 $3.04 PV of Spread $100.00 $2.76 $2.98 NPV of spread to Municipality $240.54
6.000% Expected Inflation3.000% Current Muni Yield4.316% 30-year Inflation Indexed Treasury + 100bps3.125% 30-year Treasury current yield4.270% Current Expected Cashflows (per customer) time 012 Cash Flow received by Municipality $ $6.00 $6.36 Cash Flow received by Security Holder $- $4.32 Difference (Spread) $ $1.68 $2.04 PV of Spread (discounted at 30 year Treasury rate) $ $1.62 $1.88 NPV of spread to Municipality $ Repackaged as ABS (Inflation adjusted) time 012 Cash Flow received by Municipality $ $6.00 $6.36 PV Cash Flow received by Municipality (discounted at Treasury Rate) $ $5.75 $5.85 Inflation Index Cash Flow received by Security Holder $- $3.22 $3.32 PV Cash Flow received by Security Holder (discounted at adjusted Treasury Rate) $- $3.00 $2.87 Difference (Spread) $ $2.78 $3.04 PV of Spread $ $2.76 $2.98 NPV of spread to Municipality $240.54")
Similar presentations


 FIN 200: Personal Finance Topic 19–Bonds Lawrence Schrenk, Instructor.>")


