Download presentation
Presentation is loading. Please wait.

1
Atlantic Ocean Maury Project 2013 CAPT Bill Schulz US Naval Academy schulz@usna.edu

2
Atlantic Ocean Facts The most studied ocean
Second-largest of the world’s oceans Born: about 170,000,000 B.C. Area: ~77 million km2 (~ 6.5 times the area of U.S.) Average depth: 3575 meters (11,072 ft) Volume: 337,000,000 km3 ( 8.9x10¹⁹gallons) Average surface salinity: ppt Higher than Pacific due to greater evaporation Still growing
 Average depth: 3575 meters (11,072 ft) Volume: 337,000,000 km3 ( 8.9x10¹⁹gallons) Average surface salinity: ppt. Higher than Pacific due to greater evaporation. Still growing.")
3
Atlantic Ocean Basin Mid-Atlantic Ridge
Atlantic is in Stage III of Ocean Basin Evolution: A MATURE basin Spreading ~3 cm/year USGS - Understanding Plate Motions Mid-Atlantic Ridge Stage III

4
Stages of Ocean Basin Evolution
I – embryonic (crustal extension, rift; East Africa) II – young (subsidence, spreading; Red Sea) III – mature (spreading; Atlantic) IV – declining (spreading and shrinking; Pacific) V – terminal (shrinking, uplift; Mediterranean) VI – relict scar (Indus Suture)
 II – young (subsidence, spreading; Red Sea) III – mature (spreading; Atlantic) IV – declining (spreading and shrinking; Pacific) V – terminal (shrinking, uplift; Mediterranean) VI – relict scar (Indus Suture)")
5
Atlantic Ocean Basin Large ridge/rise system - ~ 70,000 km long
Not nearly as seismically active as the Pacific Youngest crust down the center, rising and forming the Mid-Atlantic Ridge Age of Oceanic Crust – Millions of Years Before Present

6
Major Surface Currents in the Atlantic
UCAR's Windows to the Universe Ocean currents tutorial from RSMAS Tomczak & Godfrey Regional Oceanography text

7
Wind Drives Atlantic Ocean Circulation
1 Sv = 264 million g/sec

8
Motion due to the wind (and Coriolis) affects the vertical structure of the water column (and therefore, temperature, biology, sound, etc….) Western Boundary Current Eastern Boundary Current Most of the poleward transport of warm waters occur along the western boundaries and the sinking of dense surface waters occur in relatively small regions. The upwelling of water occurs basin-wide and is most pronounced in regions with divergent Ekman transport.

9
Atlantic Thermohaline Circulation
General Concept (National Climatic Data Center) – Sun’s heat absorbed in tropical ocean carried to the North Atlantic Oceanic conveyor belt - the large-scale 3-D flow pattern that results from the sinking of water in the Nordic and Greenland Seas and around Antarctica.
 – Sun’s heat absorbed in tropical ocean carried to the North Atlantic. Oceanic conveyor belt - the large-scale 3-D flow pattern that results from the sinking of water in the Nordic and Greenland Seas and around Antarctica.")
10
Modified from figure courtesy of Dr
Modified from figure courtesy of Dr. Steve Hovan, Indiana University of Pennsylvania.

11
Density Distribution Temperature (oC) AABW – Antarctic Bottom Water
AAIW – Antarctic Intermediate Water NADW – North Atlantic Deep Water UPPER – North Central Atlantic Water Density Distribution Temperature (oC) Salinity (PSU)
 Salinity (PSU)")
12
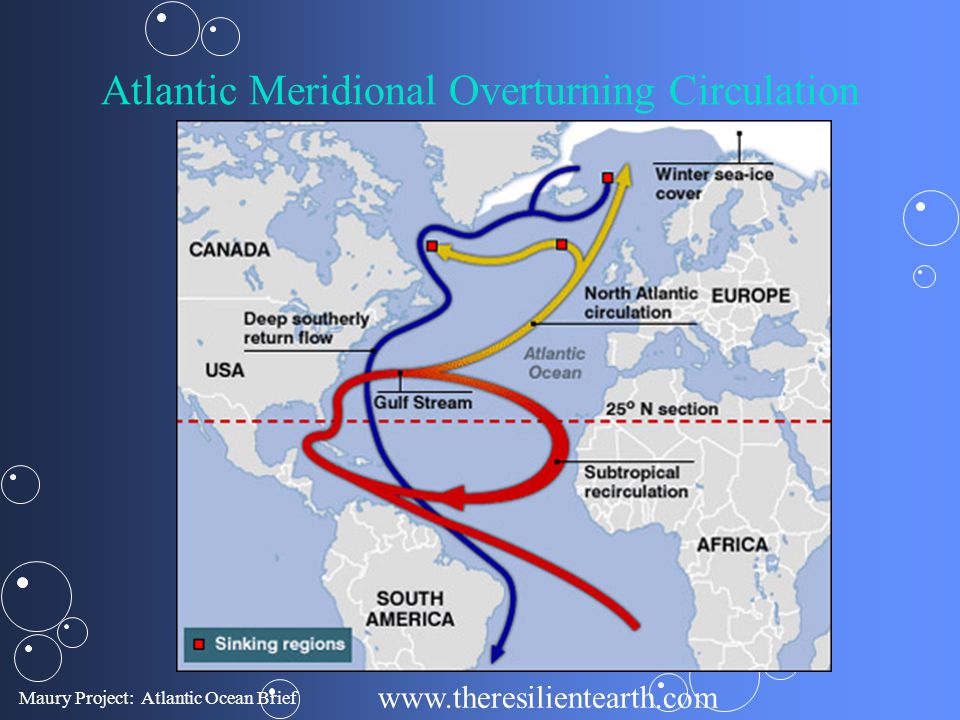
Atlantic Meridional Overturning Circulation
13
ATLANTIC WATER MASS INPUT:
Salt (Mediterranean Sea) Fresh Water (Amazon and Congo Rivers) Sediment (St. Lawrence, Niger, Rhine Rivers) Heat (Caribbean Sea and Gulf of Mexico) Bottom Water (Arctic and Antarctic Seas)
 Fresh Water (Amazon and Congo Rivers) Sediment (St. Lawrence, Niger, Rhine Rivers) Heat (Caribbean Sea and Gulf of Mexico) Bottom Water (Arctic and Antarctic Seas)")
14
Mediterranean Outflow
Large evaporation in the Med. Produces dense/salty water, which then sinks. (Levantine Intermediate Water + Mediterranean Deep Water ) Water spills over the sill at Gibraltar, As the plume of MOW exits Gibraltar, it moves to the north, then spreads west and south MOW mixes with and settles with the North Atlantic Deep water, and spreads out one thousand km across the basin.
 Water spills over the sill at Gibraltar, As the plume of MOW exits Gibraltar, it moves to the north, then spreads west and south. MOW mixes with and settles with the North Atlantic Deep water, and spreads out one thousand km across the basin.")
15
(from Tomczak and Godfrey)
Temperature at 1000 m depth (from Tomczak and Godfrey) The Mediterranean Sea is connected to the North Atlantic through the narrow Strait of Gibraltar. Flow is into the Mediterranean at the sea surface in the Strait. Within the Mediterranean there is large evaporation and cooling and production of dense water. High salinity water, formed by evaporation in the Meditterean Sea, spills over the sill at Gibraltar, mixes with North Atlantic water, and spreads out one thousand km across the basin. When water is sufficiently cooled, at polar latitudes, by cold atmospheric air, it gets denser and sinks. The vertical sinking motion causes horizontal water motion as surface waters replace the sinking water. This is one example of thermohaline flow. This flows out into the North Atlantic at the bottom of the Strait. The resulting Mediterranean Water (or Mediterranean Outflow or Overflow Water) in the North Atlantic is found at mid-depth and is marked by its salinity maximum both in the vertical and in the horizontal along isopycnals. Vigorous entrainment as it moves down the slope reduces its high salinity and density. It finally equilibrates after mixing at a depth of about 1000 m.
 The Mediterranean Sea is connected to the North Atlantic through the narrow Strait of Gibraltar. Flow is into the Mediterranean at the sea surface in the Strait. Within the Mediterranean there is large evaporation and cooling and production of dense water. High salinity water, formed by evaporation in the Meditterean Sea, spills over the sill at Gibraltar, mixes with North Atlantic water, and spreads out one thousand km across the basin. When water is sufficiently cooled, at polar latitudes, by cold atmospheric air, it gets denser and sinks. The vertical sinking motion causes horizontal water motion as surface waters replace the sinking water. This is one example of thermohaline flow. This flows out into the North Atlantic at the bottom of the Strait. The resulting Mediterranean Water (or Mediterranean Outflow or Overflow Water) in the North Atlantic is found at mid-depth and is marked by its salinity maximum both in the vertical and in the horizontal along isopycnals. Vigorous entrainment as it moves down the slope reduces its high salinity and density. It finally equilibrates after mixing at a depth of about 1000 m.")
16
The Gulf Stream Current on the western boundary of the Atlantic Ocean
Western boundary currents are much narrower and faster than eastern boundary currents Western boundary currents move significant amounts of warm waters northward and are important in transporting excess heat from the tropics towards the poles. Eddies form along the meandering Gulf Stream

17
Gulf Stream

18
Views of the Gulf Stream
“There is a river in the ocean. In the severest droughts it never fails, and in the mightiest floods it never overflows; its banks and its bottom are of cold water, while its current is of warm; the Gulf of Mexico is its fountain, and its mouth is the Arctic Sea. It is the Gulf Stream. There is in the world no other such majestic flow of waters.” - Matthew Fontaine Maury 1855 U.S. Coast and Geodetic Survey 1860 Franklin-Folger 1770 NOAA AVHRR 1996 1770 – Benjamin Franklin had Mount & Page's in London engrave the above chart featuring the Gulf Stream. Copies were sent to the captains of the mail packets at Falmouth, who promptly disregarded it. Franklin also had copies printed in Paris. Since then, it has become the most famous early depiction of the current. 1860 – U.S. Coast and Geodetic Survey published this chart based on data gathered by Ben Franklin’s Great-grandson, LT George Bache. LT Bache was engaged in Gulf Stream surveys in 1864, when he was caught in a hurricane off of Cape Hatteras. Bache and many of his shipmates were killed in the storm. 1996 – Infrared imagery of Atlantic Ocean sea surface temperatures obtained via AVHRR on NOAA 12 and 14. Image processed by Johns Hopkins Applied Physics Lab.

19
The Loop Current 20 April 2010 Deep Water Horizon NOAA Oil Spill Map
Naval Research Lab Gulf of Mexico Currents (Global NRL Layered Ocean Model – NLOM)
")
20
Air-Ocean Interaction and The Atlantic Ocean
Hurricanes 2013 expected to be slightly above average (Gray, Colorado State, 2013) 18 named storms (avg=12), 9 hurricanes (avg=6.5 avg), 4 major (avg = 2) Atlantic role in Extra-Tropical Cyclones
 18 named storms (avg=12), 9 hurricanes (avg=6.5 avg), 4 major (avg = 2) Atlantic role in Extra-Tropical Cyclones.")
21
Atlantic Hurricanes Warm ocean water (> 78.8 F;26 C) is a main ingredient for formation of Hurricanes NASA Earth Observatory - Hurricane Tutorial Climatology National Hurricane Center Storm surge (wind piling up water) is biggest damager COMET storm surge tutorial Satellite Imagery Of Past Hurricanes Archive Imagery from CIMSS Of Current Ocean Basins NRL Satellite Homepage, NRL Tropical Cyclone Page
 is biggest damager COMET storm surge tutorial. Satellite Imagery. Of Past Hurricanes Archive Imagery from CIMSS. Of Current Ocean Basins NRL Satellite Homepage, NRL Tropical Cyclone Page.")
23
The Historic 2005 Season - 27 Named Systems - 15 Hurricanes
2004 had 15 named systems and 9 hurricanes. The Historic 2005 Season - 27 Named Systems - 15 Hurricanes

24
Saffir Simpson Scale Type Pressure (mb) Winds (knots) Winds (mph)
Category Pressure (mb) Winds (knots) Winds (mph) Surge (ft) Depression TD --- < 34 < 39 Tropical Storm TS 34-63 39-73 Hurricane 1 > 980 64-82 74-95 4-5 2 83-95 96-110 6-8 3 96-112 9-12 4 13-18 5 < 920 > 135 > 155 > 18
 Winds (knots) Winds (mph) Surge (ft) Depression. TD. --- < 34. < 39. Tropical Storm. TS Hurricane. 1. > < 920. > 135. > 155. > 18.")
25
Hurricane Isabel Sep 2003 Extensive flood damage along Chesapeake Bay coastline due to storm surge USNA Flooded Storm surges of 3-5 ft above normal tide levels were observed over the central portions of the Chesapeake Bay and 5-6 ft over the southern portion of the Bay in the vicinity of Hampton Roads, Virginia. Surge values of 6-8 ft above normal levels were observed in the upper reaches of the Chesapeake Bay near Annapolis and Baltimore, Maryland and in most of the main stem rivers draining into the Chesapeake Bay. Even higher surges occurred at the heads of the rivers, with values of 8.5 ft above normal levels at the Richmond City locks along the James River in Virginia and nearly 8 ft along the Potomac River in Washington, D.C. Water levels exceeded previous record levels established in the Chesapeake-Potomac Hurricane of 1933 in Washington, D.C., Baltimore and Annapolis.

26
Powerful storm surge and winds from Hurricane Katrina (Aug 2005) rip two floating casinos in Biloxi, MS from their moorings, relocating them across a highway. Other significant damage to structures, landscape and vegetation are also observed. Casino 2 Casino 1 Biloxi, MS 13 Nov 2001 Casino 1 Casino 2 From: Spaceimaging.com Biloxi, MS 2 Sept 2005

27
Radar Imagery of Landfall of Hurricane Dennis (July 2005)
NWS National and Regional Radar Composites

28
Impact of ENSO on ATL Hurricane Season?
El Niño (warm equatorial Pacific) leads to fewer ATLANTIC cyclones La Niña (cooler equatorial Pacific)favors ATLANTIC cyclone development Currently (26 June 2012) largely neutral, 50% chance of El Niño conditions developing in later half of 2012. ENSO module later in the Project, in the meantime: Climate Prediction Center - ENSO Discussion NWS JetStream - Weather Impacts of ENSO
 leads to fewer ATLANTIC cyclones. La Niña (cooler equatorial Pacific)favors ATLANTIC cyclone development. Currently (26 June 2012) largely neutral, 50% chance of El Niño conditions developing in later half of ENSO module later in the Project, in the meantime: Climate Prediction Center - ENSO Discussion. NWS JetStream - Weather Impacts of ENSO.")
29
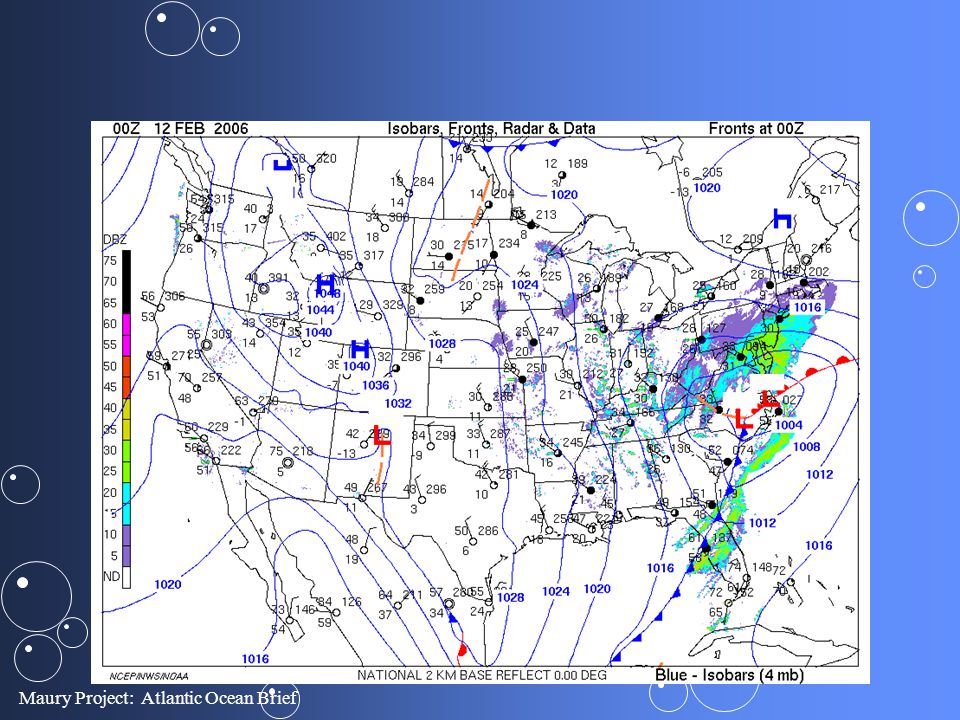
Winter – Nor’easters Storms Develop in Southeast and move up the Atlantic coastline Large moisture content Potential for large snowfall amounts from Mid-Atlantic to Northeast U.S. Movement over the Gulf Stream intensifies storm – source of heat/moisture Gale/Hurricane force winds and coastal flooding along NE Seaboard

30
History Makers Nor’Easters – Storm of the Century
Extra-Tropical / Tropical Storm Interaction - The Perfect Storm

31
Nor’easter Development AMS DataStreme Project

34
Additional On-Line Education Resources
Oceans activities from Education World Celebrate the Year of the Ocean A "Sea" of Resources on the Internet! Tutorials on Hurricanes WW2010 Tutorial - Hurricanes NASA Earth Science for Kids - "Tropical Twisters" Community Learning Network (CLN) - Hurricane learning and activity resources list
 - Hurricane learning and activity resources list.")
35
On-Line Education Resources, Cont’d
Consortium on Oceanographic Activities for Students and Teachers (COAST) - Resource Guide JPL - Resources for OC / MET and Remote Sensing of the OCN/ATM Smithsonian Museum of Natural History – Ocean Exhibits Smithsonian Ocean Planet - outdated Smithsonian - Sant Ocean Hall List of Oceanography resources from NCSU NWS Tutorial - Thunderstorm Tornado Development
 - Resource Guide. JPL - Resources for OC / MET and Remote Sensing of the OCN/ATM. Smithsonian Museum of Natural History – Ocean Exhibits. Smithsonian Ocean Planet - outdated. Smithsonian - Sant Ocean Hall. List of Oceanography resources from NCSU. NWS Tutorial - Thunderstorm Tornado Development.")
Similar presentations


>")
 Affect water to a depth of several hundred meters Driven by winds Move in circular patterns in 5 major oceans. Because of Coriolis.>")
 EarthsClimate_Web_Chapter.pdfEarthsClimate_Web_Chapter.pdf, p. 22-24.>")
 Physical Oceanography>")


