Download presentation
Presentation is loading. Please wait.

1
Methodologies for climate variability analysis of winegrowing regions. A case study of Bordeaux winegrowing area. Benjamin BOIS Centre de Recherches de Climatologie Université de Bourgogne

2
Spatial analysis of climate for viticulture Risk management –Pest management (models) –Frost, hail, wind, excessive drought risks Terroir comprehension and characterization –Vineyard management –Site selection Source : RSVAH (2007), Sandoz Bindi & Maselli (2001)
 –Frost, hail, wind, excessive drought risks Terroir comprehension and characterization –Vineyard management –Site selection Source : RSVAH (2007), Sandoz Bindi & Maselli (2001)")
3
1 cm 10 cm1 m10 m100 m1 km10 km100 km1000 km Micro-scale Macro-scale LeafCanopyPlotVineyard Climate differences > Uncertainty From Oke (1978) Climate differences Uncertainty ? Local scale Meso-scale Spatial scale in climatology RegionCountry

4
Climate spatialization 11,5°C 12°C 14°C 13°C ? Interpolation Meteorological models Remote sensing

5
Bordeaux winegrowing region Normals (1976-2005) Villenave dOrnon 0 5 10 15 20 25 30 Jan. Mar. Mai Jul. Sept. Nov. Temperature (°C) 0 20 40 60 80 100 120 Rainfall (mm) RR Tmin Tmax Tmoy
 Rainfall (mm) RR Tmin Tmax Tmoy.")
6
Rainfall ET 0 RsRs MODELS ET AGRO- CLIMATIC INDICES at daily time step Soil water balance Degree-days Stations T min T max Radar CORINE DEM Sat Zoning

7
Zoning relevance Is the spatialization uncertainty sufficiently low to draw reliable analysis of the spatial structure of climate ?

8
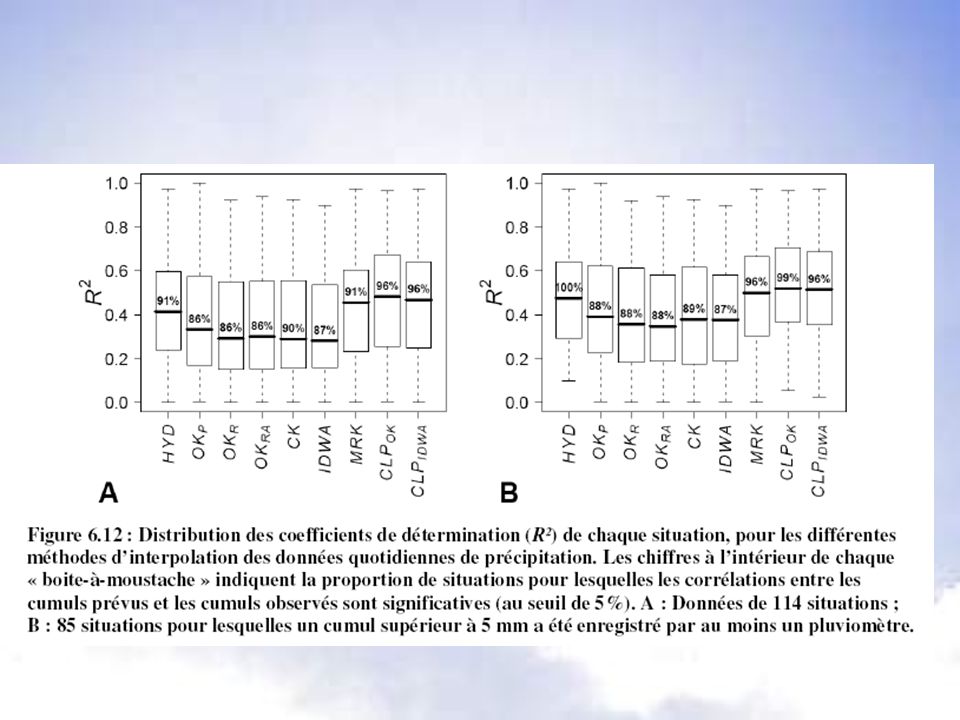
Spatialization accuracy Variable Spatialization technique Available period Evaluation period RMSE (Apr.-Sept.) Rainfall Ordinary kriging1994-2005 5.6 mm/month (11%) T min Multiple regression + kriging 2001-2005 0.86°C T max Multiple regression + kriging 2001-2005 0.6°C RsRs Satellite sensing + DEM 1985-20052001-2005 3.3 MJ/m²/day (17%) ET 0 Turc method2001-2005 0.57 mm/day (16%)
 Rainfall Ordinary kriging mm/month (11%) T min Multiple regression + kriging °C T max Multiple regression + kriging °C RsRs Satellite sensing + DEM MJ/m²/day (17%) ET 0 Turc method mm/day (16%)")
9
Spatialization accuracy TEMPERATURE Half-véraison (DD prediction vs. field observations) Predicted values vs. grapevine phenology Spatialization residuals (errors) vs. Measured spatial variability RAINFALL Comparison of several interpolation methods
 Predicted values vs. grapevine phenology Spatialization residuals (errors) vs. Measured spatial variability RAINFALL Comparison of several interpolation methods.")
10
Zoning relevance Is the spatialization uncertainty sufficiently low to draw reliable analysis of the spatial structure of climate ? Is the spatial structure redundant ?

11
Rainfall year-to-year variability 2004 1994

12
64% 21% 12% 1% Degree.days Zoning 2001-2005 period Cool zones ( +5 to +15 days): Early cultivars (Merlot, white cultivars,…) Warm zones ( -5 to -15 days): Late cultivars (Cabernet-Sauvignon, Petit Verdot) Climate change consideration Interclass interval : 42 to 79 DD 5 to 11 days
: Early cultivars (Merlot, white cultivars,…) Warm zones ( -5 to -15 days): Late cultivars (Cabernet-Sauvignon, Petit Verdot) Climate change consideration Interclass interval : 42 to 79 DD 5 to 11 days")
13
Conclusions New technologies (remote sensing, GIS, increasing computing potentialities) More accurate interpolations, reduction of the cost / scale dilemma
 More accurate interpolations, reduction of the cost / scale dilemma")
14
Conclusions The need for climate spatial analysis recommendations Numerous methods and data Ergonomic simple !

15
Thanks ! …Work in progress… TERVICLIM (Very large scale climate analysis and modelling) Large scale climate analysis (Jones et al.) World classification of winegrowing regions Bois (unpublished)
 Large scale climate analysis (Jones et al.) World classification of winegrowing regions Bois (unpublished).")
17
Résultats RMSE = 0.86°C RMSE = 0.59°C

18
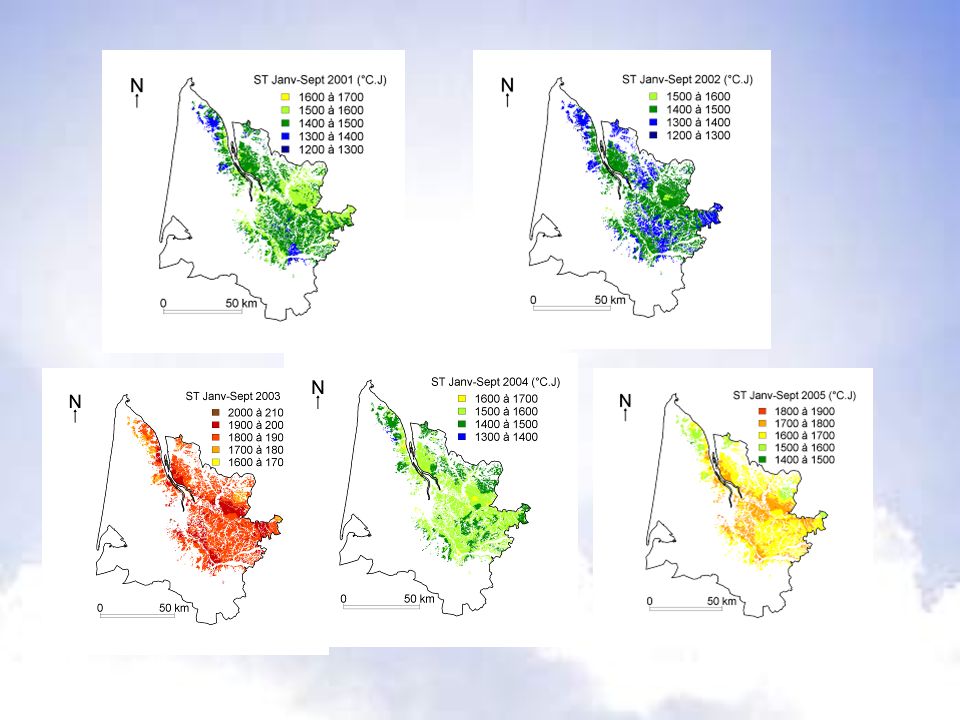
Temperature 2001-2005 period Strong inter-annual variations ST Jan.-Sept. 2002 (DD) ST Jan.-Sept. 2003 (DD)
 ST Jan.-Sept (DD).")
20
0.5 0.6 0.7 0.8 0.9 1 YearApr. - Sept. RMSE (°C) OK IDWA MRK T min Daily temperature spatialization 0.5 0.6 0.7 0.8 0.9 1 YearApr. - Sept. RMSE (°C) T max Minimal temperature vs. distance to Gironde estuary
 OK IDWA MRK T min Daily temperature spatialization YearApr. - Sept. RMSE (°C) T max Minimal temperature vs. distance to Gironde estuary.")
22
Rayonnement global RMSE annuelle de 2,7 MJ.m -2 par jour (19,8%) Sous-estimation : biais de -11,1% Climatologie de la Gironde –Gradient Ouest-Est de temps clair décroissant. –Jusquà 20% décart max. en hiver, 16% en été (8% en Gironde viticole) –Effet notable du relief N
 –Effet notable du relief N.")
23
R s HelioClim-1 (MJ.m -2 ) R s pyranometer (MJ.m -2 ) Solar radiation spatilization 2001-2005 (1826 days) Annual RMSE = 2.7 MJ.m -2 (19.8%) RMSE Aug.-Sept. =2.9 MJ.m -2 (16.6%) 10 to 6% 6 to 1% 3 to -3% -3 to -8% -8 to -13% Urban areas Saint-Émilion village
 10 to 6% 6 to 1% 3 to -3% -3 to -8% -8 to -13% Urban areas Saint-Émilion village.")
24
ET 0 RsRs T min T max Potential Evapotranspiration : Turc Method with local re-adjustement Annual RMSE= 0.51 (21%) Apr.-Sept. RMSE= 0.57 (15.9%)
.")
26
Saint-emilion – zoom – moy. Ver mat 20 ans N

27
ETP RMSE = 0.25 mm (11%)RMSE = 0.41 mm (17%)
RMSE = 0.41 mm (17%)")
28
ETP (prop. Interpolation T) Données de validation croisée du processus dinterpolation des températures (MRK) Faible propagation des erreurs dinterpolation de la température quotidienne RMSE ~ 0.05 mm
 Données de validation croisée du processus dinterpolation des températures (MRK) Faible propagation des erreurs dinterpolation de la température quotidienne RMSE ~ 0.05 mm.")
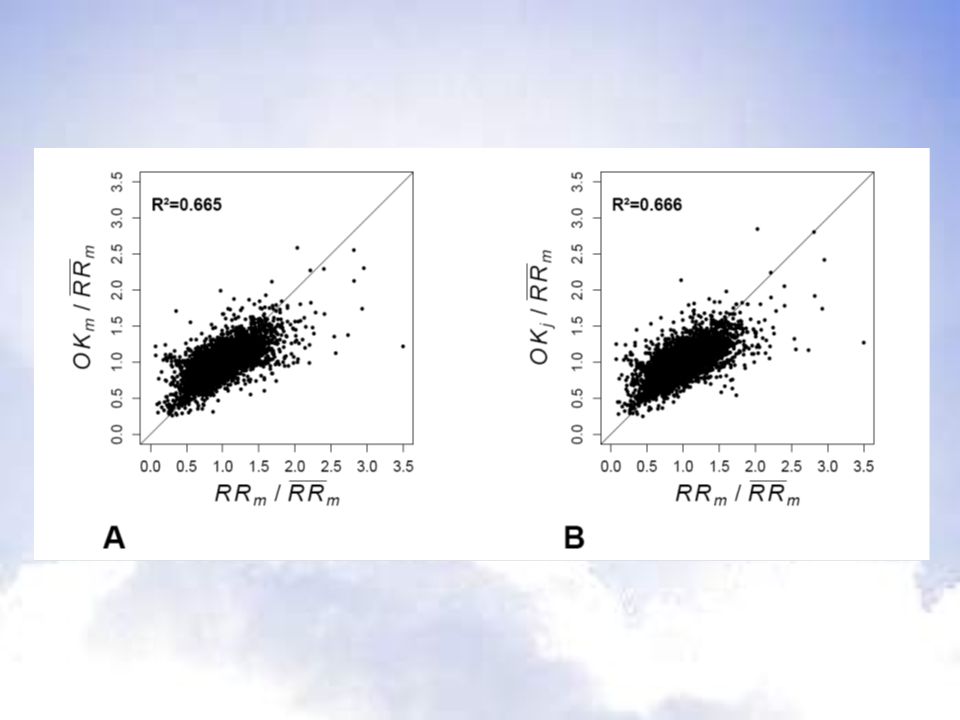
33
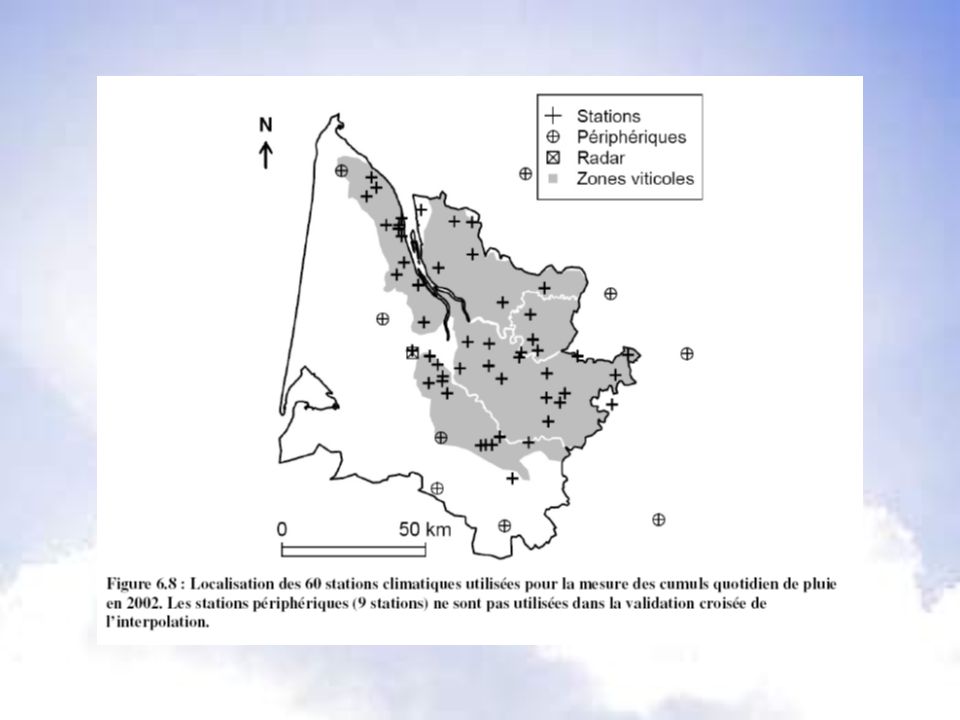
Radar (Hydram Method) RMSE = 4.4 mm Ordinary kriging RMSE = 2.5 mm RADAR Rainfall spatialization Numerous artifacts with radar rainfall estimates Ordinary kriging at different time steps 114 days – 51 raingauges location
 RMSE = 4.4 mm Ordinary kriging RMSE = 2.5 mm RADAR Rainfall spatialization Numerous artifacts with radar rainfall estimates Ordinary kriging at different time steps 114 days – 51 raingauges location")
Similar presentations


 Results WG III Folie 1 A Short Overview of the IPCC Report on Climate Change Mitigation 2007 (WG III) Prof. Dr.>")

, J. Noilhan (2), G. Thirel (2), E. Martin (2) and F. Habets (3) 1 : Direction.>")
, F. Regimbeau.>")
>")


 Course.>")
 patients Policy.>")


 C Asia Air Survey co., ltd New Forecast Technologies for Disaster Prevention and Mitigation 1.>")


