Download presentation
Presentation is loading. Please wait.

1
The Optimal Timing of Stage-2-Palliation after the Norwood Operation: A Multi-Institutional Analysis from the CHSS CHSS Fall Work Weekend November 19, 2016 James M. Meza, MD and Jake Jaquiss, MD (Study PI), for the Optimal Timing of Stage 2 Working Group
, for the Optimal Timing of Stage 2 Working Group.")
2
Overview Background, Rationale, Hypothesis
Study Population and Characteristics Outcomes and Risk Factors Determinants of Timing of Stage-2-Palliation Optimal Timing – Methods and Results Effect of interval procedures – Methods and Results Interpretation and Clinical Implications

3
Mortality during Staged Palliation
Survival through single ventricle palliation = 50-70% Mortality after Norwood and before Stage-2-Palliation (S2P) remains high Timing of S2P is physician modifiable Effect of timing not well understood
 remains high. Timing of S2P is physician modifiable. Effect of timing not well understood.")
4
Timing of S2P is a Complex Decision
Earlier S2P Reduce volume load on systemic ventricle Eliminate shunt-associated risks Normalize coronary blood flow in those with BT shunt Normalize pulmonary vascular flow and pressure Underdevelopment of pulmonary vasculature Failure of PVR to decrease Later S2P Growth of infant and pulmonary vasculature Potentially decreased resource utilization Increased exposure to risks of Norwood-associated physiology

5
Hypothesis An optimal timing exists
Norwood S2P Fontan ? An optimal timing exists Is based on patient-specific characteristics

6
Study Population & Characteristics

7
Patient Data Source Data Source = CHSS Critical Left Ventricular Outflow Tract Obstruction Registry Neonate ≤ age 30 days at admission to a CHSS institution 2005 onward AV & VA concordance Precludes an adequate systemic cardiac output through the aortic valve Study inclusion criteria Initial Norwood operation

8
Study Population 924 with an initial procedure, 72 excluded
CHSS LVOTO N=924 Eligible N=852 Initial procedure N=702 Norwood N=534 924 with an initial procedure, 72 excluded 852 included, 702 had an initial operation, 83 had an initial catheter procedure, 13 died before initial procedure , 54 alive without surgical information 534 Norwoods of the 702

9
Demographic Characteristics
Overall Cohort (N=534) Sex, male 66% (346) Prenatal diagnosis 73% (383) Prenatal intervention 1% (4) Gestational age (weeks) 39.0 (38-39) Birth weight (kg) 3.2 ( ) Low birth weight (< 2.5 kg) 16% (87) Genetic abnormality 7% (41) White race 84% (363)
 Sex, male. 66% (346) Prenatal diagnosis. 73% (383) Prenatal intervention. 1% (4) Gestational age (weeks) 39.0 (38-39) Birth weight (kg) 3.2 ( ) Low birth weight (< 2.5 kg) 16% (87) Genetic abnormality. 7% (41) White race. 84% (363)")
10
Institutional Diagnoses
Overall Cohort (N=534) Hypoplastic left heart syndrome 92% (493) Critical aortic stenosis 2% (13) Aortic valve atresia 0.6% (4) Mitral stenosis 0.2% (2) Mitral atresia Coarctation of the aorta 1% (3) Interrupted aortic arch 2% (11) Hypoplastic aortic arch
 Hypoplastic left heart syndrome. 92% (493) Critical aortic stenosis. 2% (13) Aortic valve atresia. 0.6% (4) Mitral stenosis. 0.2% (2) Mitral atresia. Coarctation of the aorta. 1% (3) Interrupted aortic arch. 2% (11) Hypoplastic aortic arch.")
11
Echocardiographic Data
Overall Cohort (N=534) Aortic atresia/mitral atresia 28% (151) Aortic atresia/mitral stenosis 18% (96) Aortic stenosis/mitral atresia 1% (5) Aortic stenosis/mitral stenosis 16% (84) Isolated aortic atresia 2% (13) Isolated aortic stenosis 7% (38) Isolated mitral atresia 2% (11) Isolated mitral stenosis 2% (8) Other 3% (16) Bilateral SVC 5% (19)
 Aortic atresia/mitral atresia. 28% (151) Aortic atresia/mitral stenosis. 18% (96) Aortic stenosis/mitral atresia. 1% (5) Aortic stenosis/mitral stenosis. 16% (84) Isolated aortic atresia. 2% (13) Isolated aortic stenosis. 7% (38) Isolated mitral atresia. 2% (11) Isolated mitral stenosis. 2% (8) Other. 3% (16) Bilateral SVC. 5% (19)")
12
Outcomes and Risk Factors

13
Outcomes after Norwood

14
Norwood Operative Characteristics
Overall Cohort (N=534) Age at Norwood (days) 6.0 (0-48) Shunt type MBTS 49% (263) RVPA conduit 50% (268) Central shunt 1% (3) Weight at Norwood (kg) 3.2 ( ) Elapsed time on CPB (min) 149.9 ± 45.9 Modified cerebral perfusion 91% (349) Duration of circulatory arrest (min) 8.0 ( )
 Age at Norwood (days) 6.0 (0-48) Shunt type. MBTS. 49% (263) RVPA conduit. 50% (268) Central shunt. 1% (3) Weight at Norwood (kg) 3.2 ( ) Elapsed time on CPB (min) ± Modified cerebral perfusion. 91% (349) Duration of circulatory arrest (min) 8.0 ( )")
15
Hazard Model for Death after Norwood
Probability of Survival Red line is parametric model, circles are KM estimates, dashed lines are 70% CL Months since Norwood

16
Multivariable Model Candidate covariates = baseline, demographic, clinical through end of Norwood

17
Death after Norwood

18
Outcomes after S2P

19
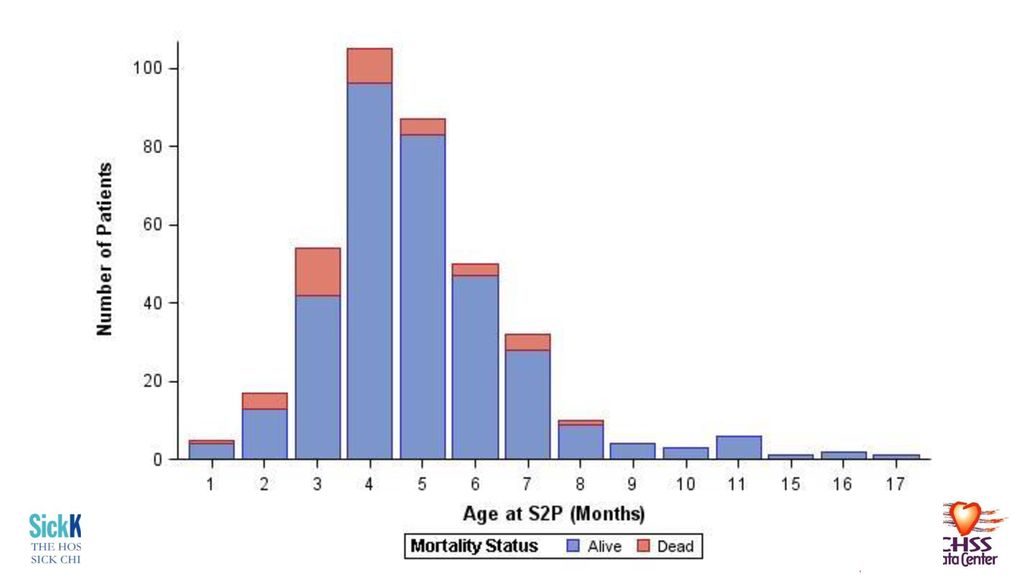
Age at S2P Median = 5.1 (4.3–6.2) months Range = 1.7-17.2 months
154 days ( ) Range = months days Not normally distributed
 Range = months days. Not normally distributed.")
21
Hazard Model for Death after S2P
Probability of Survival Red line is parametric model, circles are KM estimates, dashed lines are 70% CL Months since S2P

22
Variables – post-Norwood
Weights (z-score) Norwood, echo, cath, clinic, S2P Echo AVVR RV Function Cath PVR QpQS PA stenosis PA hypoplasia Chromosomal abnormality/genetic syndrome Shunt type and size Geographic region of S2P Season of S2P Bilateral SVC Post-Norwood Course Hospital LOS after Norwood Length of mechanical ventilation after Norwood Failed extubation after Norwood Home oxygen Tracheostomy Respiratory illness Unplanned readmission pre-S2P and LOS Delayed S2P? Diagnosis of NEC Diagnosis of GERD Interval cath and operative procedures Inpatient vs. outpatient status at time of Stage 2 Limits of documentation Mechanical ventilation at time of Stage 2 Pre-S2P clinic visit O2 sats at pre-op clinic
 Norwood, echo, cath, clinic, S2P. Echo. AVVR. RV Function. Cath. PVR. QpQS. PA stenosis. PA hypoplasia. Chromosomal abnormality/genetic syndrome. Shunt type and size. Geographic region of S2P. Season of S2P. Bilateral SVC. Post-Norwood Course. Hospital LOS after Norwood. Length of mechanical ventilation after Norwood. Failed extubation after Norwood. Home oxygen. Tracheostomy. Respiratory illness. Unplanned readmission pre-S2P and LOS. Delayed S2P Diagnosis of NEC. Diagnosis of GERD. Interval cath and operative procedures. Inpatient vs. outpatient status at time of Stage 2. Limits of documentation. Mechanical ventilation at time of Stage 2. Pre-S2P clinic visit. O2 sats at pre-op clinic.")
23
Post-Norwood Course Overall Cohort (N=534)
Overall Cohort (N=534) Length of Norwood hospitalization (days) 25 (16-40) Length of mechanical ventilation 7 (5-11) Required re-intubation after Norwood 7% (37) Required readmission for respiratory infection 5% (25) Required home oxygen 5% (27) Required tracheostomy 1% (3) Diagnosis of necrotizing enterocolitis 12% (64) Diagnosis of gastro-esophageal reflux 30% (158)
 Length of Norwood hospitalization (days) 25 (16-40) Length of mechanical ventilation. 7 (5-11) Required re-intubation after Norwood. 7% (37) Required readmission for respiratory infection. 5% (25) Required home oxygen. 5% (27) Required tracheostomy. 1% (3) Diagnosis of necrotizing enterocolitis. 12% (64) Diagnosis of gastro-esophageal reflux. 30% (158)")
24
Pre-S2P Cardiac Catheterization
Overall Cohort (N=534) Age at pre-S2P catheterization (days) 118 (84-154) Interval from catheterization to S2P (days) 28 (12-58) Weight (kg) 5.5 ( ) Weight-for-age z-score -1.1 ( ) Pulmonary vascular resistance (Wood units) 1.9 ( ) QpQs 1.0 ( ) Coarctation 15% (79/534) Moderate-severe RPA stenosis 15% (80) Moderate-severe RPA hypoplasia 10% (54) Moderate-severe LPA stenosis 17% (89) Moderate-severe LPA hypoplasia 13% (67)
 Age at pre-S2P catheterization (days) 118 (84-154) Interval from catheterization to S2P (days) 28 (12-58) Weight (kg) 5.5 ( ) Weight-for-age z-score ( ) Pulmonary vascular resistance (Wood units) 1.9 ( ) QpQs. 1.0 ( ) Coarctation. 15% (79/534) Moderate-severe RPA stenosis. 15% (80) Moderate-severe RPA hypoplasia. 10% (54) Moderate-severe LPA stenosis. 17% (89) Moderate-severe LPA hypoplasia. 13% (67)")
25
Pre-S2P Echocardiogram
Overall Cohort (N=534) Age at echocardiogram (days) 96 (28 – 139) Interval from echocardiogram to S2P (days) 40 (11-107) Weight (kg) 4.6 ( ) Weight-for-age z-score -1.2 ( ) Moderate-severe RV dysfunction 10% (51/534) Moderate-severe AVV regurgitation 22% (117/534)
 Age at echocardiogram (days) 96 (28 – 139) Interval from echocardiogram to S2P (days) 40 (11-107) Weight (kg) 4.6 ( ) Weight-for-age z-score ( ) Moderate-severe RV dysfunction. 10% (51/534) Moderate-severe AVV regurgitation. 22% (117/534)")
26
Pre-S2P Clinic Visit Overall Cohort (N=534) Age at clinic visit (days)
Overall Cohort (N=534) Age at clinic visit (days) 121 (93-157) Interval from clinic visit to S2P(days) 28 (12-58) Weight (kg) 5.4 ( ) Weight-for-age z-score -1.1 (-2.2 – 0.1) Oxygen saturation (%) 80 (76-83)
 Age at clinic visit (days) 121 (93-157) Interval from clinic visit to S2P(days) 28 (12-58) Weight (kg) 5.4 ( ) Weight-for-age z-score (-2.2 – 0.1) Oxygen saturation (%) 80 (76-83)")
27
Model for Death after S2P

28
Determinants of Timing of S2P

29
Determinants of Timing
Linear regression Outcome = age at S2P Candidate covariables – all from 1st two models

30
Determinants of Age at S2P

31
Determinants of Age at S2P

32
Analyzing Staged Procedures and Optimal Timing

33
Staged Procedures Conditional survival analysis [ CS = S(t|s) ]
Norwood S2P 4-Years Model 1 Model 2 Conditional survival analysis [ CS = S(t|s) ] Use both models Predict survival to day of S2P, then 2nd model for S2P for four years Accounts for all patients!
![Staged Procedures Conditional survival analysis [ CS = S(t|s) ]](http://slideplayer.com/slide/12957216/79/images/33/Staged+Procedures+Conditional+survival+analysis+%5B+CS+%3D+S%28t%7Cs%29+%5D.jpg "Norwood. S2P. 4-Years. Model 1. Model 2. Conditional survival analysis [ CS = S(t|s) ] Use both models. Predict survival to day of S2P, then 2nd model for S2P for four years. Accounts for all patients!")
34
Survival After Norwood
%

35
Survival after Norwood, through S2P
%

36
Survival through S2P Probability of Survival Months since Norwood
Survival at 4 years = 71±5% Probability of Survival COHORT AVERAGE Months since Norwood

37
Analyzing Timing Age at S2P identified as risk factor
Parametric model = mathematical equation Nomogram of survival vs. Age at S2P

38
post-Norwood Survival
Optimal Timing, by Age Risk-adjusted, 4-Year, post-Norwood Survival Age at S2P (months) “Cohort average”
 Cohort average")
39
Timing, by Age, with RV Dysfunction
No RV Dysfunction Risk-adjusted, 4-Year, post-Norwood Survival RV Dysfunction Age at S2P (months)
")
40
Timing, by Age, by Shunt Type
RVPA Conduit Risk-adjusted, 4-Year, post-Norwood Survival MBTS Age at S2P (months)
")
41
Optimal Timing, by Age Across various risk profiles
Low risk Average-risk Risk-adjusted, 4-Year, post-Norwood Survival High risk Age at S2P (months)
")
42
post-Norwood Survival
Optimal Timing, by WAZ Risk-adjusted, 4-Year, post-Norwood Survival Weight-for-Age Z-score at the pre-S2P cath “Cohort average”

43
Timing, by WAZ, with RV Dysfunction
No RV Dysfunction RV Dysfunction Risk-adjusted, 4-Year, post-Norwood Survival Weight-for-Age Z-score at the pre-S2P cath

44
Timing, by WAZ, by Shunt Type
Risk-adjusted, 4-Year, post-Norwood Survival Weight-for-Age Z-score at the pre-S2P cath RVPA MBTS

45
Optimal Timing, by WAZ Across various risk profiles
Risk-adjusted, 4-Year, post-Norwood Survival Weight-for-Age Z-score at the pre-S2P cath Low risk Average-risk High risk

46
Elective S2P

47
Indications for S2P

48
Operative Status vs. Age at S2P

49
Risk Factors in Elective Patients
Parameter Estimate ± STD P-value Reliability RV dysfunction on pre-S2P echo, moderate or severe 2.34 ± 0.54 < 73% Younger age at S2P (days), natural log transformation 1.74 ± 0.84 0.04 50%
, natural. log transformation ± %")
50
post-Norwood Survival
Optimal Timing, by Age Risk-adjusted, 4-Year, post-Norwood Survival Age at S2P (months) “Elective average”
 Elective average")
51
High-Risk Patients

52
Why does it appear that high-risk appear to do better with later S2P?
Regardless of age or WAZ – survival poor Especially with early S2P Cannot advocate non-intervention in the deteriorating “high-risk” infant “Length time bias” Highest risk patients die earlier – push down survival Less high risk – survive longer to undergo later S2P

53
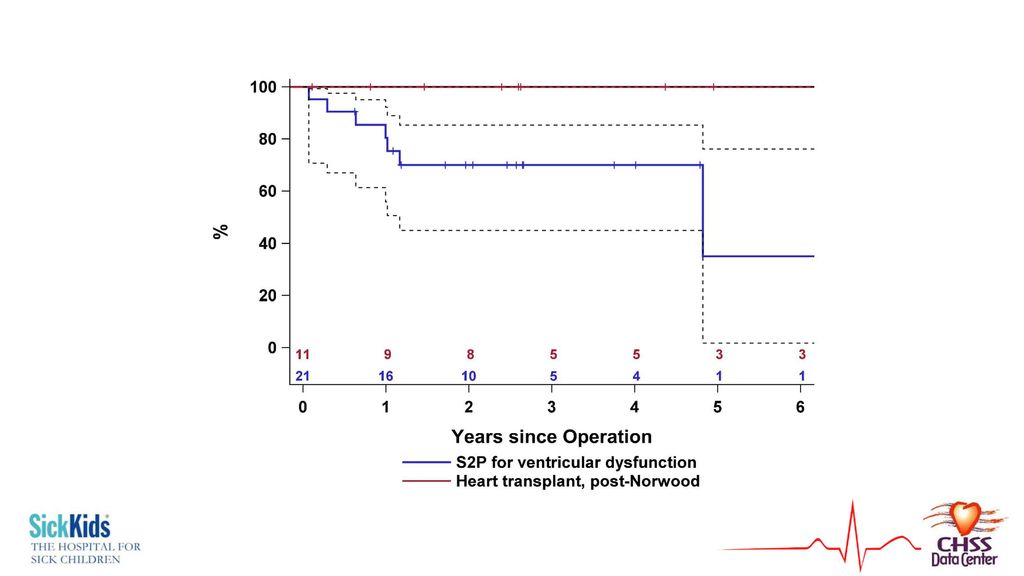
“High-Risk S2P” vs. Transplantation?
11 patients underwent heart transplantation after Norwood All currently still alive Can’t make a model, can only suggest this from descriptive statistics

55
Interval Procedures Norwood S2P 4-Years

56
Prevalence of Interval Procedures
Patients Total procedures # of Procedures Survival after Norwood Interval cardiac catheterization procedure 178 275 0-5 97% Interval operation 68 86 0-3 68%

57
Methodology First analyzed for development of 2nd model
But occur during Norwood – S2P interval Time-varying covariables Modulated Renewal

58
Time-Varying Analysis
Parameter Estimate ± STD P-value Interval cardiac catheterization procedure 0.10 ± 0.25 0.70 Interval operation 0.69 ± 0.24 0.004

59
Effect of Interval Operations
Probability of Survival Months since Norwood

60
Discussion, Implications, Conclusions

61
Low- and Average-Risk Patients
After 3-4 months and z-score > -2 for low and average risk patients “Elective” Patients are progressing early/being delayed for no reason Younger age – risk factor Converting some from elective non-elective? Outgrowing shunts? Waiting for shunt complications

62
High-Risk Patients Survival is substantially reduced
A high risk patient at Norwood doesn’t become a better candidate after S2P (survival cost still seen) Very poor survival with “early” S2P or low WAZ No weight-for-age z-score, just like no age “maximizes” survival in these patients Heart transplantation may maximize survival
 Very poor survival with early S2P or low WAZ. No weight-for-age z-score, just like no age maximizes survival in these patients. Heart transplantation may maximize survival.")
63
Interval Procedures Low threshold for catheter-based procedures
If facing a non-elective S2P with intervenable pathology (e.g. shunt stenosis), try to bridge to a later, elective S2P Operative procedures confer greater risk Don’t avoid doing Marker of more severe pathology and higher risk
, try to bridge to a later, elective S2P. Operative procedures confer greater risk. Don’t avoid doing. Marker of more severe pathology and higher risk.")
64
Implications Survival through staged procedures should be considered across all, not as individual discrete intervals Active plan can be developed or modified for planning timing of S2P This info can help with prioritization of rare hearts from transplantation – have an idea of who will fail staged palliation

65
THANK YOU

66
Median Age at S2P (months)†
Enrolled (n=534)* Mortality after Norwood (n=115)** Reached S2P (n=377) Median Age at S2P (months)† S2P (n=38)‡ Institution P 95 20% (19) 70 5.1 ( ) 10% (7) Institution I 63 30% (19) 40 6.3 ( ) 15% (6) Institution Q 52 12% (6) 43 4.8 ( ) 9% (4) Institution D 47 38 4.6 ( ) 11% (4) Institution T 36 19% (7) 29 6.1 ( ) 14% (4) Institution M 34 38% (13) 20 5.2 ( ) 15% (3) Institution F 30 20% (6) 22 3.2 ( ) 14% (3) Institution N 28% (8) 14 6.1 ( ) 7% (1) Institution H 0% (0) 21 4.0 ( ) 10% (2) Institution K 5.8 ( ) Institution A 19 42% (8) 11 6.3 ( ) 9% (1) Institution G 18 22% (4) 5.5 ( ) Institution S 35% (5) 7 4.0 ( ) 14% (1) Institution E 13 38% (5) 6 5.3 ( ) Institution B 36% (4) 4.8 ( ) 17% (1) Institution O 10 10% (1) 9 3.8 ( ) Institution L 11% (1) 8 5.6 ( ) Institution C 43% (3) 4 7.6 ( ) Institution J 2 6.8 ( ) Institution R 1 5.1 ( ) Institution U 3.2 ( )
* Mortality after. Norwood (n=115)** Reached S2P. (n=377) Median Age at S2P (months)† S2P (n=38)‡ Institution P % (19) ( ) 10% (7) Institution I % (19) ( ) 15% (6) Institution Q % (6) ( ) 9% (4) Institution D ( ) 11% (4) Institution T % (7) ( ) 14% (4) Institution M % (13) ( ) 15% (3) Institution F % (6) ( ) 14% (3) Institution N. 28% (8) ( ) 7% (1) Institution H. 0% (0) ( ) 10% (2) Institution K. 5.8 ( ) Institution A % (8) ( ) 9% (1) Institution G % (4) 5.5 ( ) Institution S. 35% (5) ( ) 14% (1) Institution E % (5) ( ) Institution B. 36% (4) 4.8 ( ) 17% (1) Institution O % (1) ( ) Institution L. 11% (1) ( ) Institution C. 43% (3) ( ) Institution J ( ) Institution R ( ) Institution U. 3.2 ( )")
Similar presentations


 Blood pressure ↓ Fall in TM 1 and 2, returns to baseline.>")


