Download presentation
Presentation is loading. Please wait.

1
The Demographic Transition — A Contemporary Look at a Classic Model
[Use this training PowerPoint presentation to introduce educators to techniques for working with students on the occurrence of HIV/AIDS. This topic is lesson plan 3 from the “Making Population Real” curricula designed for the AP-level.] Speaking notes: Introduce the topic and yourself. Briefly mention that the activities we’ll go through are from a larger teaching package called “Making Population Real” and these materials are by the Population Reference Bureau (PRB), a nongovernmental, research organization based in Washington, DC that provides timely and objective information on U.S. and international population trends and their implications. Lesson plans of Making Population Real are available free on-line at from “Making Population Real” by the Population Reference Bureau
, a nongovernmental, research organization based in Washington, DC that provides timely and objective information on U.S. and international population trends and their implications. Lesson plans of Making Population Real are available free on-line at from Making Population Real by the Population Reference Bureau.")
2
Today’s Agenda Remind about the “classic” model of demographic transition Explore alternative patterns from today’s developing countries (Russia & Japan African models Discuss the use of models (models aren’t “real”) I’ll introduce the objectives and teaching standards that we’ll cover; Describe and explore the “classic” model of demographic transition; Explore alternative patterns from today’s developing countries; Discuss the use of models; And finally, we will briefly note how this relates to a set of curricula on population and provide more information about the organization that developed these materials.
 I’ll introduce the objectives and teaching standards that we’ll cover; Describe and explore the classic model of demographic transition; Explore alternative patterns from today’s developing countries; Discuss the use of models; And finally, we will briefly note how this relates to a set of curricula on population and provide more information about the organization that developed these materials.")
3
Making Population Real – Lesson Plan 2: The Demographic Transition
Issues Population growth Development Population Concepts Classic model of demographic transition Patterns of changing birth and death rates Tools Line graphs Research and analysis Today, we’ll be discussing population growth and development By looking at a model called the demographic transition, focusing on changing birth and death rates over time. We’ll use line graphs to visualize the patterns and compare various countries to the model.

4
Objectives To understand the classic demographic transition (DT) model
To explain assumptions and limitations of the classic DT model To construct graphs of contemporary demographic change To explain contemporary demographic patterns in the context of the classic DT model Population growth and decline over time and space 4. Regional variations of demographic transitions Our objectives are to …[see slide].

5
What is the Demographic Transition?
The shift from high to low mortality and fertility Based on the experience of Western Europe Began by Warren Thompson in 1929 Further developed in 1945 by Frank Notestein A sign of socio-economic progress? The shift from high mortality and fertility to low mortality and fertility is known as the “demographic transition.” It is based on the experience of Western Europe, in particular England and Wales. This model was first described by the American demographer Warren Thompson in 1929. In 1945, Frank W. Notestein further developed this theory and suggested that there was a relationship between population change and industrialization. A debate continues questioning if population growth must decline for economic development or if economic progress (or industrialization) leads to slower population growth. In light of this debate, the completion of the demographic transition has come to be associated with socioeconomic progress. [FYI – The factors that drive childbearing trends—such as the economy, education, gender relations, and access to family planning—are numerous and complex. These same factors are signs of socioeconomic development.] The shift from high mortality and fertility to low mortality and fertility is known as the “demographic transition.” It is based on the experience of Western Europe, in particular England and Wales. This model was first described by the American demographer Warren Thompson in 1929. In 1945, Frank W. Notestein further developed this theory and suggested that there was a relationship between population change and industrialization. A debate continues questioning if population growth must decline for economic development or if economic progress (or industrialization) leads to slower population growth. In light of this debate, the completion of the demographic transition has come to be associated with socioeconomic progress. [FYI – The factors that drive childbearing trends—such as the economy, education, gender relations, and access to family planning—are numerous and complex. These same factors are signs of socioeconomic development.]
 leads to slower population growth. In light of this debate, the completion of the demographic transition has come to be associated with socioeconomic progress. [FYI – The factors that drive childbearing trends—such as the economy, education, gender relations, and access to family planning—are numerous and complex. These same factors are signs of socioeconomic development.] The shift from high mortality and fertility to low mortality and fertility is known as the demographic transition. It is based on the experience of Western Europe, in particular England and Wales. This model was first described by the American demographer Warren Thompson in In 1945, Frank W. Notestein further developed this theory and suggested that there was a relationship between population change and industrialization. A debate continues questioning if population growth must decline for economic development or if economic progress (or industrialization) leads to slower population growth. In light of this debate, the completion of the demographic transition has come to be associated with socioeconomic progress. [FYI – The factors that drive childbearing trends—such as the economy, education, gender relations, and access to family planning—are numerous and complex. These same factors are signs of socioeconomic development.]")
6
The Classic Demographic Transition
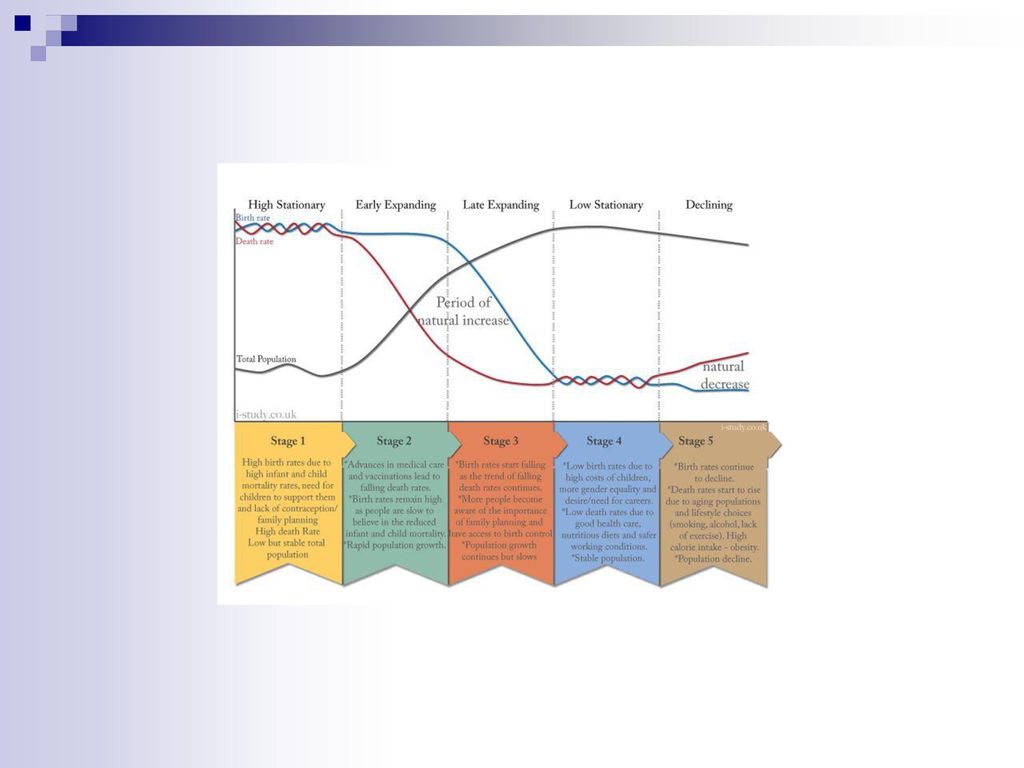
This chart explains the typical changes in the birth rate and death rate that happen as a country industrializes (including the U.S.). It models the classic demographic transition. This shift occurred throughout Europe, North America, and a number of other areas in the 19th and early 20th centuries, and started in many developing countries in the middle of the 20th century. Stage 1: The trend of high birth and death rates (and minimal population growth) Stage 2: Starts when the death rate begins to drop for years, and often decades, until the beginning of its stabilization at a new, low level. (In Europe, this stage happened because of improved health and living conditions and marked beginning a period of rapid population growth.) Stage 3: Next the birth rate falls to about the same, low level as the death rate. Stage 4: With birth and death rates at similar low levels, the equilibrium of slow population growth is regained. [FYI - Declines in the birth rate around the world have also become steeper due to the widespread availability of contraceptives in the last half of the 20th Century. In % of married women worldwide had access to family planning. By % of married women had access to family planning. (PRB, “Transitions in World Population,” Population Bulletin, p. 8)] Stage 1 Stage 2 Stage 3 Stage 4 Time Natural increase Birth rate Death rate Note: Natural increase is produced from the excess of births over deaths. This chart explains the typical changes in the birth rate and death rate that happen as a country industrializes (including the U.S.). It models the classic demographic transition. This shift occurred throughout Europe, North America, and a number of other areas in the 19th and early 20th centuries, and started in many developing countries in the middle of the 20th century. Stage 1: The trend of high birth and death rates (and minimal population growth) Stage 2: Starts when the death rate begins to drop for years, and often decades, until the beginning of its stabilization at a new, low level. (In Europe, this stage happened because of improved health and living conditions and marked beginning a period of rapid population growth.) Stage 3: Next the birth rate falls to about the same, low level as the death rate. Stage 4: With birth and death rates at similar low levels, the equilibrium of slow population growth is regained. [FYI - Declines in the birth rate around the world have also become steeper due to the widespread availability of contraceptives in the last half of the 20th Century. In % of married women worldwide had access to family planning. By % of married women had access to family planning. (PRB, “Transitions in World Population,” Population Bulletin, p. 8)]
. It models the classic demographic transition. This shift occurred throughout Europe, North America, and a number of other areas in the 19th and early 20th centuries, and started in many developing countries in the middle of the 20th century. Stage 1: The trend of high birth and death rates (and minimal population growth) Stage 2: Starts when the death rate begins to drop for years, and often decades, until the beginning of its stabilization at a new, low level. (In Europe, this stage happened because of improved health and living conditions and marked beginning a period of rapid population growth.) Stage 3: Next the birth rate falls to about the same, low level as the death rate. Stage 4: With birth and death rates at similar low levels, the equilibrium of slow population growth is regained. [FYI - Declines in the birth rate around the world have also become steeper due to the widespread availability of contraceptives in the last half of the 20th Century. In % of married women worldwide had access to family planning. By % of married women had access to family planning. (PRB, Transitions in World Population, Population Bulletin, p. 8)] Stage 1. Stage 2. Stage 3. Stage 4. Time. Natural. increase. Birth rate. Death rate. Note: Natural increase is produced from the excess of births over deaths. This chart explains the typical changes in the birth rate and death rate that happen as a country industrializes (including the U.S.). It models the classic demographic transition. This shift occurred throughout Europe, North America, and a number of other areas in the 19th and early 20th centuries, and started in many developing countries in the middle of the 20th century. Stage 1: The trend of high birth and death rates (and minimal population growth) Stage 2: Starts when the death rate begins to drop for years, and often decades, until the beginning of its stabilization at a new, low level. (In Europe, this stage happened because of improved health and living conditions and marked beginning a period of rapid population growth.) Stage 3: Next the birth rate falls to about the same, low level as the death rate. Stage 4: With birth and death rates at similar low levels, the equilibrium of slow population growth is regained. [FYI - Declines in the birth rate around the world have also become steeper due to the widespread availability of contraceptives in the last half of the 20th Century. In % of married women worldwide had access to family planning. By % of married women had access to family planning. (PRB, Transitions in World Population, Population Bulletin, p. 8)]")
7
Examine the Model A Model is …
a representation of some phenomenon of the real world made in order to facilitate an understanding of its workings a simplified and generalized version of real events, from which the incidental detail has been removed The previous graph models the demographic transition. As we continue looking at a few specific countries, you will their actual graphs are not as clear cut.

8
Making Population Real – Lesson Plan 2: The Demographic Transition
What population patterns are revealed in the traditional Demographic Transition model? Assignment: Construct a graph of birth and death rates in England from Presenter Instructions: Distribute the one-page handout, “Data for Graphing” Construct a line graph with years on the horizontal axis and births/deaths per 1,000 on the vertical axis. Create two lines, one for birth rate, and one for death rate.

9
Making Population Real – The Demographic Transition
Why does this pattern occur? [A: The short answer is that as people become more economically secure, particularly as the infant and child mortality rates fall, people feel much less need for many children. Indeed, in a highly developed industrial economy, more children can become a financial burden. Another part of this answer would point to women’s rights and access to education and jobs outside the home. Or the transition from agrarian to industrialized economies.]

10
Demographic Transition in Sweden and Mexico
Compare the transitions between these two countries to the classic model. Why are the two countries so different? [A: The short answer is that Sweden’s transition occurred gradually over 150 years. Mexico experienced rapid declines in death rates due to rapid implementation of better health care and sanitation technologies. The result was that Mexico’s population boomed during this period. It took time for the decline in birth rates to catch up. At the same time, this boom created its own momentum as all these new families have children of their own. Eventually Mexico’s population will likely stabilize (or even shrink), but at a much greater overall population. This pattern was repeated in many nations in the 20th Century, fueling a global population explosion. However, we’re also seeing in several countries – including Sweden – birth rates have dropped below death rates leading to population decline in most of Europe, Japan, and some other nations.] Sources: B.R. Mitchell, European Historical Statistics (1976): table B6; Council of Europe, Recent Demographic Developments in Europe 2001 (2001): tables T3.1 and T4.1; CELADE, Boletin demografico 69 (2002): tables 4 and 7; Francisco Alba-Hernandez, La poblacion de Mexico (1976): 14; and UN Population Division, World Population Prospects: The 2002 Revision (2003): 326. Births/Deaths per 1,000 1750 Compare the transitions between these two countries to the classic model. Why are the two countries so different? [A: The short answer is that Sweden’s transition occurred gradually over 150 years. Mexico experienced rapid declines in death rates due to rapid implementation of better health care and sanitation technologies. The result was that Mexico’s population boomed during this period. It took time for the decline in birth rates to catch up. At the same time, this boom created its own momentum as all these new families have children of their own. Eventually Mexico’s population will likely stabilize (or even shrink), but at a much greater overall population. This pattern was repeated in many nations in the 20th Century, fueling a global population explosion. However, we’re also seeing in several countries – including Sweden – birth rates have dropped below death rates leading to population decline in most of Europe, Japan, and some other nations.]
, but at a much greater overall population. This pattern was repeated in many nations in the 20th Century, fueling a global population explosion. However, we’re also seeing in several countries – including Sweden – birth rates have dropped below death rates leading to population decline in most of Europe, Japan, and some other nations.] Sources: B.R. Mitchell, European Historical Statistics (1976): table B6; Council of Europe, Recent Demographic Developments in Europe 2001 (2001): tables T3.1 and T4.1; CELADE, Boletin demografico 69 (2002): tables 4 and 7; Francisco Alba-Hernandez, La poblacion de Mexico (1976): 14; and UN Population Division, World Population Prospects: The 2002 Revision (2003): 326. Births/Deaths per 1, Compare the transitions between these two countries to the classic model. Why are the two countries so different [A: The short answer is that Sweden’s transition occurred gradually over 150 years. Mexico experienced rapid declines in death rates due to rapid implementation of better health care and sanitation technologies. The result was that Mexico’s population boomed during this period. It took time for the decline in birth rates to catch up. At the same time, this boom created its own momentum as all these new families have children of their own. Eventually Mexico’s population will likely stabilize (or even shrink), but at a much greater overall population. This pattern was repeated in many nations in the 20th Century, fueling a global population explosion. However, we’re also seeing in several countries – including Sweden – birth rates have dropped below death rates leading to population decline in most of Europe, Japan, and some other nations.]")
11
Making Population Real – Lesson Plan 2: The Demographic Transition
How useful is the classic model of demographic transition in today’s world? Assignment: Construct a graph showing the birth and death rates for one of four assigned countries. Presenter Instructions: Distribute the handout, “Data Tables” Participants will need pencils and graph paper. Divide participants into small groups. Have these groups count off by one to four. Assign one of the four nations on the hand-out to each number. Each group will construct a line graph with years on the horizontal axis and births/deaths per 1,000 on the vertical axis. Create two lines, one for birth rate, and one for death rate.

12
Data for Demographic Transition
Discussion: How closely do these countries match the pattern of England? Sweden? Mexico? Another? Is this nation growing, shrinking, or staying even? Almost all future population growth is in developing nations. Europe, North America, and a number of other areas went through the Demographic Transition in the 19th and early 20th centuries Most of Africa, Asia, and Latin America are in the 2nd or third stages In the discussion, questions about these countries and the data might be raised. Here’s a little about each of the four countries: Mauritius – the country had a well-known and very successful program to slow population growth, hence the sharp drop in fertility since the early 1970s. Cameroon has maintained a high population growth rate and is at the beginning of the 3rd stage of the Demographic Transition. Poverty levels have remained high with 51% of the population living below US$2 per day (PRB, 2006 World Population Data Sheet). Singapore, one of the Economic Tigers, has attracted many migrants as the country’s wealth grew and job opportunities rose. It also experienced a sharp decline in fertility (from in the handout), suggesting improvements in social welfare, in addition to the economic growth. Nepal has made slow, but steady progress in reducing fertility (in the beg. of the 3rd stage of the Demographic Transition). One possible explanation is a strong son preference, keeping fertility above the replacement level. Poverty levels have also remained high, with 69% of the population living below US$2 per day (PRB, 2006 World Population Data Sheet).
. Singapore, one of the Economic Tigers, has attracted many migrants as the country’s wealth grew and job opportunities rose. It also experienced a sharp decline in fertility (from in the handout), suggesting improvements in social welfare, in addition to the economic growth. Nepal has made slow, but steady progress in reducing fertility (in the beg. of the 3rd stage of the Demographic Transition). One possible explanation is a strong son preference, keeping fertility above the replacement level. Poverty levels have also remained high, with 69% of the population living below US$2 per day (PRB, 2006 World Population Data Sheet).")
13
Is the Demographic Transition Model Still Useful?
How well does the classic model work? Is it a useful framework for developing countries? Do developing countries need to share the experiences of Europe and the United States? Is the socioeconomic change experienced by industrialized countries a prerequisite or a consequence of demographic transition? [To prepare for this discussion, read pages 3-11 in the Population Reference Bureau’s Population Bulletin on “Transitions in World Population.” March 2004] How well does the classic model work? Is the Demographic Transition Model useful as a framework for evaluating demographic change in regions outside Europe and the U.S.? [A: There are significant and sometimes complex variances to the model, whether due to economic chaos (e.g. Russia), disease (South Africa), or continued population growth (Congo), yet the model is still useful as a guide and as a standard of comparison.] Is it necessary that all countries share the experiences of Europe and the United States in order to pass through a demographic transition? [A: Participants may raise questions related to women’s rights or cultural values (religion) as other important factors. All countries must not necessarily share the same experiences of Europe and the USA, but in some way economic opportunities must be available to all (men and women, as well as all, if not most ethnic/racial groups) for a country to complete the Demographic Transition.] Is the socioeconomic change experienced by industrialized countries a prerequisite or a consequence of demographic transition? Are there multiple ways to achieve a similar end? This is a question of ongoing debate.
, disease (South Africa), or continued population growth (Congo), yet the model is still useful as a guide and as a standard of comparison.] Is it necessary that all countries share the experiences of Europe and the United States in order to pass through a demographic transition [A: Participants may raise questions related to women’s rights or cultural values (religion) as other important factors. All countries must not necessarily share the same experiences of Europe and the USA, but in some way economic opportunities must be available to all (men and women, as well as all, if not most ethnic/racial groups) for a country to complete the Demographic Transition.] Is the socioeconomic change experienced by industrialized countries a prerequisite or a consequence of demographic transition Are there multiple ways to achieve a similar end This is a question of ongoing debate.")
14
Making Population Real – Lesson Plan 2: The Demographic Transition
Activities: Explaining Population Change: Graph changing birth & death rates in classic model (England) Graph & compare rates for Sweden & Mexico Global Population Patterns and Demographic Transitions: Calculate natural increase by continent & country Compare demographic with economic indicators Can an Old Model Explain New Trends? Compare national population patterns to model The exercises we just covered come from activities one and three of the lesson plan on the demographic transition. The second activity, “Global Population Patterns and Demographic Transitions,” helps students gain a clearer picture of birth and death rates around the world.
 Graph & compare rates for Sweden & Mexico. Global Population Patterns and Demographic Transitions: Calculate natural increase by continent & country. Compare demographic with economic indicators. Can an Old Model Explain New Trends Compare national population patterns to model. The exercises we just covered come from activities one and three of the lesson plan on the demographic transition. The second activity, Global Population Patterns and Demographic Transitions, helps students gain a clearer picture of birth and death rates around the world.")
15
Germany

Similar presentations